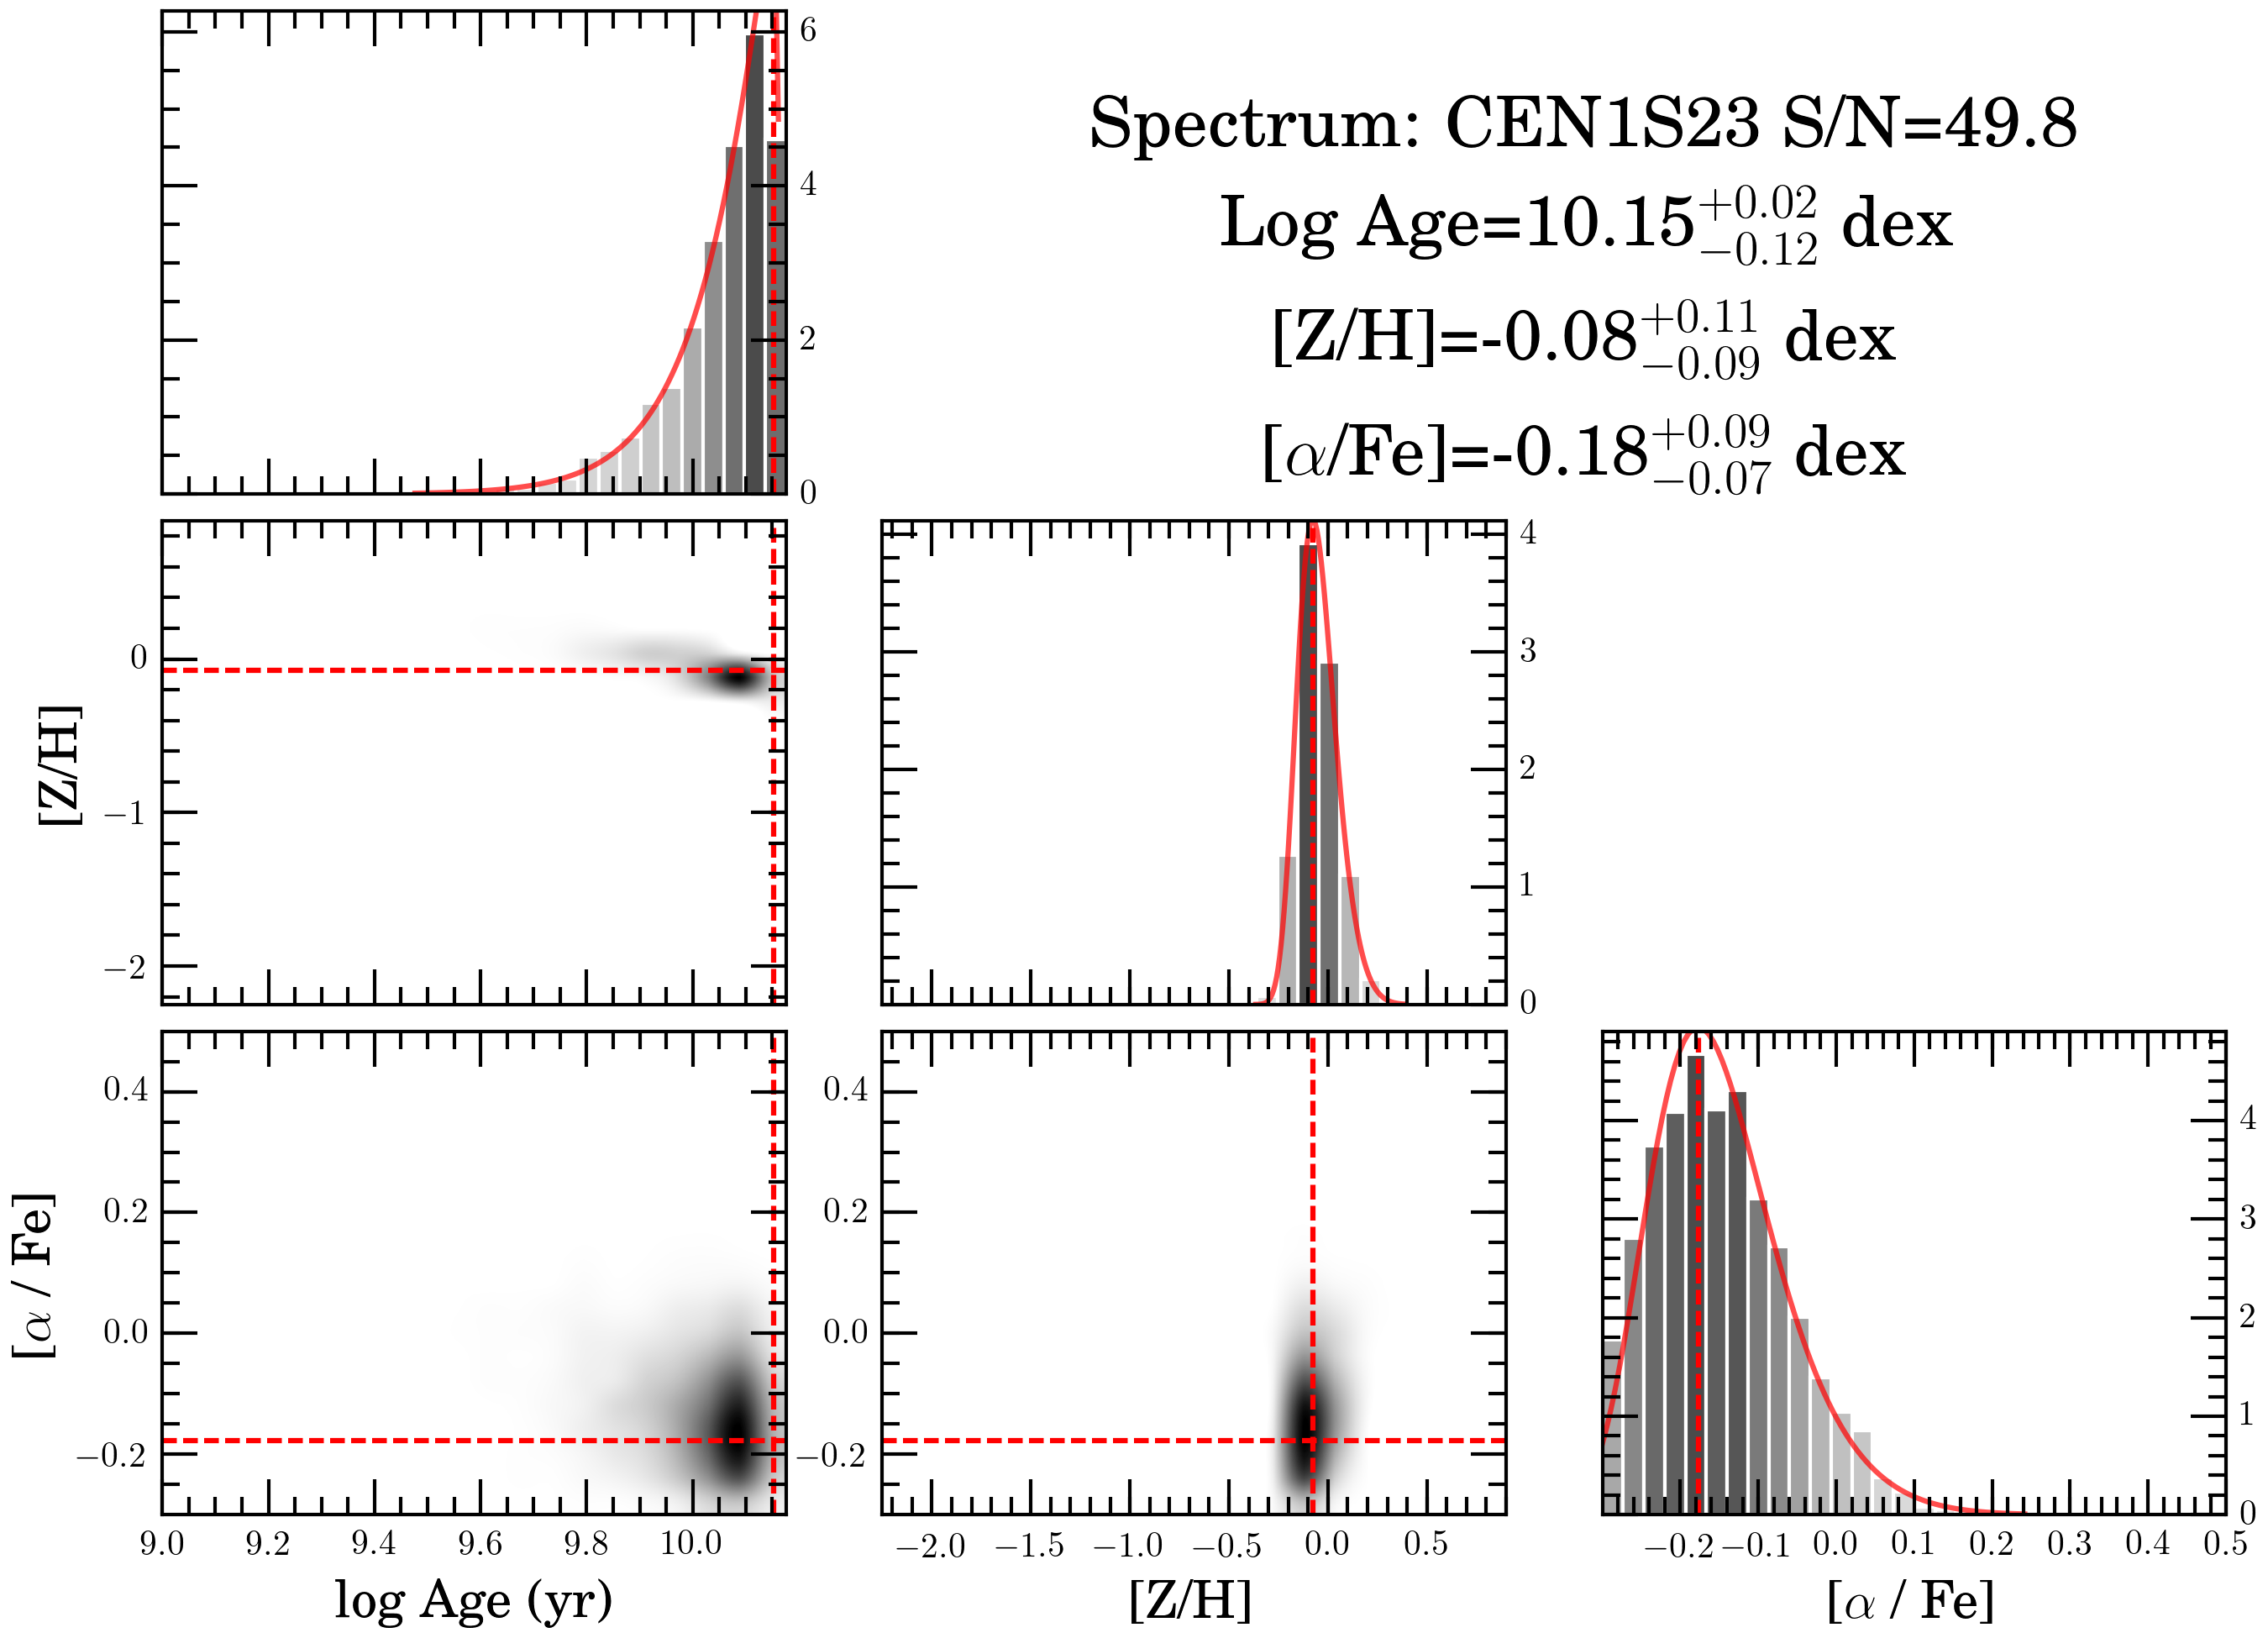
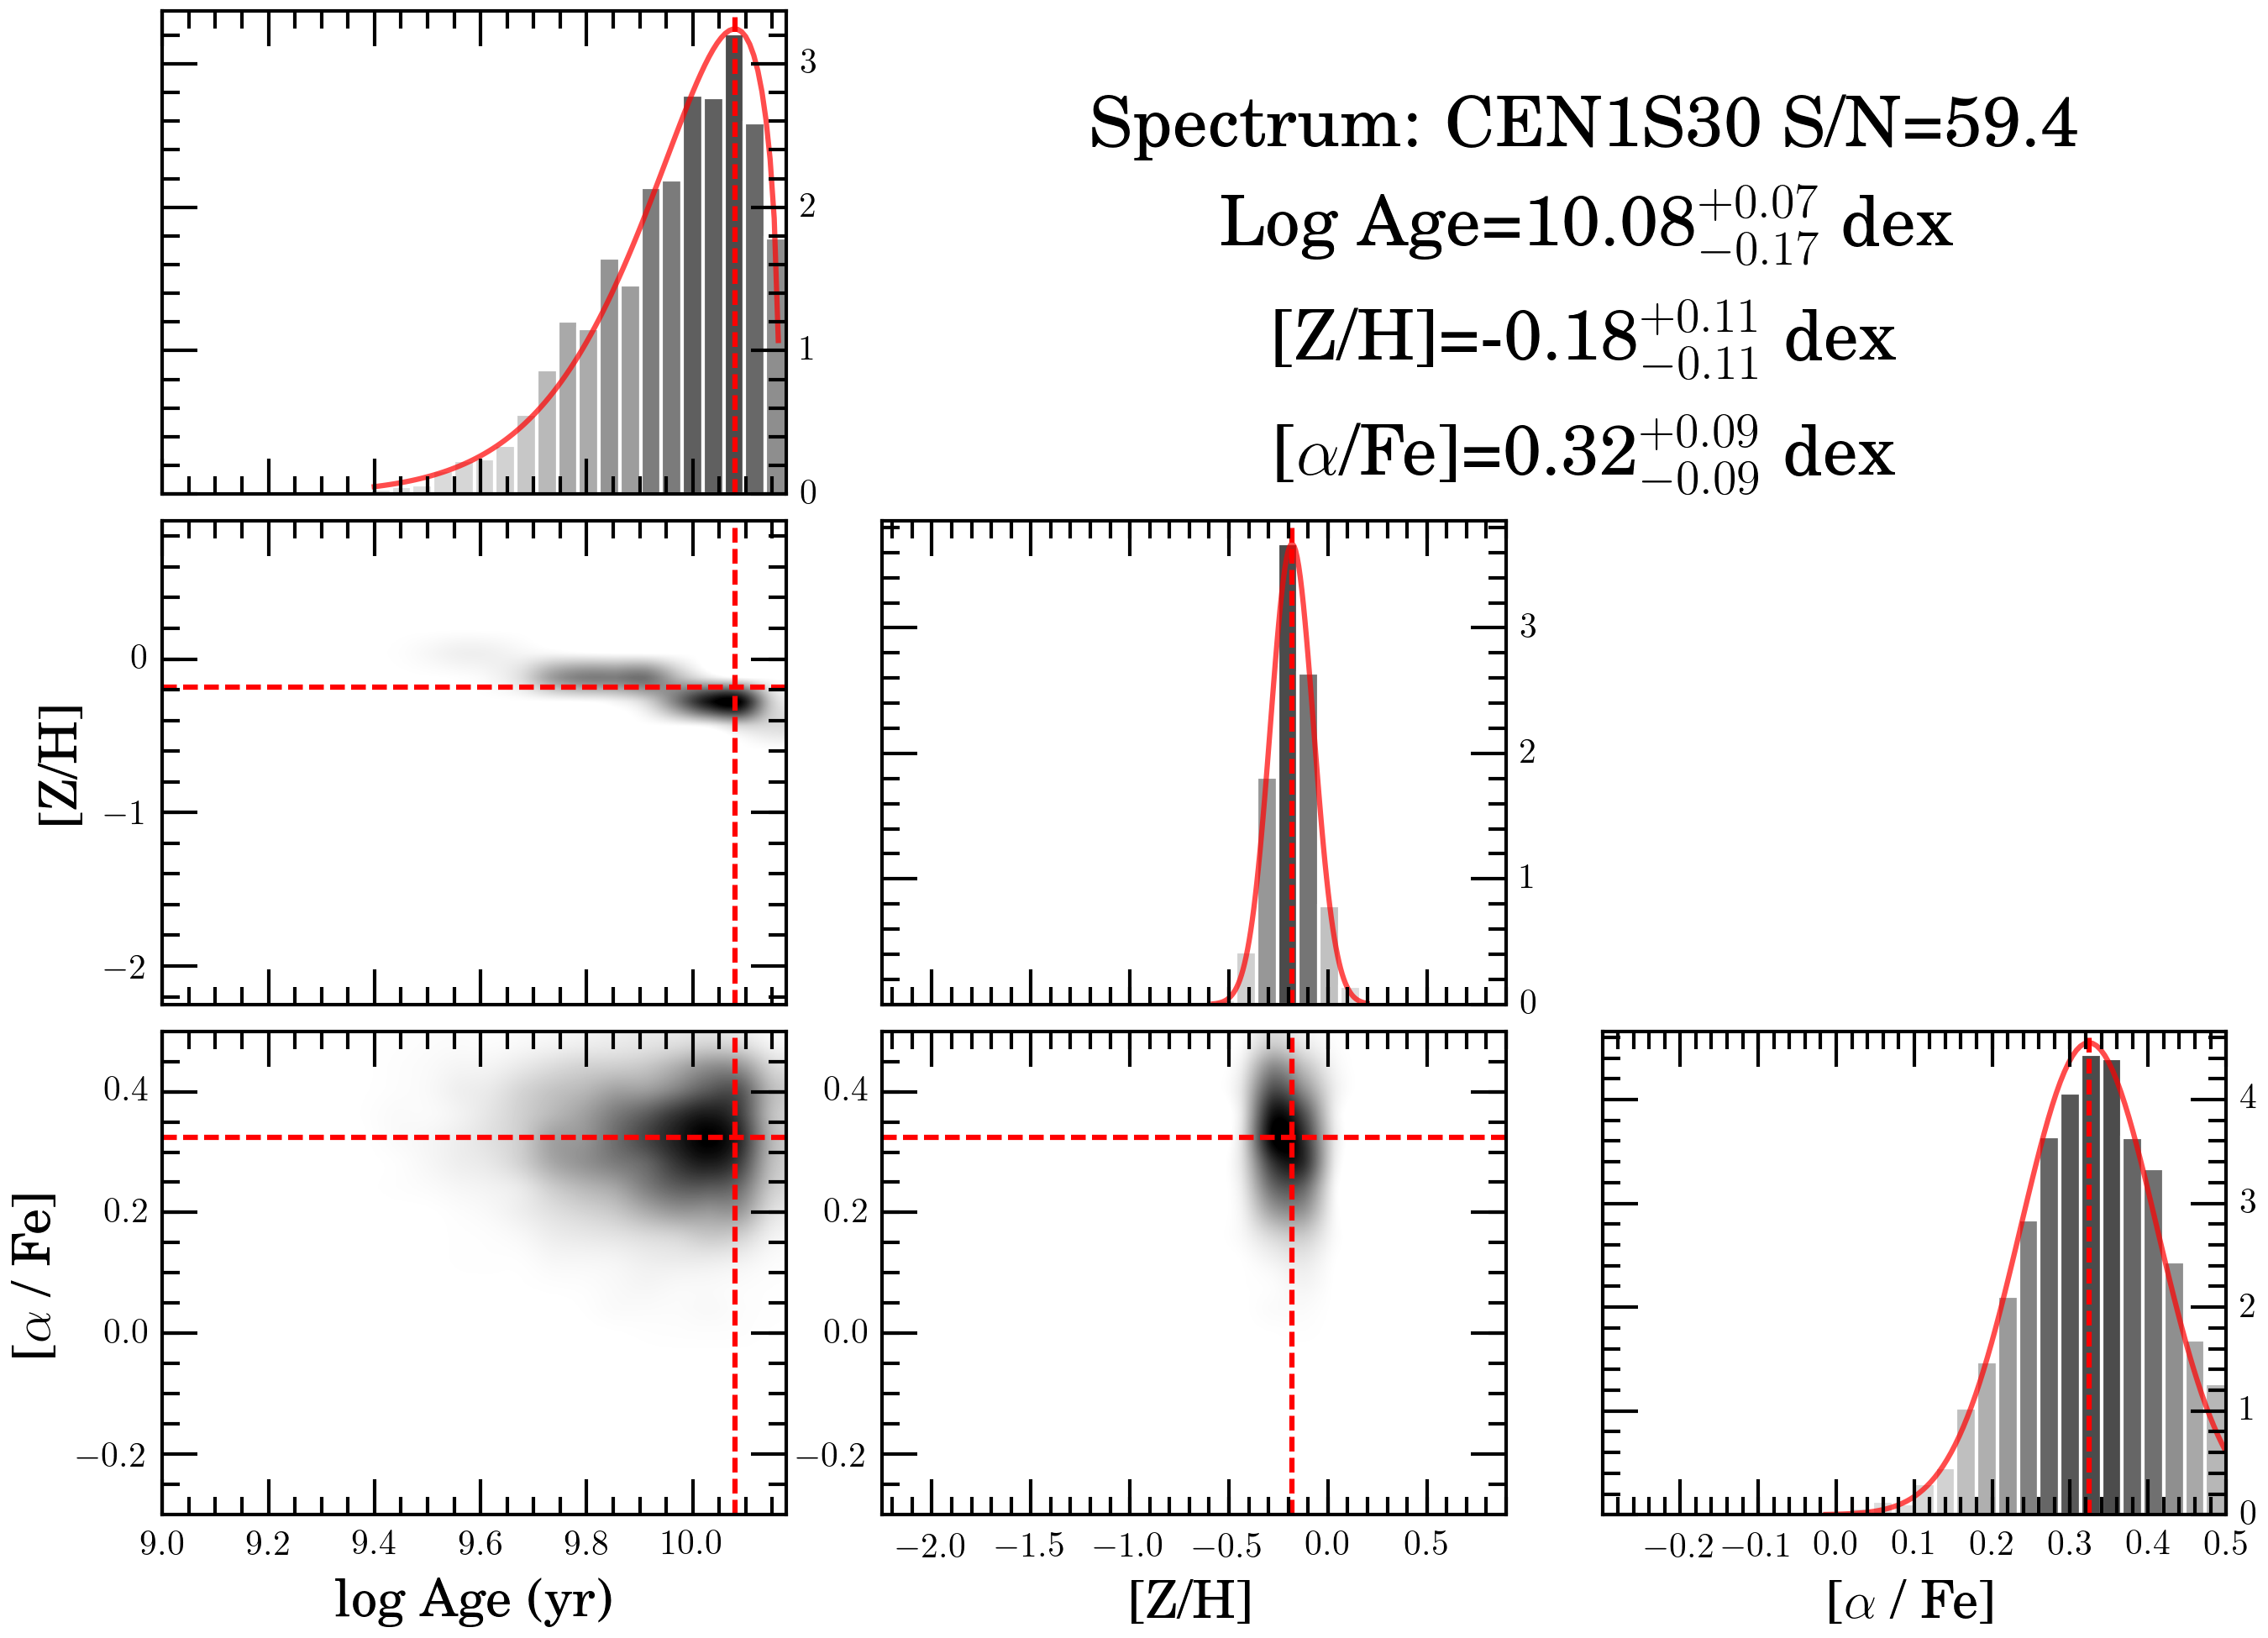
Fig. 5

Examples of the posterior distributions for two spectra using the MCMC method. The panels in the main diagonal show histograms of the marginalized distributions, which are used to determine the representative values and their uncertainties. The thick red lines show the best fit to the posterior samples, either a Gaussian or a generalized extreme value function. Projections of the posterior distributions in the lower left panels show the correlations among parameters. The histograms in the upper right corner of each panel indicate the maximum probabilities and the 1σ deviations of the stellar population parameters in each case.
Current usage metrics show cumulative count of Article Views (full-text article views including HTML views, PDF and ePub downloads, according to the available data) and Abstracts Views on Vision4Press platform.
Data correspond to usage on the plateform after 2015. The current usage metrics is available 48-96 hours after online publication and is updated daily on week days.
Initial download of the metrics may take a while.