Fig. 4
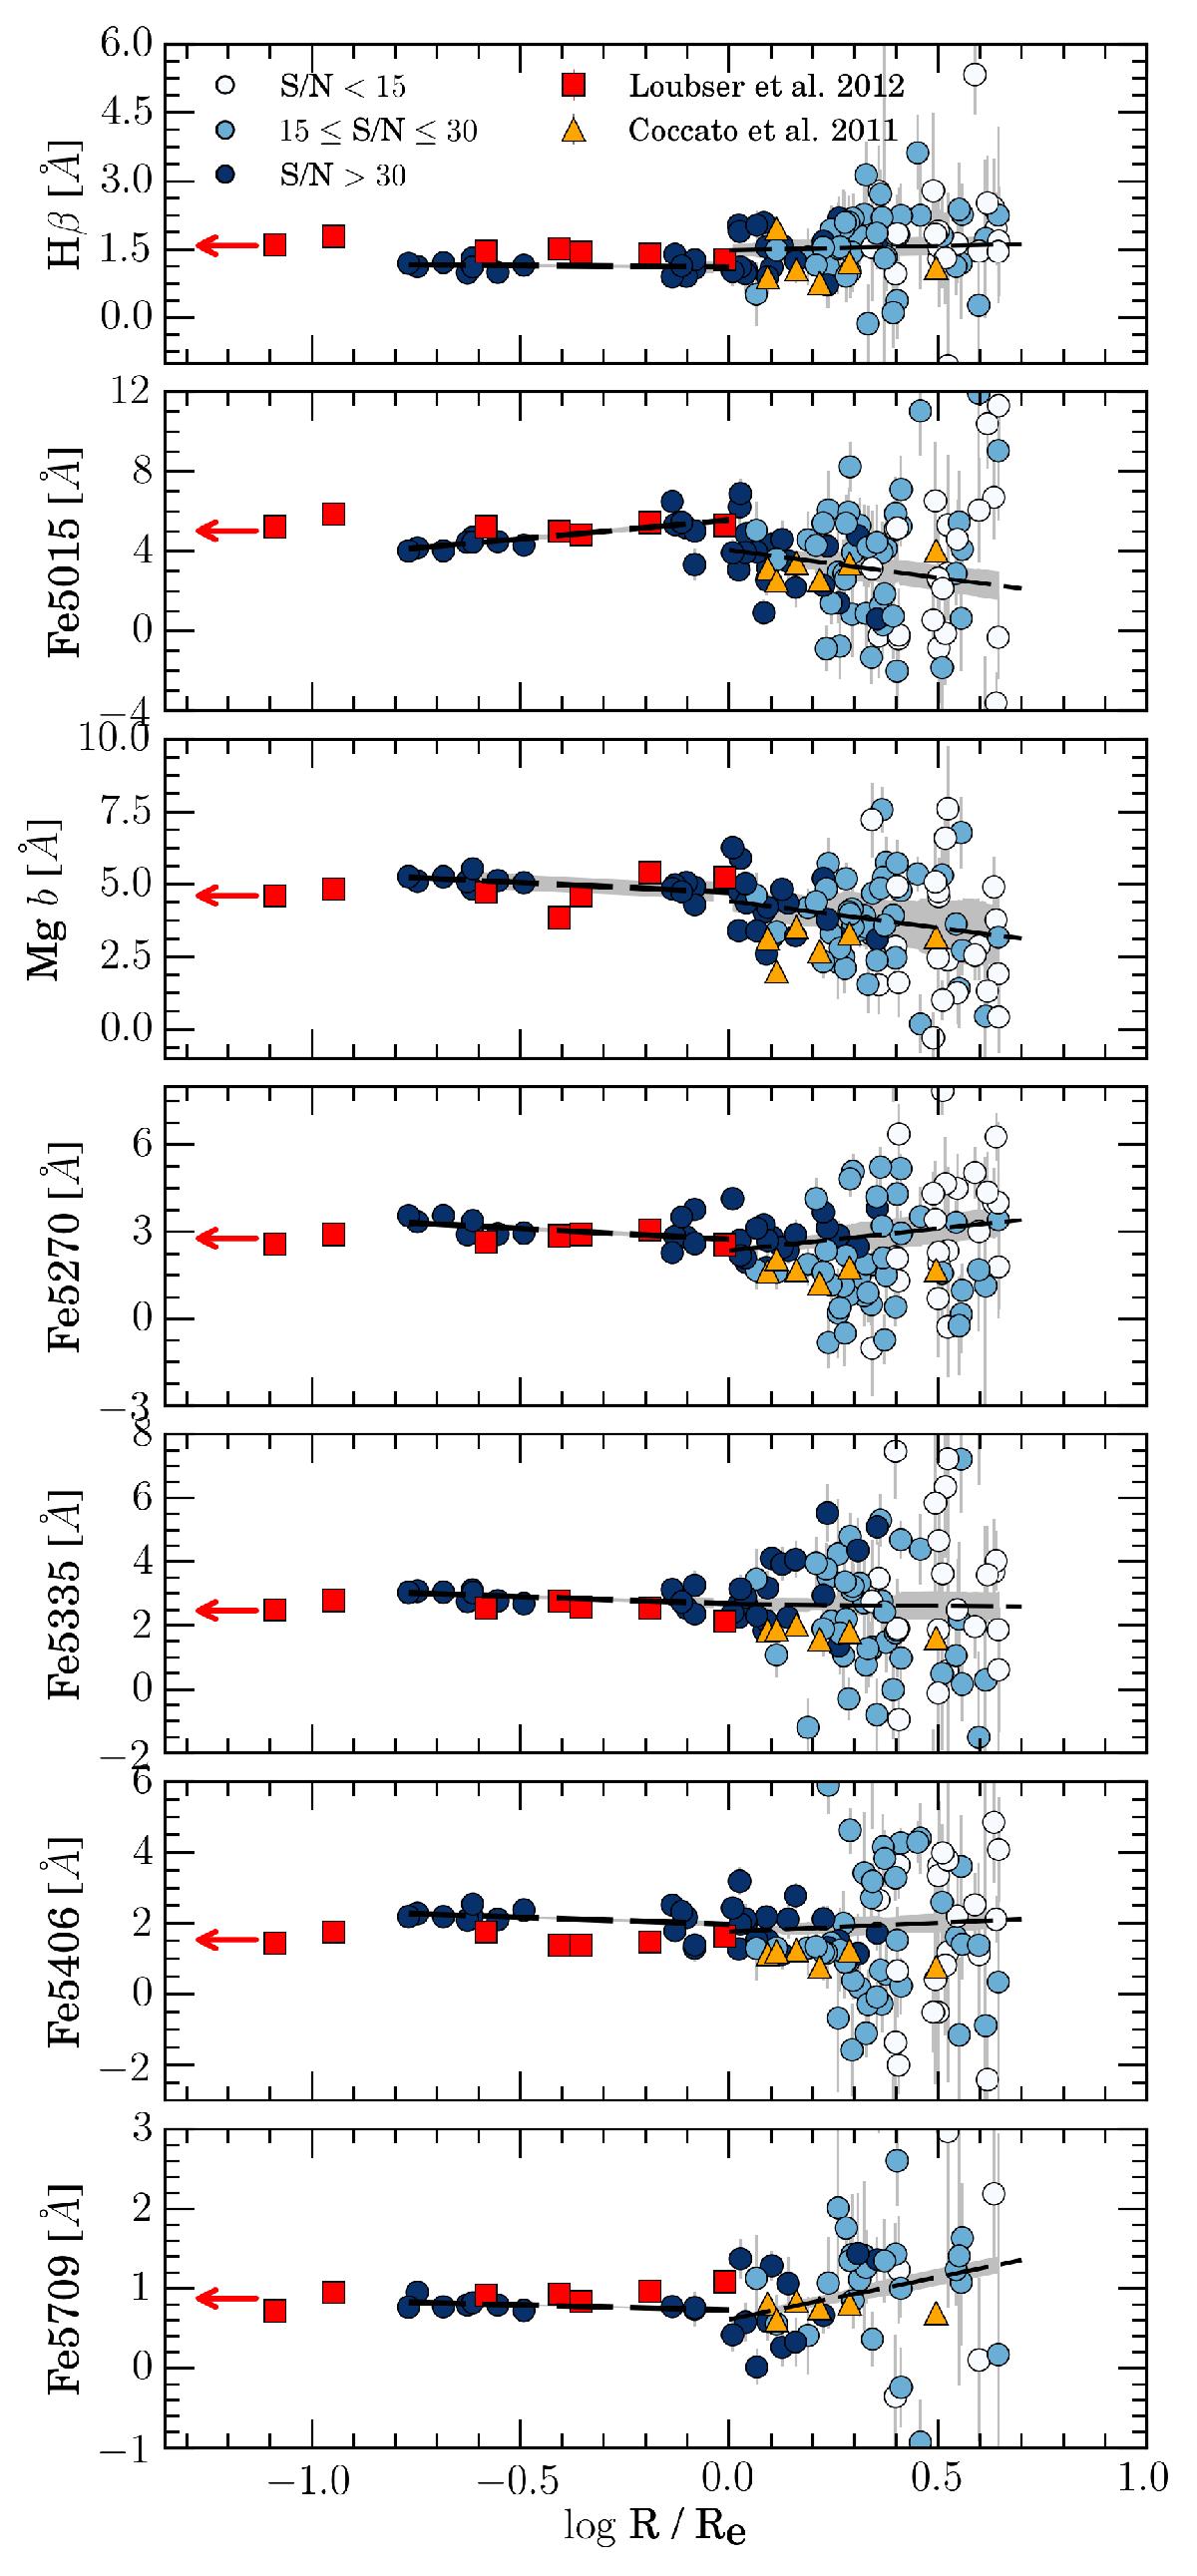
Lick indices as a function of the distance from the centre of NGC 3311. The EWs measured for our spectra are shown by full circles, with different colours according to their S/N, as indicated in the top panel. Long-slit data from the literature is also displayed, including Coccato et al. (2011), as orange triangles, Loubser & Sánchez-Blázquez (2012) as red squares and Loubser et al. (2009) as red arrows. The two black dashed lines indicate the gradients obtained by linear regression in the two regions corresponding to the inner galaxy and the external halo. The grey shaded areas around the dashed lines represent the variance in the equivalent width generated by a systematic error in the sky subtraction by ±1%. The different gradients indicate different mechanisms for the assembly of the stellar haloes.
Current usage metrics show cumulative count of Article Views (full-text article views including HTML views, PDF and ePub downloads, according to the available data) and Abstracts Views on Vision4Press platform.
Data correspond to usage on the plateform after 2015. The current usage metrics is available 48-96 hours after online publication and is updated daily on week days.
Initial download of the metrics may take a while.