Fig. 7
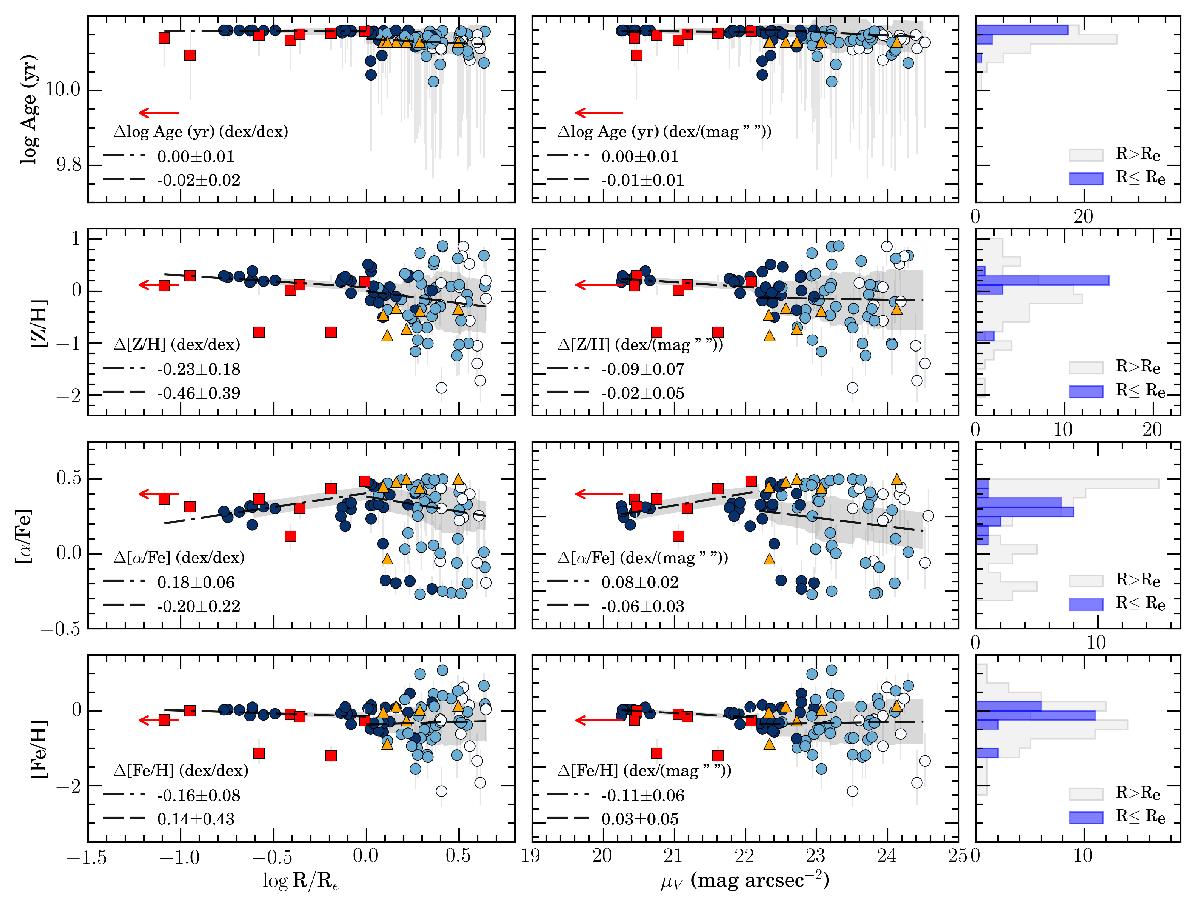
Gradients of the stellar population parameters. Left: ages, [Z/H], [α/Fe], and [Fe/H] as function of the log-distance to the centre of NGC 3311. Circles indicate data points from this work, coloured according to their S/N as dark blue (S/N> 30), light blue (15 ≤ S/N ≤ 30) and white (S/N< 15). Data from Loubser et al. (2009) and Coccato et al. (2011) are shown by red arrow and orange triangles, respectively. New calculated values for the stellar population parameters based on data from Loubser & Sánchez-Blázquez (2012) are indicated by red squares. Dot-dashed and dashed lines indicate the regression for the inner and external halo, respectively, with the gradients displayed in the bottom left of each panel. The grey shades represent the systematic error of under/over subtraction of the sky by 1%. Centre: same as for the left panels, but with gradients measured as a function of the V-band surface brightness. Right: histograms of the distribution of the stellar population parameters, combining our data with those of Loubser & Sánchez-Blázquez (2012), with the inner galaxy and external halo shown in blue and grey bins, respectively. The gradients in the inner galaxy are consistent with the predictions from a quasi-monolithic collapse model, while the shallow azimuthally-averaged gradients and the large scatter in the outer halo are consistent with the results of accreted stars from a variety of different progenitors.
Current usage metrics show cumulative count of Article Views (full-text article views including HTML views, PDF and ePub downloads, according to the available data) and Abstracts Views on Vision4Press platform.
Data correspond to usage on the plateform after 2015. The current usage metrics is available 48-96 hours after online publication and is updated daily on week days.
Initial download of the metrics may take a while.