Fig. A.1
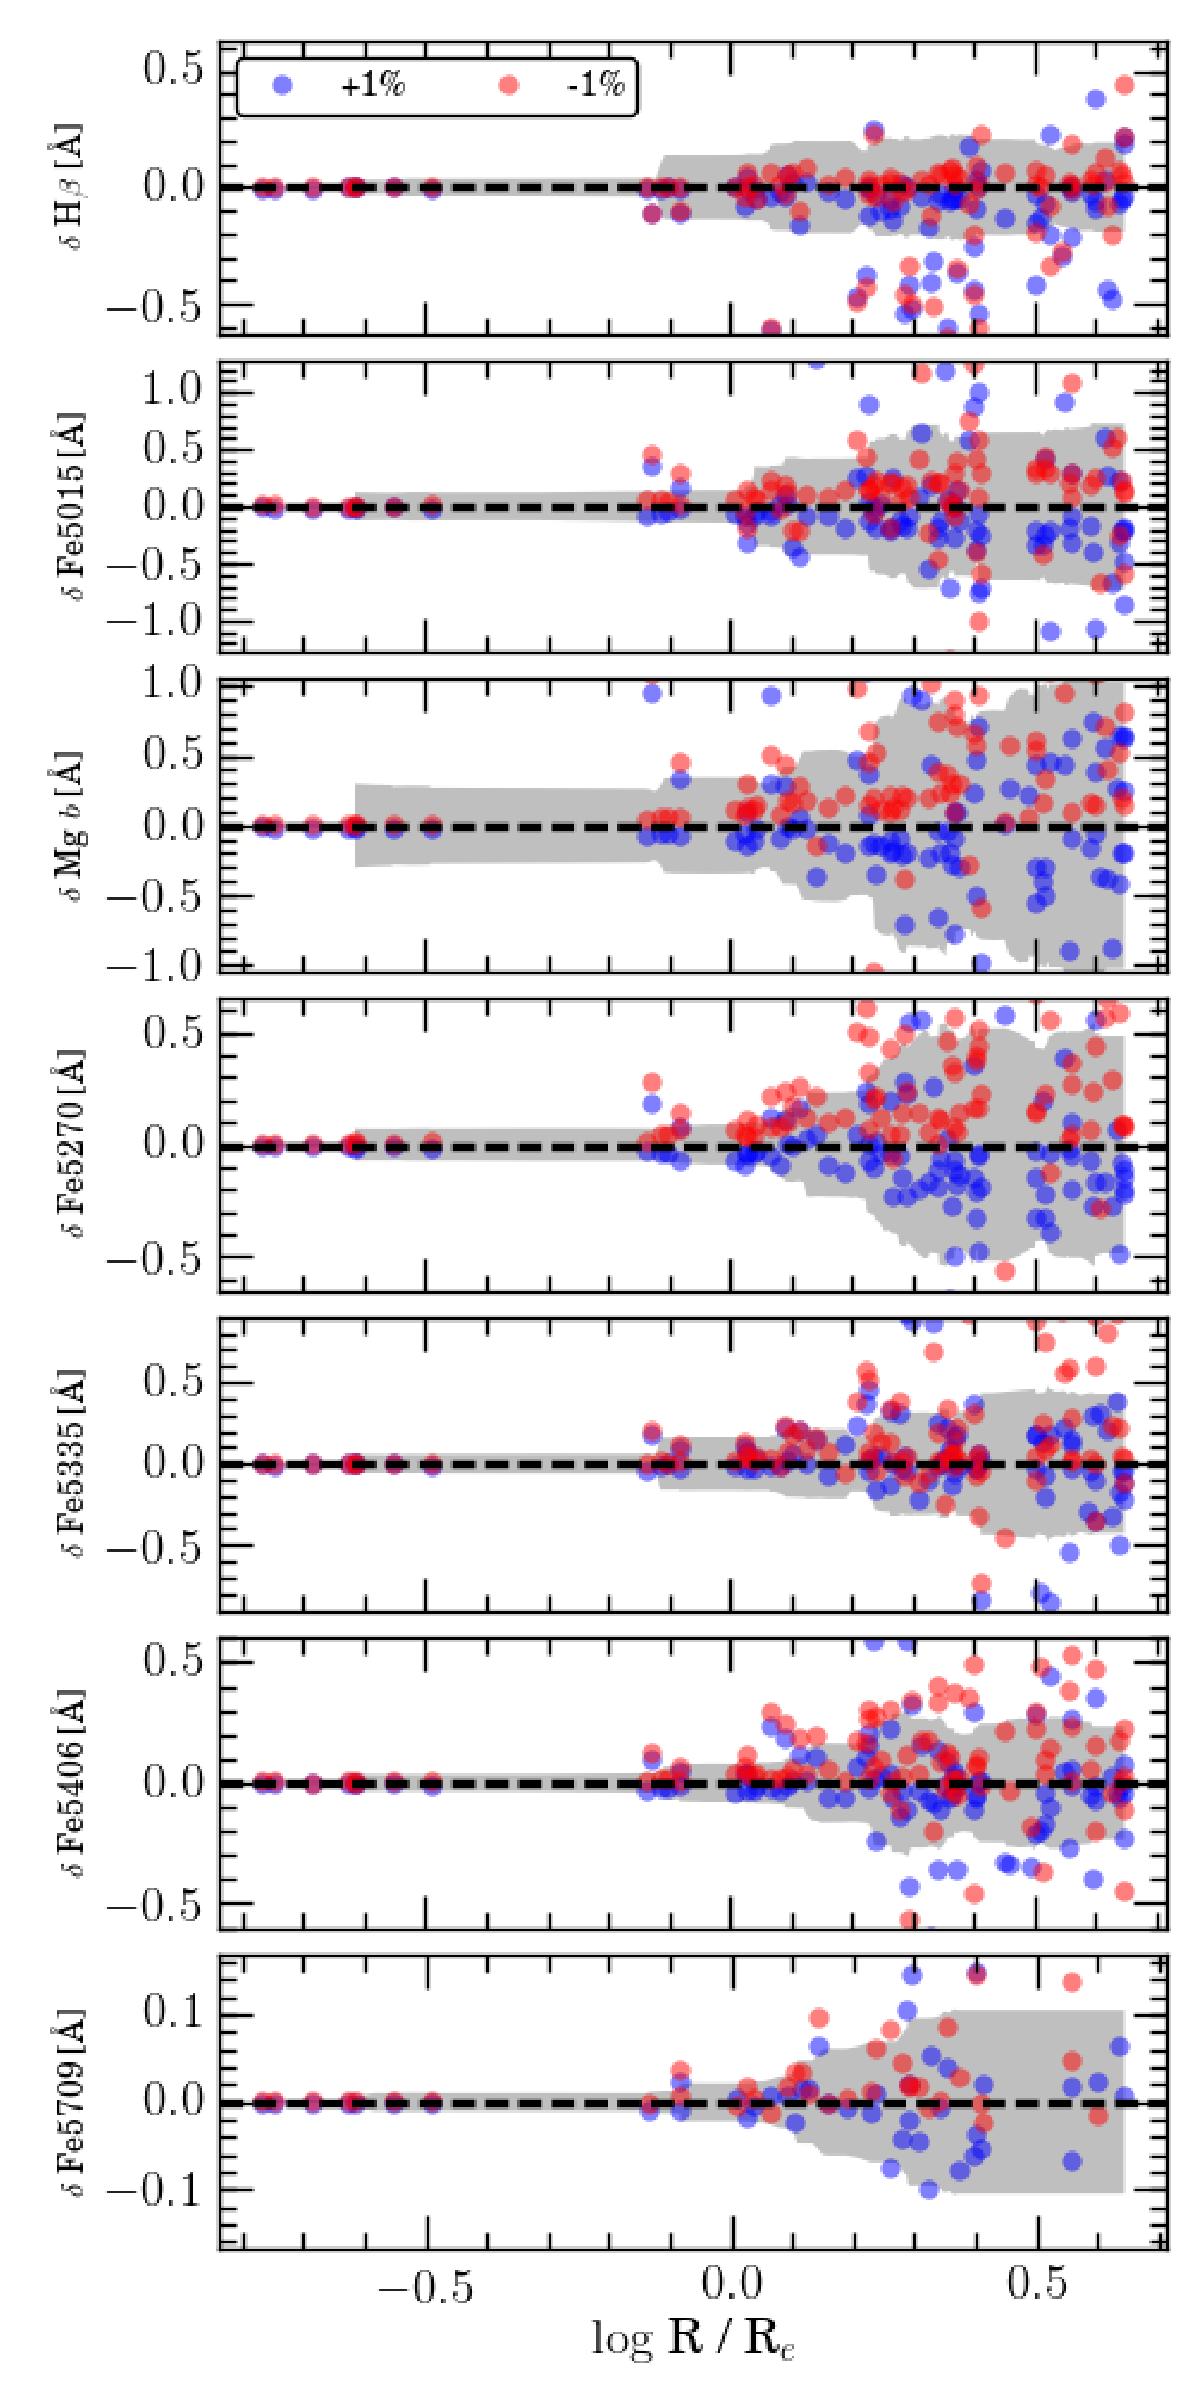
Difference of the Lick indices values generated by a systematic error in the sky subtraction of ± 1% as a function of the distance to the centre of NGC 3311. The blue (red) circles represent the measurements performed by the addition (subtraction) of 1% of the sky spectra. The grey shaded areas represent the rolling standard deviation in the measurements.
Current usage metrics show cumulative count of Article Views (full-text article views including HTML views, PDF and ePub downloads, according to the available data) and Abstracts Views on Vision4Press platform.
Data correspond to usage on the plateform after 2015. The current usage metrics is available 48-96 hours after online publication and is updated daily on week days.
Initial download of the metrics may take a while.