| Issue |
A&A
Volume 587, March 2016
|
|
|---|---|---|
| Article Number | A62 | |
| Number of page(s) | 16 | |
| Section | Interstellar and circumstellar matter | |
| DOI | https://doi.org/10.1051/0004-6361/201423984 | |
| Published online | 17 February 2016 | |
Large dust gaps in the transitional disks of HD 100453 and HD 34282
Connecting the gap size to the spectral energy distribution and mid-infrared imaging
1 Hamburg Observatory, Hamburg University, Gojenbergsweg 112, 21029 Hamburg, Germany
e-mail: This email address is being protected from spambots. You need JavaScript enabled to view it.
2 Leiden Observatory, Leiden University, PO Box 9513, 2300 RA Leiden, The Netherlands
3 Astronomy Department, University of Florida, Gainesville, FL 32611, USA
Received: 11 April 2014
Accepted: 5 October 2015
Abstract
Context. The formation of dust gaps in protoplanetary disks is one of the most important signs of disk evolution and might indicate the formation of planets.
Aims. We aim to characterize the flaring disk structure around the Herbig Ae/Be stars HD 100453 and HD 34282. Their spectral energy distributions (SEDs) show an emission excess between 15−40 μm, but very weak (HD 100453) and no (HD 34282) signs of the 10 and 20 μm amorphous silicate features. We investigate whether this implies the presence of large dust gaps.
Methods. We investigated spatially resolved mid-infrared Q-band images taken with Gemini North/MICHELLE. We performed radiative transfer modeling and examined the radial distribution of dust. We simultaneously fit the Q-band images and SEDs of HD 100453 and HD 34282.
Results. Our solutions require that the inner halos and outer disks be separated by large dust gaps that are depleted with respect to the outer disk by a factor of 1000 or more. The inner edges of the outer disks of HD 100453 and HD 34282 have temperatures of ~160 ± 10 K and ~60 ± 5 K, respectively. Because of the high surface brightness of these walls, they dominate the emission in the Q band. Their radii are constrained at 20-2+2 AU and 92-17+31 AU, respectively.
Conclusions. HD 100453 and HD 34282 most likely have disk dust gaps. The upper limit of the dust mass in each gap is estimated to be about 10-7 M⊙. We find that the locations and sizes of disk dust gaps are connected to the SED, as traced by the mid-infrared flux ratio F30/F13.5. We propose a new classification scheme for the Meeus groups based on the F30/F13.5 ratio. The absence of amorphous silicate features in the observed SEDs is caused by the depletion of small (≲1 μm) silicate dust at temperatures above ≳160 K, which could be related to the presence of a dust gap in that region of the disk.
Key words: stars: individual: HD 100453 / stars: individual: HD 34282 / stars: pre-main sequence / protoplanetary disks / planet-disk interactions / stars: variables: T Tauri, Herbig Ae/Be
© ESO, 2016
1. Introduction
Transitional disks have dust-depleted gaps and inner holes in their dust distribution and they form a separate class of protoplanetary disks (Williams & Cieza 2011). The presence of dust gaps and inner dust holes may be indicators that planets are forming in the disks. To search for evidence of planet formation and characterize their physical and chemical conditions, the location and sizes of dust gaps in protoplanetary disks have to be investigated.
Transitional disks can be identified on the basis of their low near-infrared excess (e.g. Calvet et al. 2005; Espaillat et al. 2007; Najita et al. 2007). Analysis of their spectral energy distribution (SED) may indicate that their inner regions are depleted of dust by several orders of magnitude (see Fig. 6, Sect. 4 and Maaskant et al. 2013). However, modeling the radial disk structure by fitting only the SED is highly degenerate. Dust imaging of a protoplanetary disks enables studying the spatial distribution of dust grains for different sizes in the disk. High spatial resolution observations of transitional disks reveal complex disk structures and can be used to study the interaction between dust gaps and protoplanets (e.g., van der Marel et al. 2013; Casassus et al. 2013; Quanz et al. 2013). Characterizing the connection between the radial structure and the SED is thus important to gain insight into the role of planet formation in the evolution of protoplanetary disks.
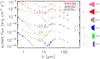 |
Fig. 1 SEDs of group Ib Herbig Ae/Be stars in the sample of Maaskant et al. (2014). There is a great similarity in the shape of the SEDs. The fluxes are scaled so that the objects are sorted by dust gap size, with the smallest dust gap radius at the top and the largest dust gap radius at the bottom. The flux scaling factors for the objects from top to bottom are 10, 5, 1, 0.03, 0.003, and 0.003. |
Herbig Ae/Be stars are intermediate-mass stars with circumstellar disks (e.g., Natta et al. 2007). The SEDs of Herbig Ae/Be stars can be separated into two groups (Meeus et al. 2001). Group I, with strong excess at mid- to far-infrared wavelengths, and group II, without strong excess at mid- to far-infrared, but with a remarkable similarity in spectral shape. A first interpretation for the evolutionary link between these groups was proposed by Dullemond & Dominik (2004, 2005). These authors suggested that grain growth and settling cause a decrease in the mid- to far-infrared excess. It was proposed that in this scenario, the disk structure evolves from flaring (group I) to flat (group II). However, recent studies indicate that almost all group I objects have large dust gaps (Grady et al. 2005; Honda et al. 2012; Maaskant et al. 2013). This implies that it is unlikely that group I sources with large dust gaps can evolve to group II disks, where no large dust gaps are found. To solve this problem, Maaskant et al. (2013) suggested that both groups evolve from a primordial continuous flaring disk, but may follow different pathways. The disks of group I objects are flaring and transitional as a result of the formation of large dust gaps. The disks of group II objects are self-shadowed because grain growth and vertical settling have flattened the outer disk. In addition to the geometrical classification, the flaring and flat disks with silicate features are called group Ia and group IIa, respectively; those without silicate features are called group Ib and group IIb.
In this paper, we investigate spatially resolved direct imaging mid-infrared observations of two protoplanetary disks presented in Mariñas et al. (2011). As these images are most sensitive to thermal emission of micron-size grains, they are suitable to study the radial density structure of transitional disks with large dust depleted gaps. To derive the properties of the disk, we perform an analysis of Q-band images similar to that carried out in Maaskant et al. (2013).
The content of this paper is outlined in the following way. In Sect. 2 we introduce the Herbig stars HD 100453 and HD 34282. In Sect. 3 we discuss the Q-band observations and photometric properties of our sample. Section 4 describes the radiative transfer code MCMax and the dust model. In Sect. 5 we derive the properties of the disk structures and constrain the radii of the inner edges of the outer disks. The discussion and conclusions are given in Sects. 6 and 7.
2. Sample
We here study the Herbig Ae/Be objects HD 100453 and HD 34282. In this section, we present a brief summary. The SEDs of HD 100453 and HD 34282 are characterized by a strong excess of mid-IR emission at ~15−40 μm (Fig. 1). HD 100453 may show a very weak sign of amorphous silicate features (Fig. 2), which are entirely absent in HD 34282. The spectra of HD 100453 and HD 34282 show PAH emission bands. Their I6.2/I11.3 feature ratios are 2.25 and 1.82, respectively, which is relatively high, possibly indicating optically thin gas flows through the disk dust gaps (Maaskant et al. 2014).
2.1. HD 100453
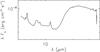 |
Fig. 2 Close-up of the Spitzer/IRS spectrum of HD 100453 showing a tentative detection of the 10 and 20 μm silicate features. |
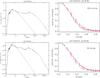 |
Fig. 3 Continuous disk (top) and transitional disk (bottom) models for HD 100453. Left: the solid brown lines show the stellar Kurucz models. The solid red lines show the Spitzer/IRS spectra. The blue dots represent the observed photometry. The solid green lines show the total fluxes. Right: azimuthally averaged radial brightness profiles of the Q band relative to the maximum flux. The central wavelengths of these images are 18.8 μm. The gray diamonds indicate the PSF of the calibration star. The red triangles show the observation of the science targets. The error bars indicate the one-sigma variations on the azimuthally averaged radial brightness profiles and are thus a reflection of the source asymmetry. The solid purple line shows our best-fit model. Top left: the model fit to the SED seems reasonable, although the detailed spectral shape at ~20 μm is not well fitted. Top right: the convolved model image does not fit the observed radial brightness profile. Bottom left: the assumption of a large gap in the disk gives a better fit to the SED at mid-IR wavelengths. Bottom right: the disk-gap model fits the extended emission as observed in the Q-band image. |
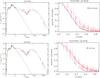 |
Fig. 4 Spectral energy distributions (right) and radial brightness profiles of the Q band (left) of the continuous disk (top) and transitional disk (bottom) models for HD 34282. Both the SED and the RBP are better fitted by the disk-gap model. See the caption of Fig. 3 for a description of the lines and symbols shown in this figure. |
HD 100453 is thought to be in transition between a gas-rich protoplanetary disk and a gas-poor debris disk (Collins et al. 2009). Observations of spatially resolved Q-band imaging (Mariñas et al. 2011), the SED, and the absence of the silicate feature are indications of a dust gap Maaskant et al. (2013). HD 100453 has a close M-type companion (projected distance of 120 AU), and the connection of the companion with the disk structure is not well understood (Collins et al. 2009). Collins et al. (2009) presented two non-detections. The first one is CO 4.97 μm ro-vibrational emission with Gemini/Pheonix (these transitions trace hot and warm gas), and the second one is CO 3-2 rotational emission with JCMT/HARP at 867 micron (this is a cold-gas tracer). In addition, Meeus et al. (2013) presented the non-detections of CO rotational emission in the spectral range of 50 to 210 micron (cold and warm gas). Following the discussion of the non-detection of gas tracers in HD 100453, Carmona et al. 2008 reported the non-detection of H2 S(1) and S(2) rotational lines at 17 and 12 micron (this traces warm gas at a few hundred Kelvin). However, some gas must be present in the disk because the [OI] 63 micron line is detected (Meeus et al. 2012; Fedele et al. 2013). The stellar properties are taken from Meeus et al. (2001), where the distance  pc is adopted based on Hipparcos measurements.
2.2. HD 34282
Acke et al. (2009) suggested that the disk around HD 34282 has a large opacity dust gap based on the near-IR excess and far-IR color. Rotational J = 3−2 CO emission (Greaves et al. 2000), but no rovibrational CO emission (Carmona et al. 2005) was detected in this source, which is consistent with an evacuated inner, but gas-rich outer disk. Dent et al. (2005) also reported the detection of 12CO 3−2 emission in HD 34282. They constrained the inclination of HD 34282 to 50 ± 5 degrees. We adopt the stellar properties derived by Merín et al. (2004), which place this source at a distance of  pc.
pc.
3. Observations
We collected data of HD 100453 and HD 34282 that we used for the analysis of this paper. The SEDs and Q-band radial brightness profiles (RBPs) are shown in Figs. 3 and 4. In addition, we compared these two objects to other similar transitional disks of the sample of Herbig stars presented in Maaskant et al. (2013, 2014).
3.1. Data
HD 100453 and HD 34282 were observed as part of a larger high-resolution imaging survey of protoplantary disks around Herbig Ae/Be stars (Mariñas et al. 2011). Q-band images (18.1 μm, Δλ = 1.1) were obtained using MICHELLE on the Gemini North telescope on February 2, 2006 for HD 100453 and December 4, 2003 for HD 34282. The pixel scale of the observations was 0.089′′. The standard chop-and-nod technique was used to remove thermal background from the sky and the telescope. A point-spread-function (PSF) star, selected from the Positions and Proper Motions (PPM) catalog, was observed before and after each science target observation to assess image quality. Mid-infrared standard stars Sirius and HD 133774 were used for image calibration and airmass correction. All data were reduced using IDL.
The observations of the disks around the Herbig stars HD 100453 and HD 34282 are resolved with respect to their point spread functions. For HD 100453 the FWHM of the science observation is 0.58 ± 0.01 and the FWHM of the PSF is 0.53 ± 0.02. For HD 34282 the FWHM of the science observation is 0.64 ± 0.03 and the FWHM of the PSF = 0.54 ± 0.01. The FWHM values were derived by fitting a Moffat function through the data, where the error is determined by the variability during the observation. For all observational details we refer to Mariñas et al. (2011).
Stellar parameters used in this study.
Photometric data HD 100453 (not corrected for extinction).
Photometric data HD 34282 (not corrected for extinction) used in this study.
The mid-IR spectra of the disks were obtained by the Spitzer/IRS telescope and were adopted from Juhász et al. (2010) and Acke et al. (2010). The photometric data were taken from the literature and are shown in Tables 2 and 3. The central star is described by a Kurucz model with the stellar parameters presented in Table 1. Figures 3 and 4 show the SEDs and RBPs.
3.2. SEDs of transitional disks
The mid-IR parts of the SEDs of group Ib Herbig Ae/Be stars show similar shapes (see Fig. 1). All objects show an emission bump at ~20 μm and PAH features. In HD 100453, a weak signature of the amorphous 10 and 20 μm silicate features can be seen (Fig. 2). All other sources show no sign of amorphous silicate features. In the next section we characterize the dust gaps in the disks of HD 100453 and HD 34282 and confirm that the shape of the silicate feature is connected to the presence of large dust gaps. The detailed shape of the SED is degenerate because it depends on parameters such as density structure, dust composition, and grain size distribution. The bump in the the SED at mid-IR wavelengths for these objects is an indicator of large dust gaps in the disks of group Ib Herbig Ae/Be stars, however. Radiative transfer modeling of the Q band is needed to constrain the radii of the inner edges of the outer disks of HD 100453 and HD 34282.
4. Modeling
In this section we introduce the radiative transfer code MCMax and the dust model. We discuss the modeling approach and outline the parameters that we study here.
4.1. Radiative transfer code MCMax
To model the disks, we used the MCMax dust modeling and radiative transfer tool (Min et al. 2009). MCMax performs radiative transfer using the Mont Carlo recipe outlined by Bjorkman & Wood (2001). It solves the temperature structure and density structure assuming a 2D geometry in radial and vertical directions. It is used to model circumstellar material including high optical depth regions, and axisymmetry is assumed for the dust disk model. Our aim is to fit models to the observed Q-band images and SEDs of our sample stars to derive the disk structure. Therefore, we azimuthally averaged the Q-band brightness profiles and evaluated the radial extent of the disk emission. Generally, the input parameters of the code can be divided into five categories: the stellar parameter, the surface density setup, the opacity parameters, and the parameters of the halo, inner disk, and the outer disk. The inner wall of the outer disk is puffed up since the high vertical surface brightness causes the temperature in the wall to be higher. This effect is taken into account in the radiative transfer code, which solves for the temperature and density in the disk and interpolates between the chosen grid points of the inner and outer disk. The most important disk parameters that we adjusted to fit the model to the observations are the inner and outer radius of the halo, the inner radius of the outer disk (wall radius), the outer radius of the disk, the mass of the dust in the disk and halo, the grain properties, and the power-law indices of the opacity profile. An extensive description of the modeling approach can be found in Maaskant et al. (2013).
4.2. Dust model
The composition of the grains in the disk are 20% carbon and 80% silicates. The standard dust composition with reference to the optical constants is 32% MgSiO3 (Dorschner et al. 1995), 34% Mg2SiO4 (Henning & Stognienko 1996), 12% MgFeSiO4 (Dorschner et al. 1995), 2% NaAlSi2O6 (Mutschke et al. 1998), and 20% C (Preibisch et al. 1993). The shape of our particles is irregular and was approximated using a distribution of hollow spheres (DHS, Min et al. 2005) using a vacuum fraction of 0.7. We performed some test modeling for which we changed the compositional (carbon and silicates) abundances. Although the SED may be sensitive to this parameter, the radial brightness profiles (i.e., images) of these models yield similar dust gap sizes. As a result, the dust composition fractions do not play a role in deriving the dust gap size (see Appendix B).
4.3. Model procedure
To fit the SED and the Q-band size, we followed the fitting procedure as outlined in Maaskant et al. (2013). We briefly summarize the procedure here. As a first step, we started with a disk that has a continuous density profile. We assumed that the disk is in hydrostatic equilibrium and that the radial dependence of the dust surface density drops off proportional to a power law of −1. We fit the far-infrared to mm photometry to a grain size power-law index of p between 3.0 and 4.0. If this did not fit the Q-band size, then we inserted a dust gap in the disk. We decreased the surface density in the dust gap by about 3 orders of magnitude. We recall that previous studies by Maaskant et al. (2013) showed that the observations require a contrast of 2 orders of magnitude. This results in a wall-like structure at the inner edge of the outer disk. Then we chose the radius of the inner edge of the outer disk, so that the convolved model image fits the observed Q-band image size. Then, we tried to fit the emission in the near-IR by including an optically thick inner disk. A hydrostatic inner disk does not give enough flux to fit the SED. We tried to fit the near-IR flux by parameterizing and enlarging the inner disk (i.e., increasing the vertical scale height and testing several density slopes). We modeled this scenario extensively and show the SEDs of these models in Fig. A.1. However, we consistently failed to obtain a good fit for the outer disk because a higher inner disk casts a shadow on the outer disk and therefore reduces the flux at mid-IR and far-IR wavelengths. A parameterized inner disk may fit the near-IR flux, but it is inconsistent with an outer disk that is in hydrostatic equilibrium because the vertical scale height of the outer disk is not high enough to receive enough radiation from the central star. To solve this problem, we replaced the inner disk with an optically thin inner spherical halo to fit the near-IR flux. We realize that this adopted geometry is a choice of convenience and many spatial distributions will produce similar fits as long as the structure is optical thin. Conversely, as the dust structure in the inner region has to be optically thin, this particular choice has no influence on our derived quantities such as the size of the dust gap. As a final step, we chose the minimum size (between 0.1 μm and 1 μm) of the grains in the disk to fit the flux in the mid-IR and far-IR to the SED.
5. Results
Our main focus is to demonstrate the existence of disk dust gaps. The second objective is to derive the location (i.e., the size) of the gap. In this section we constrain the disk gap and fit the size of the extended emission in the resolved Q-band images. We present the best-fitting radiative transfer models to the Q-band sizes and the SEDs of HD 100453 and HD 34282.
5.1. Constraining the dust gap size
Maaskant et al. (2013) have shown that the disk parameter that is constrained by fitting the Q-band size is the inner radius of the outer disk (i.e., the location of the wall). In Appendix B, we explore the parameters around the best-fit solution to study the effect on the SED of the inner and outer radii of the outer disk, the mass of the outer disk, and the grain properties. We confirm that only the inner radius of the outer disk substantially affects the Q-band size. In the remainder of this section we fit the Q-band and SED of HD 100453 and HD 34282. We note that the one-sigma error bars on the RBPs in Figs. 3 and 4 are a representation of the asymmetry of the image. The actual fitting of the image was made by a least-squares calculation to all the pixels, where the photometric error on each pixel is 10%. We fit a Moffat function through the Q-band image of our model and ensured that the model FWHMs are consistent with the FWHMs of the observations. The typical errors of these fits are of about a few percent.
Best-fit model parameters and comparison to the previous values by Maaskant et al. (2013).
5.2. Best-fit model HD 100453
We first explored a continuous disk model (i.e., without a gap in the disk). This seemed to fit the SED reasonably well, although it always failed to fit the size of the Q-band image (see Fig. 3, top panels). This is because for a continuous disk, the disk surface that emits in the Q band is much closer to the star (i.e., ≲10 AU). Therefore, the model Q-band image is barely resolved with respect to the PSF.
We were only able to fit the size of the Q band when we included a dust gap in the disk. The model that gives us the best-fitted SED and radial brightness profile (Fig. 3, bottom) has a large dust gap in the disk. The inner edge of the outer disk has a very high surface brightness and dominates the emission in the Q band. For this reason, the Q-band size is very sensitive to the location of the inner edge of the outer disk. We constrained its location at  AU. The surface density of our the best-fitting model is shown in Fig. 6. The inclination of HD 100453 is not known in the literature. This introduces the dominant uncertainty in the location of the inner edge of the outer disk. In our simulation we assumed an inclination of 45 degrees. For a pole-on or (nearly) edge-on geometry, the location of the wall must be decreased or increased by 3 AU, respectively, to fit the size of the Q band again. The bottom panel of Fig. 3 shows that the convolved image that was modeled using these input parameters fits this observation well. The average temperature of the inner edge (20−23 AU) of the outer disk is ~160 ± 10 K.
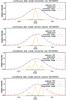 |
Fig. 5 HD 100453: horizontal and vertical radial brightness profiles of the continuous (top) and transitional disk models (bottom). |
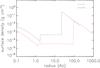 |
Fig. 6 Surface density as a function of radius for our best-fitting model including an inner halo, a gap, and a hydrostatic outer disk. |
In Fig. 5, horizontal and vertical radial brightness profiles of the continuous disk (top) and transitional disk (bottom) models are compared to the observation. In the horizontal direction both convolved models, with and without a gap, agree equally well with the observation. However, in the vertical direction, the convolved image of the transitional disk model provides a significantly better fit. For inclined transitional disks it might be expected that the farther side is brighter as observed from Earth. The asymmetry is evidence that the disks are inclined, where we realize that deriving an inclination angle will be hampered by the uncertainty in the vertical height of the disk; this is beyond the scope of this paper. The transitional disk model slightly underestimates the left side of the RBP in the vertical direction. This asymmetry could be indicative of extra emission associated with additional structure in the disk that is not considered in the model. Further observations are required to clarify this question.
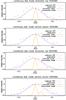 |
Fig. 7 HD 34282: horizontal and vertical radial brightness profiles of the continuous (top) and transitional disk models (bottom). |
The structure of the inner disk is poorly constrained by our data. Therefore we modeled the inner circumstellar region by spherical halos that are optically thin, but geometrically high. To fit the near-infrared (NIR) emission we adopted a halo from 0.1 to 1.7 AU with a mass of 0.15 × 10⁻⁹ M⊙. As there are many uncertainties in the structure of the inner disk (e.g., Dullemond & Monnier 2010), we only used the halo in our model to reproduce the amount of produced near-IR emission from the disk. To account for the absence of silicate features at 10 and 20 μm, we assumed a dust species in the halo that does not show any features. We adopted 100% amorphous carbon, but alternatively, larger silicate grains or metallic iron may yield similar results. Unfortunately, no interferometric dataset exists as yet for HD 34282 and HD 100453. In our modeling process we tested the possibility of 100% carbon disks closer to the star. However, hydrostatic inner disk models (or even disks vertically puffed up by a factor of 2−3) do not fit the near-infrared SED. Our halo solution drops the assumption of hydrostatics and is therefore similar to previous studies, which have shown to fit the near-IR part of the SED by including an optically thin inner disk (Verhoeff et al. 2011; Mulders et al. 2011; Maaskant et al. 2013).
Clearly, the absence of small silicate grains in the inner region of protoplanetary disks is remarkable. Similar dust compositional solutions have been inferred for a number of other transitional disks (e.g., T Cha: Olofsson et al. 2013, HD 135344 B: Carmona et al. 2014). This might be because only refractory grains are present close to the star because small silicate grains have been sublimated. This means that not only the correlation with the presence of dust gaps, but also the assumption that there are no small silicate grains in the optically thin halo causes the absence of silicate features in the SED.
The values of the best-fit parameters are listed in Table 4 and are also compared with the values obtained for four other Herbig star by Maaskant et al. (2013).
5.3. Best-fit model HD 34282
For the the Herbig star HD 34282, we followed the same procedure as HD 100453. We were unable to fit the SED and Q-band size by using a disk with a continuous density structure (Fig. 4, top panels).
To fit the SED and RBP, we adopted a dust gap in the disk. The best fit to the SED and RBP is shown in the bottom panel of Fig. 4. The location of the inner radius of the outer disk is constrained to  AU. Although the S/N of the Q-band observation is lower than that of HD 100453, the error is still dominated by the relatively large error in the uncertainty of the distance.
The RBPs in the horizontal and vertical directions of the continuous (top) and transitional (bottom) disk models are compared in Fig. 7. The scatter in the image for this target is high, and therefore we azimuthally averaged the RBPs in all directions to fit the best model (shown in Fig. 4). It is still evident, however, that the observation is resolved in the horizontal and vertical directions. Therefore, the model with a gap agrees better with the observation than the model without a gap.
The model of the disk includes a halo that is extended from 0.02 to 1.3 AU and has a mass of 2.4 × 10⁻¹¹ M⊙. The dust grains in the halo are made of carbon, and they have sizes of 0.5 μm to 1 mm with a size distribution power-law of −3.5. The mass of the outer disk is considered to be 0.83 × 10⁻⁴ M⊙. A model with an inner disk instead of a halo does not fit well because this solution does not provide enough flux to fit the near-IR SED. However, with the halo model the flux level can be increased sufficiently. The surface density of the best-fitting model is shown in Fig. 6.
Alternatively, we could also model a hydrostatic inner disk, although this model would require the outer disk to be puffed up out of hydrostatic equilibrium. We chose an optically thin, but geometrically high solution for the inner region (Honda 2012). However, if we drop the assumption of hydrostatic equilibrium and simply parameterize the entire disk, we can model an inner disk as well. A parameterized inner disk requires that the outer disk is also parameterized because the vertical scale height of the inner and outer disk needs to be several times higher than prescribed by hydrostatic equilibrium to fit the SED. But we discarded this model because we did not wish to loose the assumption of hydrostatic equilibrium. A parameterized model would require a puffed up inner disk and wall. This discussion applies to both objects.
5.4. Upper limit on the dust mass in the gap
In agreement with previous studies (Maaskant et al. 2013), for our best fit to the SED and Q-band image we derived that the minimum difference in surface density between the dust gap and the outer disk is roughly three orders of magnitude. We examined the maximum dust mass distribution that can be hidden in the gap without influencing our results. If we increased the dust mass in the gap above ~10-7 M⊙ for both sources, the observed size of the image in the Q-band was not reproduced anymore. We chose a constant density distribution as a function of radius for the dust in the gap to prevent the dust from becoming optically thick. This reflects the increased emission from the inner region. The surface density distribution is shown in Fig. 6. In addition − and this is the dominant effect − since the inner region becomes optically thick, the stellar photons do not reach the wall anymore and the height of the wall decreases. This also results in a decreased Q-band size. This effect is also quite obvious in the SED, and for these gap masses the SED fits also deviate strongly from the observations in the Q-band region (see Figs. C.1 and C.2 and Appendix C). Future observations with ALMA should be able to observe the contrast between the dust gap surface density and the outer disk.
5.5. Source asymmetry
It is not our aim to fit the source asymmetry or the influence of the structure of the wall on the observation because the mid-IR observations do not have sufficient resolution to fit such substructures. In our model, a sharp vertical inner radius of the outer disk is assumed. This vertical assumption may not be completely realistic. We tested this by varying the wall shape in MCMax, and at the resolution of our data, there is little variation in the Q-band images. We suggest that interferometric observations may be able to track the structure of the inner wall of the outer disk.
5.6. Summary
By using radiative transfer models, we have studied the Q-band sizes and SEDs of HD 100453 and HD 34282. We failed to find solutions with a continuous density structure. This means that large dust gaps in the disk are required to simultaneously fit the Q-band size and SED. The inner edge of the outer disks of HD 100453 and HD 34282 are AU and AU, respectively.
6. Discussion
For HD 100453 and HD 34282, radii of the inner edges of the outer disks were derived from the best-fit models. These values are in the same range as the wall radii of disks around other group Ib Herbig stars. We now discuss the implications of these results.
6.1. New Meeus group classification based on the F30/F13.5 continuum flux ratio
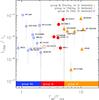 |
Fig. 8 Luminosities at 1.3 mm compared to the flux ratio at 30.0 and 13.5 μm. The filled symbols indicate whether large dust gaps have been detected in the literature. The large dust gaps are deduced from both direct submillimeter imaging and an indirect method of SED and mid-IR image fitting suggested in this paper. The L1300/L∗ can be used as a proxy of the disk mass. We confirm the connection between the dust gap size and its location, with the F30/F13.5 ratio. The groups are divided by 2.1 <F30/F13.5< 5.1. All the objects in this diagram are taken from the sample of Maaskant et al. (2014). |
We compared the photometric properties of HD 100453 and HD 34282 to other Herbig stars. Figure 8 shows the color-magnitude diagram and classification of a sample of Herbig stars. It shows luminosities at 1.3 mm compared to flux ratios at 30.0 and 13.5 μm for Herbig stars from the sample of Maaskant et al. (2014). As disks lose their mass during their evolution, they move down in this diagram. This diagram seems to indicate that there is no trend between group I and group II disks with regard to the disk mass. Previous studies (Acke et al. 2009; Maaskant et al. 2013, 2014) have indicated a strong correlation between the F30/F13.5 continuum flux ratio and the group classification based on (Meeus et al. 2001). The transitions between groups Ia, Ib, and group IIa may be more easily expressed by the the F30/F13.5 ratios. For flat sources with amorphous silicate features (group IIa), this implies  . For transitional and flaring objects with amorphous silicate features (group Ia) we find 2.1 <F30/F13.5< 5.1. The transitional and flaring objects that do not have silicate feature (group Ib) have
  . The Meeus groups are well separated by the new criteria based on the mid-infrared flux ratio 8.
6.2. Correlation between amorphous silicate emission, size of the dust gap, and the F30/F13.5 ratio
Transitional flaring disks that do show silicate emission are group Ia Herbig Ae/Be stars. The amorphous silicate features in these objects may originate in the inner edge of the outer disk. This may be the case for HD 100456 (e.g. Mulders et al. 2011) and HD 139614 (Matter et al. 2014), two transitional objects with the inner edge of the outer disk at 13 and 5.6 AU, respectively. Alternatively, the amorphous silicate feature may originate in the inner disk. Examples are HD 142527 (Verhoeff et al. 2011), AB AUr (Honda et al. 2010), and HD 36112 (Isella et al. 2010). In these objects large dust gaps of several tens of AUs have also been found. The large dust gaps are deduced from both direct submillimeter imaging and the indirect method of SED and mid-IR image fitting suggested in this paper. However, the inner disk may still contain substantial amounts of small silicate grains producing the silicate features. The following objects have previously been resolved using submm imaging: HD 135344 B (Brown et al. 2009), HD 142527 (Fukagawa et al. 2006), and IRS 48 (van der Marel et al. 2013).
Group Ib Herbig Ae/Be stars do not show silicate emission features. Figure 8 shows that the weakness of silicate emission features is connected to the presence of large disk dust gaps in the critical temperature regime (≳160 K) that is responsible for emission of silicate features. HD 100453 has the smallest dust gap size in the sample of group Ib objects. Peculiarly, a closer look at the Spitzer/IRS spectrum of HD 100453 shows a tentative detection of very weak amorphous silicate features (Fig. 2). Figure 8 shows that the F30/F13.5 ratio of HD 100453 is on the border of a group Ia identification. We suggest that this is connected to the smaller dust gap compared to the other disks, which causes a higher temperature in the inner region of the outer disk. Our radiative transfer model of HD 100453 shows that the average temperature of the inner region of the outer disk (between 20−23 AU) is ~160 K. Because the inner edge of the outer disk is closer to the star, the temperature of the dust in the wall is higher than for HD 34282 and the other group Ib transitional disks studied in Maaskant et al. (2013). We can compare the temperature in the wall of HD 100453 to that of HD 100546 and HD 97048. HD 100546 is one of the best-studied transitional disks with strong amorphous silicate features. Radiative transfer models presented in Mulders et al. (2011) showed that the inner edge of the outer disk of HD 100546 is located at ~13 AU and has a temperature of ~200 K. For HD 97048, the typical temperature in the inner region of the outer disk (34−37 AU) is ~110 K (Maaskant et al. 2013). HD 97048 does not show any sign of amorphous silicate emission. From this comparison, we infer that the temperature transition from ~160 K to ~200 K in the inner edge of the outer disk is critical for the strong enhancement of the amorphous silicate features originating in the wall. This might be connected to the fact that grains of ≲160 K are icy and therefore grow to larger typical sizes (e.g., Sirono 2011; Okuzumi et al. 2012). Models predict that the cycle of sublimation and condensation will allow efficient growth and trapping across the snow line (e.g. Ros & Johansen 2013). The slow sublimation of ice in icy aggregates at ~160 K, which are radially drifting inward in the disk, will lead to the formation of “pure” silicate aggregates, which are thus more fragile and can readily fragment upon collision. In this scenario, an enhanced abundance of small fragmented silicate grains at temperatures of ≳ 160 K may contribute significantly to the amorphous silicate features. The role of this particular snow line in the evolution of solids may be further investigated by direct observations of the snow line such as for HD 16296 (Mathews et al. 2013) and TW Hya (Qi et al. 2013).
6.3. Evolutionary link between transitional (flaring) and self-shadowed (flat) disks
A key question in the study of protoplanetary disks is to determine the evolutionary link between dust gaps formation (group I) and grain growth and settling (group II). Disk dust gaps are found in an increasing number of group I Herbig stars, and there is no evidence as yet of large dust gaps in group II Herbig stars (Maaskant et al. 2013). Therefore, we speculate that it is very unlikely that group I evolves to group II. There are now two possible evolutionary scenarios to understand the link between groups I and II. First, as proposed by Maaskant et al. (2013), both groups may have evolved from a common ancestor (i.e., gapless flaring-disk structure). In transitional group I objects, dust gap formation has preceded the collapse of the outer disk, while grain growth and dust settling have flattened the outer disk in flat group II objects. Second, group II objects may be the precursors of group I objects. In this case, planet formation might be followed by the formation of a large dust gap that may produce a high vertical wall and stir up the dust in the outer disk. To distinguish the proposed observational scenarios, future observational at scattered light wavelengths up to the (sub-)mm are required to search for dust depletion and the interaction with gas flows through the gap. If, for example, circumplanetary-disks around newly forming planets are found, then this will enable us to understand the link between planet formation and protoplanetary disk evolution. Another step forward in distinguishing between these evolutionary scenarios may be expected from observations of the outer disks of group II objects. So far, their structure is completely unknown, however, because no observation has been sensitive enough to detect the outer disks and characterize their typical radial size. If these disks are radially small (10 AU) but very dense and optically thick, then these objects must have had a different evolution than the radially large group I objects. However, if these objects are also radially large, then they may still be precursors to group I objects. ALMA is needed to understand whether these objects are “small and flat” or “large and flat”.
7. Conclusions
We have used spatially resolved mid-IR observations and radiative transfer models. We fit the spectral energy distribution and the radial brightness profile of the Q-band images of the disks around two Herbig Ae/Be type Ib stars, HD 100453 and HD 34282. We compared our results with those of Maaskant et al. (2013), who presented a similar analysis of four other Herbig stars, HD 97047, HD 169142, HD 135344 B and Oph IRS 48.
-
We were unable to fit the spatially resolved Q-band imaging and SEDs considering a continuous disk (i.e., no gap). In contrast with a transitional disk that consists of a halo around the star, a dust gap, and an hydrostatic outer disk, we successfully fit all the observations.
-
Radiative transfer modeling constrains the inner radius of the outer disk at
AU for HD 100453 and AU for HD 34282. This result provides further evidence that group Ib Herbig Ae/Be might have a dust gap. Therefore, it supports the conclusion by Maaskant et al. (2013) that group Ib Herbig Ae/Be stars are transitional disks with large dust gaps. -
The upper limit for the mass of the dust in the gap is roughly estimated to be 10-7 M⊙ for both HD 34282 and HD 100453.
-
Neither the outer disk mass, nor the surface density power-law or the opacity profile affect the Q-band size.
-
We find no correlation between the halo masses, the disk masses, and the sizes of the dust gaps in the Herbig Ae/Be stars we studied.
-
The absence of the amorphous silicate emission in the spectra of these disks is consistent with the conclusions of Maaskant et al. (2013) that dust gaps in a critical temperature regime between ~200–500 K cause the silicate feature to disappear. In addition, grains are typically large in the outer disk.
-
The temperature transition from ~160 K to ~200 K in the inner edge of the outer disk is critical for the strong enhancement of the amorphous silicate features originating in the wall.
Appendix A: Inner disk parametrization
For the variations around the vertical scale-height, the relation sh ∝ rshpow is used, where sh is the scale height at 0.1 AU and shpow is the power-law index. Models were performed on HD 100453. Our best efforts to fit the inner disk results in a poor fit to the outer disk. Thus, in our final model, we included an optically thin halo to solve this problem. Compared to the previous values shown in Table 4, the halo mass is changed to 0.7 × 10⁻¹ M⊙ and the extension of the inner disk to 0.25−1.7 AU.
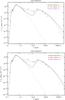 |
Fig. A.1 Variations in the inner disk scale-height properties. Left: different scale heights. Right: different power-law indices. We found no satisfactory solution using an optically thick inner disk. |
Appendix B: Parameter study
Figure B.1 shows the results of a small parameter study to illustrate the degeneracy of SED modeling. HD 100453 is shown on the left and HD 34282 is shown on the right.
The top left plot in Fig. B.1 shows the result of modeling different values for the inner radius of the outer disk (the wall radius). This value affects the mid-IR of the SED where the emission comes from the wall and the temperature is about ~100−160 K. The dust gap size with a value of 20 AU fits the observed SEDs very well. This indicates that there is a dust gap in between the halo and the outer disk. The exact size of this dust gap cannot be understood from modeling the SED alone, but the modeling must include fitting the size of the Q-band image. The SED is degenerate because the structure of the inner halo (i.e., the optical depth and scale heigth) as well as the grain composition in the outer disk are not well known. We show below that these parameters have a great influence on the SED as well.
The top right plot in Fig. B.1 shows a comparison of different disk radii. The outer radius is unknown. We fit various values in the range of typical disk sizes and found that a disk size with a radius of 200 AU fits the SED better. However, the changes of this value do not have a significant effect on the outcome of the modeling, and therefore it is difficult to estimate the size of the outer radius of the disk.
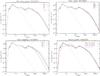 |
Fig. B.1 Variations around the best-fit values for HD 100453. Top left: different dust gap sizes. Top right: different radii of the outer disk. Bottom left: different total disk masses. Bottom right: different minimum and maximum grain sizes and power laws of the grain size distribution. |
The bottom left plot in Fig. B.1 show variations in the dust mass. A higher mass means more material in the disk, which would increase the thermal emission from the disk in the far-IR regions. Dust mass mainly affects the mm part of the SED. When the dust mass is taken to be lower than the best-fit value, the mm flux tends to shifts below the observation, and when the mass is higher than the best fit, the mm flux shifts above the observation.
The bottom right plot in Fig. B.1 shows the result for different opacity profiles (i.e., different grain sizes and power-law indices). The best fit consists of grain size distribution of 0.5 μm to 1 mm with a power-law index of −3.5. The change in this parameter affects the temperature and luminosity of the halo and the location of the wall of the outer disk. This is especially noticeable in the near-IR part of the SEDs. The red lines show the models with the highest abundance of small grains. Smaller grains have higher opacities, which means that more stellar radiation is absorbed closer to the star. Therefore the emission from the halo increases, but the stellar radiation decreases as a result of the higher optical depth. The other grain size populations show a similar behavior.
The plots in Fig. B.2 show the SED and radial brightness profiles for several compositional ratios of carbons to silicates. While there is some change in the shape of the SED, little difference can be observed in the size of the Q-band image.
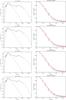 |
Fig. B.2 SED and RBP for different compositions. The first row shows the SED and RBP for a model with 80% carbon and 20% silicates. The second row shows a model with 50% carbon and 50% silicates, the third row a model with 20% carbon and 80% silicates, and the fourth row a model with 100% carbon and no silicates. |
Appendix C: Supplementary to the upper limit on the dust mass in the gap
As mentioned in Sect. 5.4, we can estimate the upper limit on the dust mass inside the gap by increasing the dust mass in the gap. In this region for masses above ~10-7 M⊙ for both sources, the observed size of the image in the Q band cannot be reproduced anymore (shown in the top left panels in Figs. C.1 and C.2). In
addition, we show the SED and RBP of both sources for evenhigher masses in the right panels of Figs. C.1 and C.2 for comparison. The main effect of an increased dust mass in the gap is that the inner region becomes optically thick. As a result, the wall (the inner radius of the outer disk) becomes less pronounced and therefore less important for the SED and for the Q-band brightness distribution. This effect is readily apparent in the models shown in Figs. C.1 and C.2.
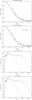 |
Fig. C.1 Top panels: radial brightness profiles of HD 100453 for when the mass of the dust in the gap is 10-7 M⊙ and 10-5 M⊙from left to right. Bottom panels: corresponding SEDs. |
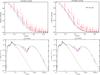 |
Fig. C.2 Top panels: radial brightness profiles of HD 34282 for when the mass of the dust in the gap is 10-7 M⊙ and 10-6 M⊙from left to right. Bottom panels: corresponding SEDs. |
Acknowledgments
The authors thank Rens Waters for inspiring discussions that helped to improve the analysis in this paper. The authors thank Michiel Min for providing his radiative transfer code MCMax. K.M. is supported by a grant from the Netherlands Research School for Astronomy (NOVA). Studies of interstellar chemistry at Leiden Observatory are supported through advanced-ERC grant 246976 from the European Research Council, through a grant by the Dutch Science Agency, NWO, as part of the Dutch Astrochemistry Network, and through the Spinoza premie from the Dutch Science Agency, NWO.
References
- Acke, B., Bouwman, J., Juhász, A., et al. 2010, ApJ, 718, 558 [NASA ADS] [CrossRef] [Google Scholar]
- Acke, B., Min, M., van den Ancker, M. E., et al. 2009, A&A, 502, L17 [NASA ADS] [CrossRef] [EDP Sciences] [Google Scholar]
- Bjorkman, J. E., & Wood, K. 2001, ApJ, 554, 615 [NASA ADS] [CrossRef] [Google Scholar]
- Brown, J. M., Blake, G. A., Qi, C., et al. 2009, ApJ, 704, 496 [NASA ADS] [CrossRef] [Google Scholar]
- Calvet, N., D’Alessio, P., Watson, D. M., et al. 2005, ApJ, 630, L185 [NASA ADS] [CrossRef] [Google Scholar]
- Carmona, A., van den Ancker, M. E., Thi, W.-F., Goto, M., & Henning, T. 2005, A&A, 436, 977 [NASA ADS] [CrossRef] [EDP Sciences] [Google Scholar]
- Carmona, A., van den Ancker, M. E., Henning, T., et al. 2008, A&A, 477, 839 [NASA ADS] [CrossRef] [EDP Sciences] [Google Scholar]
- Carmona, A., Pinte, C., Thi, W. F., et al. 2014, A&A, 567, A51 [NASA ADS] [CrossRef] [EDP Sciences] [Google Scholar]
- Casassus, S., van der Plas, G., M, S. P., et al. 2013, Nature, 493, 191 [NASA ADS] [CrossRef] [Google Scholar]
- Collins, K. A., Grady, C. A., Hamaguchi, K., et al. 2009, ApJ, 697, 557 [NASA ADS] [CrossRef] [Google Scholar]
- Dent, W. R. F., Greaves, J. S., & Coulson, I. M. 2005, MNRAS, 359, 663 [NASA ADS] [CrossRef] [Google Scholar]
- de Winter, D., van den Ancker, M. E., Maira, A., et al. 2001, A&A, 380, 609 [NASA ADS] [CrossRef] [EDP Sciences] [Google Scholar]
- Dorschner, J., Begemann, B., Henning, T., Jaeger, C., & Mutschke, H. 1995, A&A, 300, 503 [NASA ADS] [Google Scholar]
- Dullemond, C. P., & Dominik, C. 2004, A&A, 421, 1075 [NASA ADS] [CrossRef] [EDP Sciences] [Google Scholar]
- Dullemond, C. P., & Dominik, C. 2005, A&A, 434, 971 [NASA ADS] [CrossRef] [EDP Sciences] [Google Scholar]
- Dullemond, C. P., & Monnier, J. D. 2010, ARA&A, 48, 205 [NASA ADS] [CrossRef] [Google Scholar]
- Espaillat, C., Calvet, N., D’Alessio, P., et al. 2007, ApJ, 670, L135 [NASA ADS] [CrossRef] [Google Scholar]
- Fedele, D., Bruderer, S., van Dishoeck, E. F., et al. 2013, A&A, 559, A77 [NASA ADS] [CrossRef] [EDP Sciences] [Google Scholar]
- Fujiwara, H., Ishihara, D., Onaka, T., et al. 2013, A&A, 550, A45 [NASA ADS] [CrossRef] [EDP Sciences] [Google Scholar]
- Fukagawa, M., Tamura, M., Itoh, Y., et al. 2006, ApJ, 636, L153 [NASA ADS] [CrossRef] [Google Scholar]
- Grady, C. A., Woodgate, B. E., Bowers, C. W., et al. 2005, ApJ, 630, 958 [NASA ADS] [CrossRef] [Google Scholar]
- Greaves, J. S., Mannings, V., & Holland, W. S. 2000, Icarus, 143, 155 [NASA ADS] [CrossRef] [Google Scholar]
- Henning, T., & Stognienko, R. 1996, A&A, 311, 291 [NASA ADS] [Google Scholar]
- Honda, M., Inoue, A. K., Okamoto, Y. K., et al. 2010, ApJ, 718, L199 [NASA ADS] [CrossRef] [Google Scholar]
- Honda, M., Maaskant, K., Okamoto, Y. K., et al. 2012, ApJ, 752, 143 [NASA ADS] [CrossRef] [Google Scholar]
- Isella, A., Natta, A., Wilner, D., Carpenter, J. M., & Testi, L. 2010, ApJ, 725, 1735 [NASA ADS] [CrossRef] [Google Scholar]
- Juhász, A., Bouwman, J., Henning, T., et al. 2010, ApJ, 721, 431 [NASA ADS] [CrossRef] [Google Scholar]
- Maaskant, K. M., Honda, M., Waters, L. B. F. M., et al. 2013, A&A, 555, A64 [NASA ADS] [CrossRef] [EDP Sciences] [Google Scholar]
- Maaskant, K. M., Min, M., Waters, L. B. F. M., & Tielens, A. G. G. M. 2014, A&A, 563, A78 [NASA ADS] [CrossRef] [EDP Sciences] [Google Scholar]
- Malfait, K., Bogaert, E., & Waelkens, C. 1998, A&A, 331, 211 [NASA ADS] [Google Scholar]
- Mannings, V., & Sargent, A. I. 2000, ApJ, 529, 391 [NASA ADS] [CrossRef] [Google Scholar]
- Mariñas, N., Telesco, C. M., Fisher, R. S., & Packham, C. 2011, ApJ, 737, 57 [NASA ADS] [CrossRef] [Google Scholar]
- Mathews, G. S., Klaassen, P. D., Juhász, A., et al. 2013, A&A, 557, A132 [NASA ADS] [CrossRef] [EDP Sciences] [Google Scholar]
- Matter, A., Labadie, L., Kreplin, A., et al. 2014, A&A, 561, A26 [NASA ADS] [CrossRef] [EDP Sciences] [Google Scholar]
- Meeus, G., Waters, L. B. F. M., Bouwman, J., et al. 2001, A&A, 365, 476 [NASA ADS] [CrossRef] [EDP Sciences] [Google Scholar]
- Meeus, G., Bouwman, J., Dominik, C., Waters, L. B. F. M., & de Koter, A. 2003, A&A, 402, 767 [NASA ADS] [CrossRef] [EDP Sciences] [Google Scholar]
- Meeus, G., Montesinos, B., Mendigutía, I., et al. 2012, A&A, 544, A78 [NASA ADS] [CrossRef] [EDP Sciences] [Google Scholar]
- Meeus, G., Salyk, C., Bruderer, S., et al. 2013, A&A, 559, A84 [NASA ADS] [CrossRef] [EDP Sciences] [Google Scholar]
- Merín, B., Montesinos, B., Eiroa, C., et al. 2004, A&A, 419, 301 [NASA ADS] [CrossRef] [EDP Sciences] [Google Scholar]
- Min, M., Hovenier, J. W., & de Koter, A. 2005, A&A, 432, 909 [NASA ADS] [CrossRef] [EDP Sciences] [Google Scholar]
- Min, M., Dullemond, C. P., Dominik, C., de Koter, A., & Hovenier, J. W. 2009, A&A, 497, 155 [NASA ADS] [CrossRef] [EDP Sciences] [Google Scholar]
- Mulders, G. D., Waters, L. B. F. M., Dominik, C., et al. 2011, A&A, 531, A93 [NASA ADS] [CrossRef] [EDP Sciences] [Google Scholar]
- Mutschke, H., Begemann, B., Dorschner, J., et al. 1998, A&A, 333, 188 [NASA ADS] [Google Scholar]
- Najita, J. R., Strom, S. E., & Muzerolle, J. 2007, MNRAS, 378, 369 [NASA ADS] [CrossRef] [Google Scholar]
- Natta, A., Testi, L., Neri, R., Shepherd, D. S., & Wilner, D. J. 2004, A&A, 416, 179 [NASA ADS] [CrossRef] [EDP Sciences] [Google Scholar]
- Natta, A., Testi, L., Calvet, N., et al. 2007, Protostars and Planets V, 767 [Google Scholar]
- Okuzumi, S., Tanaka, H., Kobayashi, H., & Wada, K. 2012, ApJ, 752, 106 [NASA ADS] [CrossRef] [Google Scholar]
- Olofsson, J., Benisty, M., Le Bouquin, J.-B., et al. 2013, A&A, 552, A4 [NASA ADS] [CrossRef] [EDP Sciences] [Google Scholar]
- Preibisch, T., Ossenkopf, V., Yorke, H. W., & Henning, T. 1993, A&A, 279, 577 [NASA ADS] [Google Scholar]
- Qi, C., Öberg, K. I., Wilner, D. J., et al. 2013, Science, 341, 630 [NASA ADS] [CrossRef] [PubMed] [Google Scholar]
- Quanz, S. P., Avenhaus, H., Buenzli, E., et al. 2013, ApJ, 766, L2 [NASA ADS] [CrossRef] [Google Scholar]
- Ros, K., & Johansen, A. 2013, A&A, 552, A137 [NASA ADS] [CrossRef] [EDP Sciences] [Google Scholar]
- Sirono, S.-I. 2011, ApJ, 735, 131 [NASA ADS] [CrossRef] [Google Scholar]
- Sylvester, R. J., Skinner, C. J., Barlow, M. J., & Mannings, V. 1996, MNRAS, 279, 915 [NASA ADS] [CrossRef] [Google Scholar]
- van den Ancker, M. E., de Winter, D., & Tjin A Djie, H. R. E. 1998, A&A, 330, 145 [NASA ADS] [Google Scholar]
- van der Marel, N., van Dishoeck, E. F., Bruderer, S., et al. 2013, Science, 340, 1199 [NASA ADS] [CrossRef] [PubMed] [Google Scholar]
- Verhoeff, A. P., Min, M., Pantin, E., et al. 2011, A&A, 528, A91 [NASA ADS] [CrossRef] [EDP Sciences] [Google Scholar]
- Williams, J. P., & Cieza, L. A. 2011, ARA&A, 49, 67 [NASA ADS] [CrossRef] [Google Scholar]
All Tables
Best-fit model parameters and comparison to the previous values by Maaskant et al. (2013).
All Figures
|
Fig. 1 SEDs of group Ib Herbig Ae/Be stars in the sample of Maaskant et al. (2014). There is a great similarity in the shape of the SEDs. The fluxes are scaled so that the objects are sorted by dust gap size, with the smallest dust gap radius at the top and the largest dust gap radius at the bottom. The flux scaling factors for the objects from top to bottom are 10, 5, 1, 0.03, 0.003, and 0.003. |
| In the text | |
|
Fig. 2 Close-up of the Spitzer/IRS spectrum of HD 100453 showing a tentative detection of the 10 and 20 μm silicate features. |
| In the text | |
|
Fig. 3 Continuous disk (top) and transitional disk (bottom) models for HD 100453. Left: the solid brown lines show the stellar Kurucz models. The solid red lines show the Spitzer/IRS spectra. The blue dots represent the observed photometry. The solid green lines show the total fluxes. Right: azimuthally averaged radial brightness profiles of the Q band relative to the maximum flux. The central wavelengths of these images are 18.8 μm. The gray diamonds indicate the PSF of the calibration star. The red triangles show the observation of the science targets. The error bars indicate the one-sigma variations on the azimuthally averaged radial brightness profiles and are thus a reflection of the source asymmetry. The solid purple line shows our best-fit model. Top left: the model fit to the SED seems reasonable, although the detailed spectral shape at ~20 μm is not well fitted. Top right: the convolved model image does not fit the observed radial brightness profile. Bottom left: the assumption of a large gap in the disk gives a better fit to the SED at mid-IR wavelengths. Bottom right: the disk-gap model fits the extended emission as observed in the Q-band image. |
| In the text | |
|
Fig. 4 Spectral energy distributions (right) and radial brightness profiles of the Q band (left) of the continuous disk (top) and transitional disk (bottom) models for HD 34282. Both the SED and the RBP are better fitted by the disk-gap model. See the caption of Fig. 3 for a description of the lines and symbols shown in this figure. |
| In the text | |
|
Fig. 5 HD 100453: horizontal and vertical radial brightness profiles of the continuous (top) and transitional disk models (bottom). |
| In the text | |
|
Fig. 6 Surface density as a function of radius for our best-fitting model including an inner halo, a gap, and a hydrostatic outer disk. |
| In the text | |
|
Fig. 7 HD 34282: horizontal and vertical radial brightness profiles of the continuous (top) and transitional disk models (bottom). |
| In the text | |
|
Fig. 8 Luminosities at 1.3 mm compared to the flux ratio at 30.0 and 13.5 μm. The filled symbols indicate whether large dust gaps have been detected in the literature. The large dust gaps are deduced from both direct submillimeter imaging and an indirect method of SED and mid-IR image fitting suggested in this paper. The L1300/L∗ can be used as a proxy of the disk mass. We confirm the connection between the dust gap size and its location, with the F30/F13.5 ratio. The groups are divided by 2.1 <F30/F13.5< 5.1. All the objects in this diagram are taken from the sample of Maaskant et al. (2014). |
| In the text | |
|
Fig. A.1 Variations in the inner disk scale-height properties. Left: different scale heights. Right: different power-law indices. We found no satisfactory solution using an optically thick inner disk. |
| In the text | |
|
Fig. B.1 Variations around the best-fit values for HD 100453. Top left: different dust gap sizes. Top right: different radii of the outer disk. Bottom left: different total disk masses. Bottom right: different minimum and maximum grain sizes and power laws of the grain size distribution. |
| In the text | |
|
Fig. B.2 SED and RBP for different compositions. The first row shows the SED and RBP for a model with 80% carbon and 20% silicates. The second row shows a model with 50% carbon and 50% silicates, the third row a model with 20% carbon and 80% silicates, and the fourth row a model with 100% carbon and no silicates. |
| In the text | |
|
Fig. C.1 Top panels: radial brightness profiles of HD 100453 for when the mass of the dust in the gap is 10-7 M⊙ and 10-5 M⊙from left to right. Bottom panels: corresponding SEDs. |
| In the text | |
|
Fig. C.2 Top panels: radial brightness profiles of HD 34282 for when the mass of the dust in the gap is 10-7 M⊙ and 10-6 M⊙from left to right. Bottom panels: corresponding SEDs. |
| In the text | |
Current usage metrics show cumulative count of Article Views (full-text article views including HTML views, PDF and ePub downloads, according to the available data) and Abstracts Views on Vision4Press platform.
Data correspond to usage on the plateform after 2015. The current usage metrics is available 48-96 hours after online publication and is updated daily on week days.
Initial download of the metrics may take a while.