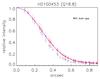
Fig. 3
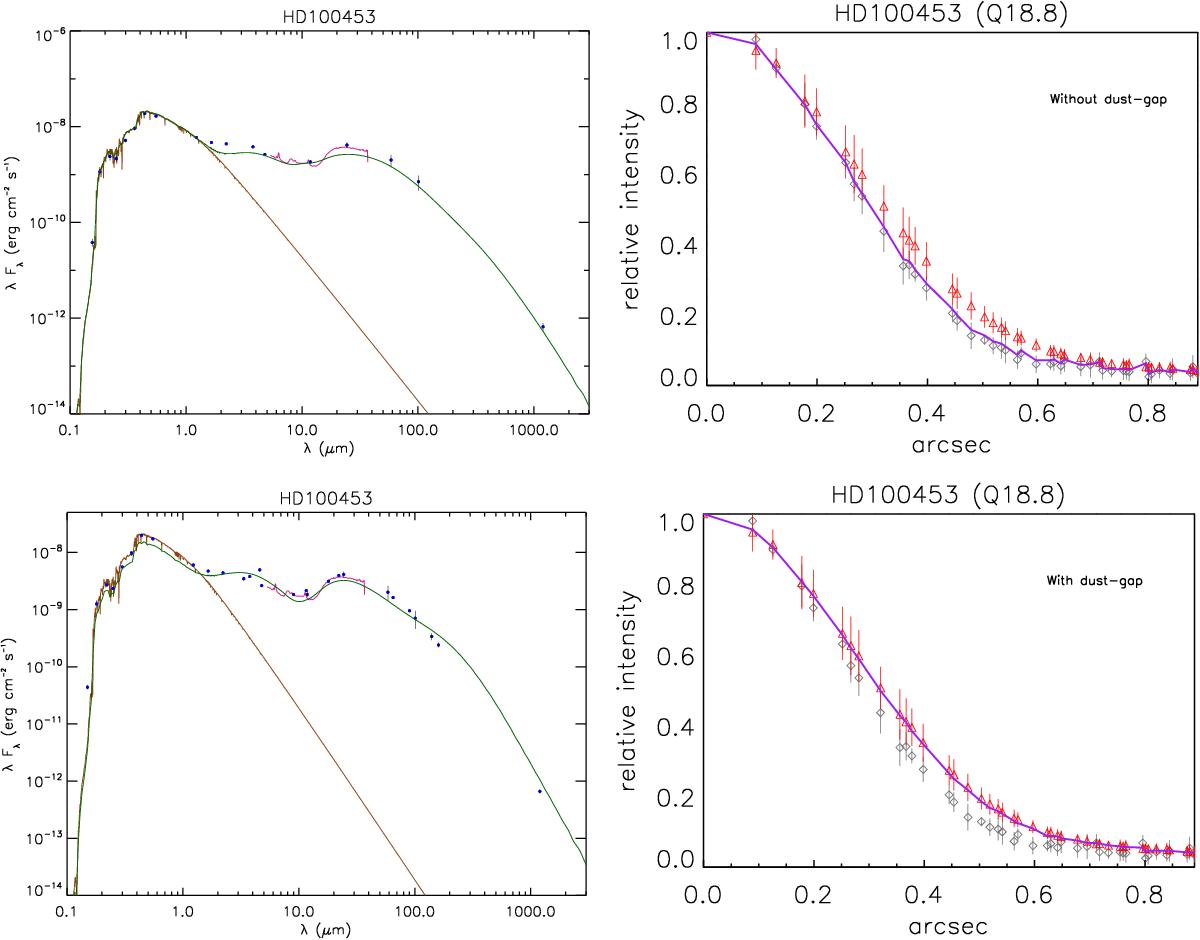
Continuous disk (top) and transitional disk (bottom) models for HD 100453. Left: the solid brown lines show the stellar Kurucz models. The solid red lines show the Spitzer/IRS spectra. The blue dots represent the observed photometry. The solid green lines show the total fluxes. Right: azimuthally averaged radial brightness profiles of the Q band relative to the maximum flux. The central wavelengths of these images are 18.8 μm. The gray diamonds indicate the PSF of the calibration star. The red triangles show the observation of the science targets. The error bars indicate the one-sigma variations on the azimuthally averaged radial brightness profiles and are thus a reflection of the source asymmetry. The solid purple line shows our best-fit model. Top left: the model fit to the SED seems reasonable, although the detailed spectral shape at ~20 μm is not well fitted. Top right: the convolved model image does not fit the observed radial brightness profile. Bottom left: the assumption of a large gap in the disk gives a better fit to the SED at mid-IR wavelengths. Bottom right: the disk-gap model fits the extended emission as observed in the Q-band image.
Current usage metrics show cumulative count of Article Views (full-text article views including HTML views, PDF and ePub downloads, according to the available data) and Abstracts Views on Vision4Press platform.
Data correspond to usage on the plateform after 2015. The current usage metrics is available 48-96 hours after online publication and is updated daily on week days.
Initial download of the metrics may take a while.