Fig. 8
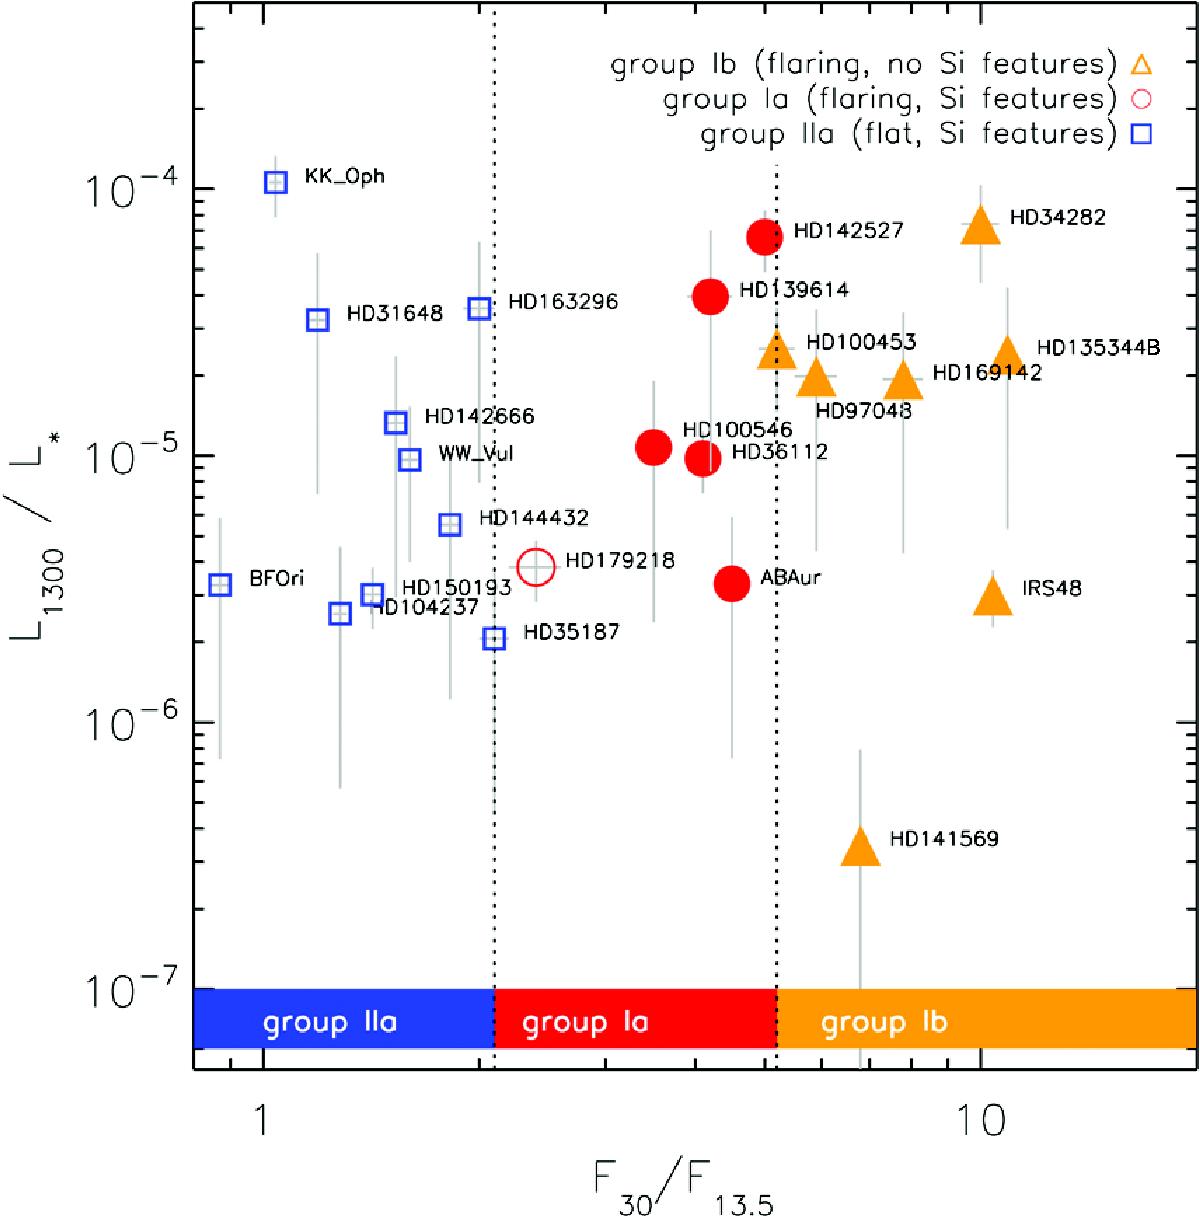
Luminosities at 1.3 mm compared to the flux ratio at 30.0 and 13.5 μm. The filled symbols indicate whether large dust gaps have been detected in the literature. The large dust gaps are deduced from both direct submillimeter imaging and an indirect method of SED and mid-IR image fitting suggested in this paper. The L1300/L∗ can be used as a proxy of the disk mass. We confirm the connection between the dust gap size and its location, with the F30/F13.5 ratio. The groups are divided by 2.1 <F30/F13.5< 5.1. All the objects in this diagram are taken from the sample of Maaskant et al. (2014).
Current usage metrics show cumulative count of Article Views (full-text article views including HTML views, PDF and ePub downloads, according to the available data) and Abstracts Views on Vision4Press platform.
Data correspond to usage on the plateform after 2015. The current usage metrics is available 48-96 hours after online publication and is updated daily on week days.
Initial download of the metrics may take a while.