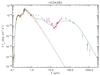
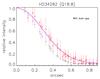
Fig. 4
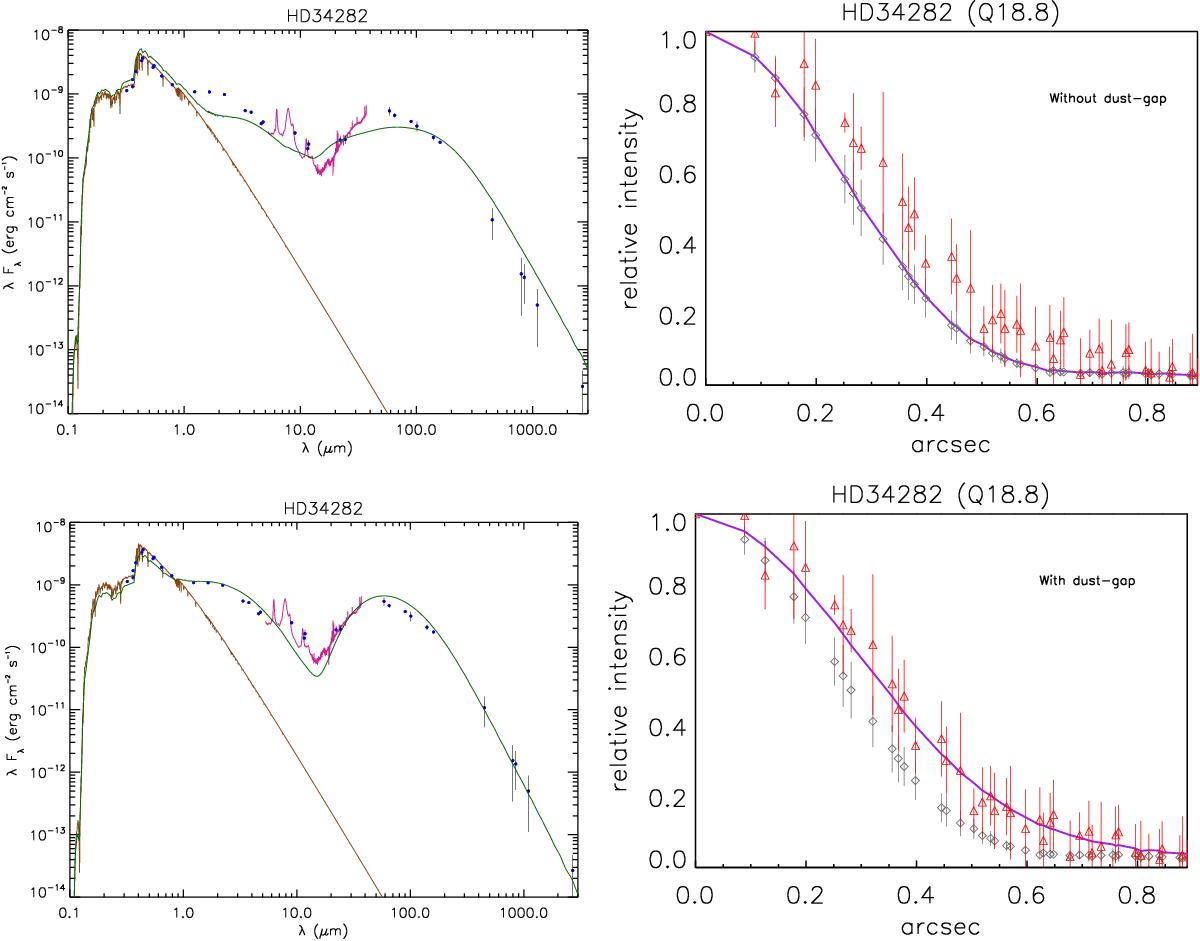
Spectral energy distributions (right) and radial brightness profiles of the Q band (left) of the continuous disk (top) and transitional disk (bottom) models for HD 34282. Both the SED and the RBP are better fitted by the disk-gap model. See the caption of Fig. 3 for a description of the lines and symbols shown in this figure.
Current usage metrics show cumulative count of Article Views (full-text article views including HTML views, PDF and ePub downloads, according to the available data) and Abstracts Views on Vision4Press platform.
Data correspond to usage on the plateform after 2015. The current usage metrics is available 48-96 hours after online publication and is updated daily on week days.
Initial download of the metrics may take a while.