| Issue |
A&A
Volume 585, January 2016
|
|
|---|---|---|
| Article Number | A157 | |
| Number of page(s) | 14 | |
| Section | Extragalactic astronomy | |
| DOI | https://doi.org/10.1051/0004-6361/201527189 | |
| Published online | 14 January 2016 | |
Hard X-ray emission of the luminous infrared galaxy NGC 6240 as observed by NuSTAR
1 ASDC−ASI, via del Politecnico, 00133 Roma, Italy
e-mail: This email address is being protected from spambots. You need JavaScript enabled to view it.
2 INAF−Osservatorio Astronomico di Roma, via Frascati 33, 00078 Monte Porzio Catone (RM), Italy
3 INAF−Osservatorio Astronomico di Bologna, via Ranzani 1, 40127 Bologna, Italy
4 EMBIGGEN Anillo, Concepción, Chile
5 Instituto de Astrofísica, Facultad de Física, Pontificia Universidad Católica de Chile, 306, Santiago 22, Chile
6 Millenium Institute of Astrophysics, Casilla 360 Santiago, Chile
7 Space Science Institute, 4750 Walnut Street, Suite 205, Boulder, Colorado 80301, USA
8 Department of Astronomy & Astrophysics, 525 Davey Laboratory, Pennsylvania State University, University Park, PA 16802, USA
9 Institute for Gravitation and the Cosmos, Pennsylvania State University, University Park, PA 16802, USA
10 Department of Physics, 104 Davey Laboratory, Pennsylvania State University, University Park, PA 16802, USA
11 Cahill Center for Astrophysics, California Institute of Technology, 1216 East California Boulevard, Pasadena, CA 91125, USA
12 Jet Propulsion Laboratory, California Institute of Technology, 4800 Oak Grove Drive, Mail Stop 169-221, Pasadena, CA 91109, USA
13 Yale Center for Astronomy and Astrophysics, Physics Department, Yale University, PO Box 208120, New Haven, CT 06520-8120, USA
14 Department of Physics, Durham University, Durham DH1 3LE, UK
15 Instituto de Física y Astronomía, Facultad de Ciencias, Universidad de Valparaíso, Gran Bretana N 1111, Playa Ancha, Valparaíso, Chile
16 Space Sciences Laboratory, University of California, Berkeley, CA 94720, USA
17 DTU Space, National Space Institute, Technical University of Denmark, Elektrovej 327, 2800 Lyngby, Denmark
18 Lawrence Livermore National Laboratory, Livermore, CA 94550, USA
19 School of Physics & Astronomy, University of Southampton, Highfield, Southampton SO17 1BJ, UK
20 Columbia Astrophysics Laboratory, Columbia University, New York, NY 10027, USA
21 Institute for Astronomy, Department of Physics, ETH Zurich, Wolfgang-Pauli-Strasse 27, 8093 Zurich, Switzerland
22 Dipartimento di Matematica e Fisica, Universitá degli Studi Roma Tre, via della Vasca Navale 84, 00146 Roma, Italy
23 NASA Goddard Space Flight Center, Greenbelt, MD 20771, USA
Received: 14 August 2015
Accepted: 14 October 2015
Abstract
We present a broadband (~0.3−70 keV) spectral and temporal analysis of NuSTAR observations of the luminous infrared galaxy NGC 6240 combined with archival Chandra, XMM-Newton, and BeppoSAX data. NGC 6240 is a galaxy in a relatively early merger state with two distinct nuclei separated by ~1.̋5. Previous Chandra observations resolved the two nuclei and showed that they are both active and obscured by Compton-thick material. Although they cannot be resolved by NuSTAR, we were able to clearly detect, for the first time, both the primary and the reflection continuum components thanks to the unprecedented quality of the NuSTAR data at energies >10 keV. The NuSTAR hard X-ray spectrum is dominated by the primary continuum piercing through an absorbing column density which is mildly optically thick to Compton scattering (τ ≃ 1.2, NH ~ 1.5 × 1024 cm-2). We detect moderately hard X-ray (>10 keV) flux variability up to 20% on short (15−20 ks) timescales. The amplitude of the variability is largest at ~30 keV and is likely to originate from the primary continuum of the southern nucleus. Nevertheless, the mean hard X-ray flux on longer timescales (years) is relatively constant. Moreover, the two nuclei remain Compton-thick, although we find evidence of variability in the material along the line of sight with column densities NH ≤ 2 × 1023 cm-2 over long (~3−15 yr) timescales. The observed X-ray emission in the NuSTAR energy range is fully consistent with the sum of the best-fit models of the spatially resolved Chandra spectra of the two nuclei.
Key words: galaxies: active / galaxies: individual: NGC 6240 / X-rays: galaxies
© ESO, 2016
1. Introduction
Galaxy mergers represent a crucial phase in most scenarios of galaxy formation. According to models and simulations (e.g., Springel et al. 2005; Di Matteo et al. 2005; Hopkins & Elvis 2010), during the mergers of massive gas-rich galaxies, cold gas is destabilized and can rapidly form stars and will ultimately feed the active galactic nucleus (AGN). The relative importance of starbursts and AGNs is not known, nor are their associated timescales. Disentangling the contribution of these components (e.g., finding signatures of positive/negative feedback) in merging systems is crucial for comparing the observations with model predictions. In this respect NGC 6240 plays a central role as one of the nearest (z = 0.02448, DL = 111.2 Mpc, DA = 105.9 Mpc) luminous infrared galaxies observed in a relatively early merger state (Tacconi et al. 1999; Tezca et al. 2000; Bush et al. 2008; Engel et al. 2010; Medling et al. 2011). The infrared luminosity (LIR ~ 1011.94L⊙ = 3.4 × 1045 erg s-1, Wright et al. 1984; Sanders et al. 20031) is at the boundary between luminous infrared galaxies (LIRGs: LIR = (1011−1012)L⊙) and ULIRGs (ultra-luminous infrared galaxies: LIR ≥ 1012L⊙) and implies a high star formation rate (SFR = 61 ± 30 M⊙ yr-1 from Yun & Carilli 2002, through fitting of the far-infrared spectral energy distribution). Owing to the SFR which is high for its mass (e.g., Santini et al. 2009), NGC 6240 is classified as a starburst galaxy.
The optical emission-line spectrum (Fosbury & Wall 1979; Zasov & Karachentsev 1979; Fried & Schulz 1983; Morris & Ward 1988; Keel 1990; Heckman et al. 1987; Veilleux et al. 1995; Schmitt et al. 1996; Rafanelli et al. 1997) is dominated by LINER-like line ratios over the central ~10 kpc. This spectrum is preferentially associated with shocks produced by cloud-cloud collisions in the merging system and not with a central photoionizing AGN continuum (see, e.g., Fosbury & Wall 1979; Fried & Schulz 1983). Nevertheless, a few high-excitation features in IR spectra and in optical HST narrowband images indicate possible weak AGN signatures in the southern region of the galaxy (Rafanelli et al. 1997).
The definite presence of an obscured AGN in NGC 6240 has been known since the first ASCA hard X-ray observations showed that a reflection spectrum provides the best fit below 10 keV (Iwasawa & Comastri 1998). The primary emission obscured by a column density of about NH ~ 2 × 1024 cm-2 emerges only at higher energies and was originally detected by the PDS instrument on board BeppoSAX (Vignati et al. 1999). The nuclear intrinsic bolometric luminosity is in the quasar regime (Lbol ~ 1045 erg s-1, Vignati et al. 1999; Ikebe et al. 2000; Lira et al. 2002; Boller et al. 2003).
The presence of both a transmitted primary absorbed continuum and a cold reflection component is still under debate. The results obtained by the broadband spectral analysis up to energies of 100−200 keV (Vignati et al. 1999; Ikebe et al. 2000) are controversial. Vignati et al. (1999) clearly detect the transmitted primary absorbed continuum, but the presence of the cold reflection component is not significant. On the other hand, Ikebe et al. (2000), using RXTE data, obtained an equally good fit with either a reflection-dominated spectrum or with a reflected plus transmitted model. Therefore, the presence of a primary absorbed continuum is not certain from their spectral analysis. However, Ikebe et al. (2000) concluded that both components are needed because the intrinsic power law photon index is unusually flat (Γ = 1.26 ± 0.13) in the pure reflection-dominated model.
Historically, NGC 6240 has shown moderate X-ray variability on month/year timescales at energies larger than ~15 keV (22 ± 7%, 54 ± 18%, and 4 ± 3% in the 14−100, 14−24, and 35−100 keV Swift BAT energy bands, respectively; Soldi et al. 2014), while at softer energies it has not exhibited significant variability (Komossa et al. 1998; Netzer et al. 2005).
NGC 6240 is the result of the merging of two smaller galaxies, which formed a larger galaxy with two distinct nuclei with an angular separation of ~1.̋5 (~0.7 kpc). The two nuclei are observed in near-infrared (e.g., Fried & Schultz 1983), in the radio (e.g., Condon et al. 1982), and in optical (e.g., Rafanelli et al. 1997) images.
At X-ray wavelengths and thanks to its unsurpassed X-ray angular resolution ( ), Chandra identified that the two nuclei are both active and both exhibit highly obscured X-ray spectra typical of Compton-thick AGNs (Komossa et al. 2003). The southern nucleus is also brighter in X-rays than the northern nucleus. The observed 0.1−10 keV luminosities of the two nuclei are 1.9 × 1042 erg s-1 and 0.7 × 1042 erg s-1 (Komossa et al. 2003). The southern nucleus is also brighter based on 3−5 μm luminosity (see, e.g., Mori et al. 2014; Risaliti et al. 2006).
NuSTAR NGC 6240 observation log.
The black hole mass of the southern nucleus, obtained via high-resolution stellar kinematics, is (0.84−2.2) × 109M⊙ (Medling et al. 2011). The mass of the northern nucleus, if it follows the MBH−σ relation (Tremaine et al. 2002), is (1.4 ± 0.4) × 108M⊙ (Engel et al. 2010). Owing to the large scatter in the relation, this value is subject to systematic uncertainties that are much larger than the measurement errors.
The two nuclei are surrounded by extended X-ray emission modeled as a multitemperature plasma; the temperature and column density increase toward the central regions and the metal abundances are higher than solar ( − Netzer et al. 2005;
  − Boller et al. 2003; Wang et al. 2014). The hot gas, associated with highly ionized Fe xxv − emitting gas, peaks centrally at the southern nucleus, with ~30% of the emission originating outside the nuclear region. Its temperature (T ~ 7 × 10⁷ K) indicates the presence of fast shocks with velocities on the order of ~2200 km s-1 (Feruglio et al. 2013a; Wang et al. 2014). The energetics and the iron mass in the hot phase suggest that the fast shocks are due to a starburst-driven wind expanding into the ambient dense gas. Nevertheless, Wang et al. (2014) were not able to rule out additional energy injection in the circumnuclear region such as heating from an AGN outflow. High-resolution mapping of the CO(1−0) transition (Feruglio et al. 2013b) revealed the presence of a molecular outflow with velocity ~(200−500) km s-1 originating from the southern nucleus, likely driven by both supernova winds and radiation from the AGN. Alternatively, the CO(1−0) molecular gas condenses within the outflowing gas because the velocity difference between ionized and molecular outflows would lead to severe shredding (Veilleux et al. 2013). The coldest and outermost plasma forms a soft X-ray halo extending up to ~1.́5 from the two nuclei with subsolar metal abundances (
 − Nardini et al. 2013).
In this paper, we discuss the broadband (~0.3−70 keV) spectral and temporal properties of NuSTAR observations of NGC 6240 combined with archival XMM-Newton, Chandra, and BeppoSAX data. In Sect. 2, we describe the NuSTAR and archival observations. In Sect. 3 we discuss the variability properties. Section 4 presents the broadband spectral analysis, and in Sect. 5 we compare the individual Chandra spectra of the two nuclei with the NuSTAR spectrum of the galaxy as a whole. The results and conclusions are presented in Sects. 6 and 7, respectively.
Throughout this paper, we adopt a ΛCDM cosmology with Ωm = 0.27, ΩΛ = 0.73, and H0 = 67.3 km s-1 Mpc-1 (Planck Collaboration XVI 2014).
2. X-ray observations and data reduction
2.1. NuSTAR
NuSTAR consists of two focal plane modules, FPMA and FPMB; it is sensitive at 3−78.4 keV and has a field of view (FOV) at 10 keV of 10′ (Harrison et al. 2013). The observatory has a 18 FWHM with a half-power diameter of 58. We analyzed the NuSTAR observation of NGC 6240 performed in March 2014. The observation log is given in Table 1.
The raw events files were processed using the NuSTAR Data Analysis Software package v. 1.4.1 (NuSTARDAS)2. Calibrated and cleaned event files were produced using the calibration files in the NuSTAR CALDB (20150225) and standard filtering criteria with the nupipeline task. We used the nuproducts task included in the NuSTARDAS package to extract the NuSTAR source and background spectra using the appropriate response and ancillary files. We extracted spectra and light curves in each focal plane module (FPMA and FPMB) using circular apertures of radius 75, corresponding to ~80% of the encircled energy, centered on the peak of the emission in the 3−78.4 keV data (see Fig. 1). Background spectra were extracted using source-free regions on the same detector as the source. As shown in Table 1, the background count-rates are a low fraction (<8%) of the source count-rates.
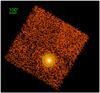 |
Fig. 1 3−78.4 keV NuSTAR image for the FPMA module. The image was smoothed with a Gaussian filter with σ = 1.5 pixels ( |

The spectra were binned according to two criteria: (i) following the energy resolution multiplied by a factor ~0.4 at all energies, when possible and (ii) requiring a signal-to-noise ratio (S/N) > 4.5. Spectral fitting was performed in the NuSTAR band alone and simultaneously with lower energy X-ray data (see below).
2.2. Chandra
Chandra, thanks to its unsurpassed X-ray angular resolution (), is an excellent complement to NuSTAR for analyzing the two nuclei and nearby regions and for studying possible contamination from sources that cannot be resolved by NuSTAR.
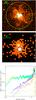 |
Fig. 2 Upper panel: 0.3−8 keV image mosaic of the 2001 and 2011 Chandra observations (see Table 2). The image was smoothed with a Gaussian filter with σ = 1.5 pixels (~ |

We analyzed four archival Chandra observations collected in 2001 and 2011 (see Table 2) using the Chandra Interactive Analysis Observations (CIAO) software (v4.5; Fruscione et al. 2006) and the standard data reduction procedures. The specextract task was used to extract the spectra. The background spectra were extracted from source-free regions at distances greater than about 1.́5 from the nuclei of the galaxy in order to avoid contamination from the X-ray diffuse emission, which is still seen on scales of 1′ (see Nardini et al. 2013). The spectra were binned to have at least 25 total counts per bin. The nuclei showed negligible pile-up (less than a few percentage points). For the final spectral analysis, we used only the two ACIS-S observations (2001 and 2011) due to calibration uncertainties above 5 keV of HETG 0th order ACIS-S spectra.
To avoid a loss of angular sensitivity, we registered the astrometry of the ACIS-S 2001 data to the ACIS-S 2011 data using the X-ray positions of bright common point-like sources. We found that the ACIS-S 2001 right ascension astrometric correction is −0.̋1, while the declination astrometric correction is negligible (i.e., 0.̋01).
From the analysis of the Chandra images (see upper panel of Fig. 2), using an aperture photometry technique (see, e.g., Puccetti et al. 2009), we identified nine serendipitous point sources with S/N ≥ 2 in the 0.3−8 keV band within or very near the area corresponding to the NuSTAR extraction region (i.e., a circle with a radius of 75). We co-added the source spectra, background spectra, and ancillary files of the nine sources with addascaspec FTOOLS v.6.13, leaving the original exposure time of a single source in the final co-added spectrum. The total 0.3−8 keV flux of these nine sources (green spectrum in the lower panel of Fig. 2) is definitely negligible in comparison to the flux in the NuSTAR extraction region (yellow spectrum in the lower panel of Fig. 2); it is fitted by a blackbody of kT ~ 0.8 keV and there is no evidence of any iron line emission. Therefore, the co-added spectrum of the nine brightest “contaminants” is consistent with a typical spectrum of ultra-luminous X-ray sources (ULXs), which turns over very quickly at about 10 keV as discovered by NuSTAR (see, e.g., Walton et al. 2015). For these reasons we conclude that any contamination by close point-like sources in the NuSTAR spectrum is negligible.
The second step was to extract the Chandra spectra of the whole galaxy (i.e., the combination of the two nuclei, extended emission, and serendipitous sources) using a circular region of radius 14.̋5 to maximize the S/N of the spectra. In this way we excluded most of the very soft X-ray emission in the halo of NGC 6240 (≤2 keV, see Nardini et al. 2013). This component is not detectable in the energy band covered by NuSTAR, which has a low energy limit at 3 keV. This is clearly seen in the comparison of the cyan and yellow spectra in the lower panel of Fig. 2.
Finally, we verified that the whole galaxy did not show significant variations during the four Chandra observations (see Fig. 3). We used the χ2 statistics with a threshold probability of 2% to test the hypothesis of constant light curves. The 0.3−8 keV light curve of the whole galaxy is consistent with it being constant between the two ACIS-S and the two ACIS-S HETG observations. The 6.4−8 keV count rates are only ~0.3% and ~10% of those in the full energy band, for the ACIS-S and the zero-order ACIS-S HETG, respectively. For this reason small amplitude hard X-ray variability is difficult to detect in the full energy range; therefore we also verified that the 6.4−8 keV count rates are statistically constant. The ACIS-S and ACIS-S HETG spectra are fully consistent with each other (see Fig. 4) confirming that the variability in the whole galaxy is not significant. Therefore, in order to improve the statistics for the final spectral analysis we used the co-added spectra of the two ACIS-S (2001 and 2011) observations and we also combined the corresponding background spectra, response, and ancillary files. We used addascaspec FTOOLS v.6.13, which combines spectra and normalized backgrounds according to the method explained in the ASCA ABC guide3.
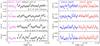 |
Fig. 3 Chandra background-subtracted light curves in bins of 5500 s. From top to bottom: 0.3−8 keV count rates of the whole NGC 6240 galaxy, 0.3−8 keV count rates of the southern nucleus, 0.3−8 keV count rates of the northern nucleus, and 6.4−8 keV count rates of the northern nucleus. The dot-dashed lines correspond to the values of the count rate weighted means. Left panels: the light curves of the two ACIS-S Chandra observations (see Table 2): 1590 (magenta open dots) and 12713 (black solid dots). Right panels: the light curves of the zero-order ACIS-S HETG Chandra data: 6909 (blue solid squares) and 6908 (red open squares). We note that the X-axis does not represent the real time. |
In addition to the spectrum of the whole galaxy, we also used the ACIS-S spectra of each of the two individual nuclei (see Komossa et al. 2003). The spectra were extracted using circular regions centered on RA = 16:52:58.896, Dec = +02:24:03.36 and RA = 16:52:58.922, Dec = +02:24:05.03 and with a radius of 0 9 for the southern nucleus (the brightest one) and 08 for the northern nucleus, respectively (blue and red circles and spectra in the middle and bottom panel of Fig. 2, respectively).
The 0.3−8 keV light curves of the southern and northern nucleus are consistent with being constant between the two ACIS-S and the two ACIS-S HETG observations (see Fig. 3). We also searched for variability in the two sub-bands: 0.3−6.4 keV and 6.4−8 keV. We found variability only in the 6.4−8 keV light curve of the northern nucleus in the ACIS-S 2011 observation ( with probability of false positive ≤0.6%, see bottom panels of Fig. 3). Nevertheless, the count rate variations are small and the median values of the count rates of the two ACIS-S observations are fully consistent (i.e., (0.011 ± 0.001) cts/s). Therefore, we also used the co-added spectra of the two ACIS-S (2001 and 2011) observations for the nuclei. We note that the 0.3–8 light curve of the northern nucleus of ACIS-S 2011 shows a systematic residual with respect to a fit with a constant in the time interval 100−120 ks in Fig. 3, which could be due to the 6.4−8 keV variability.
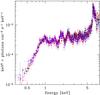 |
Fig. 4 Chandra spectra of the whole NGC 6240 galaxy, unfolded with the instrument response, extracted in the cyan region in the upper panel of Fig. 2. The colors represent the four observations (see Table 2). Since no significant spectral variability was present, we co-added the ACIS-S spectra. |
2.3. XMM-Newton
In the spectral analysis we also considered six XMM-Newton observations with a nonzero exposure time after background cleaning, obtained between September 2000 and August 2003 (see Table 2). The high spectral resolution of XMM-Newton at ~6 keV and the good counting statistics of the archival observations allow us to constrain the spectral shape and the intensity of the iron line complex. We reduced the data using the Science Analysis Software (SAS ver. 14.0.0), following the standard method described in the data analysis threads and the ABC Guide to XMM-Newton Data Analysis4 Epochs of high background events were excluded; only events corresponding to pattern 0−12 for MOS1/MOS2 and pattern 0−4 for PN were used. From the analysis of the Chandra spectra, we found that the AGNs and hot gas in the galaxy are extended less than 15′′, thus the spectra were extracted using a circular region of radius 40, which corresponds to ~90% of the encircled energy; this percentage is similar to the NuSTAR data, which includes all the galaxy emission at energy ≥2 keV. Extraction of the background spectra and the binning were done in a similar way to the NuSTAR analysis.
The whole NGC 6240 galaxy, as already pointed out by Netzer et al. (2005), does not exhibit significant spectral variability during the XMM-Newton observations (see also Fig. 5). Therefore, to improve the statistics, we considered the combination of all MOS1 and MOS2 spectra, and of the individual PN spectra. In the spectral analysis we used the XMM-Newton data between 2−10 keV only to avoid a larger soft X-ray contribution in comparison with the Chandra spectra.
NGC 6240 archival data.
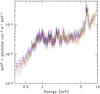 |
Fig. 5 XMM-Newton spectra of the whole NGC 6240 galaxy, unfolded with the instrument response. The colors represent the EPIC-PN and co-added EPIC-MOS1 and EPIC-MOS2 spectra for all the observations (see Table 2). |
2.4. BeppoSAX PDS data
NGC 6240 was observed by BeppoSAX (Boella et al. 1997) on 14 August 1998 (Vignati et al. 1999) with the Low Energy Concentrator Spectrometer (LECS; 0.45−4 keV), the two Medium Energy Concentrator Spectrometers (MECS; 1.65−10.5 keV) and the Phoswitch Detector System (PDS; 15−200 keV, Frontera et al. 1997; see Table 2). Data products were retrieved from the BeppoSAX archive at the ASI Science Data Center5. The data were calibrated and cleaned using the SAXDAS software. The MECS/LECS event files were screened adopting standard pipeline selection parameters, and the spectra were extracted from 4′ radii apertures, corresponding to ~90% of the encircled energy. The two MECS units were combined after renormalizing to the MECS1. The PDS is a collimator instrument with a field of view of ~1 3 (FWHM). The PDS data were calibrated and cleaned following the standard “fixed Rise Time threshold” method for background rejection. Following the method used for the NuSTAR data, we estimate that for the MECS data, the contamination by the nearby bright sources is less than 10%. We do not use the LECS data to avoid a larger soft X-ray contribution in comparison with data from other instruments used in this work.
3. Light curve variability
With a few exceptions (e.g., the Compton-thick to Compton-thin changes in NGC 1365, Risaliti et al. 2005, 2007), variability in Compton-thick AGN is extremely rare at energies below 10 keV. Constraining intrinsic variability in such obscured sources requires statistically good sampling of the 30−50 keV energy range where the primary continuum can arise. The analysis of the light curve in different energy ranges returns raw information on the origin of the variability (i.e., variations in Eddington ratio, column density, photon index of the primary continuum, reflection component). When data with good statistics are available, the following time/count rate resolved spectral analysis allows us to constrain the variable spectral parameters more accurately, and place constraints on the geometry of the reflecting/absorbing medium (see, e.g., NGC 4945 Puccetti et al. 2014; NGC 1068 Marinucci et al. 2016). Unfortunately, the statistics do not allow this detailed spectral analysis for NGC 6240.
The NuSTAR NGC 6240 observation lasted ~60 ks, but the Earth occults the target for approximately half the orbit, yielding a net exposure time of 30.8 ks. We analyzed the NuSTAR light curves in bins of 5800 s (~1 satellite orbit). We used the χ2 and the Kolmogorov-Smirnov tests to verify the constancy of the light curves. A light curve is considered definitely variable if the probability of a false positive is ≤2% for at least one of the two tests.
The 3−60 keV light curve is slightly variable and shows a systematic trend of the residuals with respect to a fit with a constant (see Fig. 6). To investigate possible spectral variations, we analyzed the 3−10 keV and the 10−60 keV light curves separately. We found that the 3−10 keV light curve is fully consistent with it being constant, but the 10−60 keV light curve is not, showing variability up to ~20%. The 3−10 keV light curve is not correlated with the 10−60 keV at a confidence level larger than 99.99% using the Spearman rank correlation coefficient. In the three energy bands, the background level is on the order of 7% of the total count rate. Moreover, we verified that the source and background light curves are not correlated at a confidence level of 5%.
To better analyze the hard X-ray variability, we analyzed NuSTAR light curves in three narrower energy ranges: 10−25, 25−35, and 35−60 keV. We found that the amplitude of the variations is largest in the 25−35 keV energy band, changing by ~40% on timescales of ~15−20 ks. We also searched for hard X-ray variability on similarly short timescales using the archival BeppoSAX 15−200 keV PDS data. The PDS light curve is not constant and the largest amplitude variability is ~50% on timescales of ~20 ks (see Fig. 7), fully consistent with the NuSTAR findings.
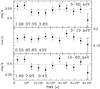 |
Fig. 6 NuSTAR light curves in bins of 5800 s (~1 satellite orbit). The count rates are the added values detected by the FPMA and FPMB modules corrected for livetime, PSF losses, and vignetting, but not for background. The dotted lines correspond to the values of the count rate weighted means. The numbers in the lower left corner of each panel indicate the values of |
The 20−70 keV PDS mean flux, evaluated assuming a power-law model with photon index fixed to 1.7, is a factor of ~0.9 the 20−70 keV NuSTAR mean flux. This factor contains possible source variability and also variability due to the inter-calibration uncertainty between the two instruments.
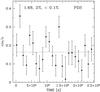 |
Fig. 7 BeppoSAX 15−200 keV PDS light curve in bins of 10.5 ks. The dotted line corresponds to the value of the count rate weighted mean. The numbers at the top indicate the values of |
As shown in Sect. 2.2, we also searched for variability in the Chandra data in the hardest accessible energy range (6.4−8 keV) of the northern and the southern nuclei separately. The count rate of the 2011 ACIS-S observation of the northern nucleus is found to be variable by a factor of ~1.3 on timescales of ~15 ks, while the southern nucleus is constant. In the two 2006 ACIS-S HETG observations we did not find statistically strong evidence of variability in the southern or in the northern nucleus. This could be due to the poorer statistics of the zero-order ACIS-S HETG data, in comparison to ACIS-S data (i.e., for the northern nucleus we had 50% fewer counts in the ACIS-S HETG).
In the 6.4−8 keV energy range, the composed light curve of the northern and southern nuclei does not present the variability shown by the northern nucleus alone because the northern nucleus is a factor of ~0.4 fainter and the amplitude of its variations is small. This result is consistent with the absence of variability in the 6.4−10 keV energy range in the XMM-Newton observations.
4. Broadband spectral analysis
4.1. The model
The extended X-ray emission at energies <5 keV in NGC 6240 is due to an absorbed multitemperature plasma. Both the temperature and the column density increase toward the central nuclei (Boller et al. 2003; Netzer et al. 2005; Wang et al. 2014). The cold-temperature plasma, which is the outermost, extends up to ~1.́5 from the nuclei, has subsolar metal abundances ( , see Nardini et al. 2013) and dominates at energies ≤1.5 keV. A medium-temperature plasma, which is less extended, is closer to the central nuclei. The hot-temperature plasma, which is dominant in the ~2−5 keV energy range, indicates the presence of fast shocks (Feruglio et al. 2013a; Wang et al. 2014, ACIS-S and HETG ACIS-S data) and is responsible for the Fe xxv line emission. While a scattered nuclear power-law would provide an equally good fit, the Fe xxv line emission is extended and spatially resolved by Chandra (Wang et al. 2014). Moreover, a dominant contribution to the Fe xxv from photoionization is ruled out through the comparison of the expected X-ray line ratios with the observed values (Netzer et al. 2005), unlike some non-LIRG AGN (e.g., NGC 1068, Bauer et al. 2015 and references therein; Circinus, Arévalo et al. 2014 and references therein) where photoionization is dominant.
The X-ray spectrum of NGC 6240 shows strong emission lines of Mg xii (1.47 keV), Si xiii (1.865 keV), Si xiv (2.006 keV), S xv (2.461 keV), and S xvi (2.622 keV) due to the hot thermal component, which are difficult to reproduce within the context of equilibrium models with solar metal abundance. Therefore, to reproduce these line ratios, the hot thermal component was modeled by the XSPEC apec/mekal models with super-solar metal abundance (− Netzer et al. 2005; − Boller et al. 2003). A more empirical approach was followed by Wang et al. (2014), who proposed a model with a mekal component with solar abundances, plus several Gaussians to fit the residual lines. Alternatively, the observed strong emission lines are expected in nonequilibrium models, in which the ion distribution is broader than in thermal equilibrium models with the same physical conditions; in this context, Feruglio et al. (2013a) modeled the hot thermal component by a shock model with almost solar abundances. Based on these arguments, we attempted to model the hot thermal component with two different approaches: a shock model (i.e., XSPEC pshock model, hereafter model A), and the usual mekal component (model B). As shown below, the solar chemistry can be used for model A, whereas model B requires super-solar metal abundances.
In the energy range 5−8 keV the emission is mainly due to the two obscured AGNs in the center of NGC 6240 (Komossa et al. 2003). Both nuclei are best fitted with a hard, reflection-dominated spectrum and associated iron line complex (i.e., FeKα at 6.4 keV, FeKβ at 7.06 keV rest-frame energies and the Compton shoulder).
In the NuSTAR band, the two nuclei cannot be spatially resolved, and their summed contribution in the hard X-ray band is modeled as follows: a) a primary continuum, transmitted through a high column density absorber, modeled by plcabs (Yaqoob 1997); b) a reflection component, due to optically thick gas with infinite column density illuminated by a power continuum and modeled with pexrav (Magdziarz & Zdziarski 1995). We investigate more physically realistic reflection models in Sects. 4.2 and 5.1. The photon indices of the primary and the reflected components are linked to the same value in the spectral fits. We also added three Gaussian lines to model the FeKα, FeKβ, and nickel Kα at 7.47 keV. The FeKα and nickel Kα are significant at 99.99% confidence level. The ratio between the normalization of the FeKβ and FeKα is fixed to the theoretical value (1:8.8; e.g., Palmeri et al. 2003). All the spectral components were absorbed by the Galactic column density along the line of sight (i.e., 4.87 × 1020 cm-2; Kalberla et al. 2005) and redshifted using z = 0.02448 (Downes et al. 1993). We used Anders & Grevesse (1989) cosmic abundances. For the broadband analysis, we simultaneously fit the ACIS-S (0.3−8 keV), PN (2−10 keV), MOS (MOS1+MOS2) (2−10 keV), FPMA (3−78.4 keV), and FPMB (3−78.4 keV) spectra of the whole galaxy. We introduced normalization factors to take into account the uncertain flux inter-calibration between different instruments. We fixed the normalization factor of FPMA to unity, leaving the other normalizations free to vary. As discussed above, we modeled the hot thermal components in two different ways. Therefore, we used two different models with the following XSPEC format
Model A:
constant × wabs Gal × (plcabs+pexrav+zgauss+zgauss+ zgauss+ wabs cold × vmekal cold + wabs med × mekal med + wabs hot × pshock hot )
Model B:
constant × wabs Gal × (plcabs+pexrav+zgauss+zgauss+ zgauss+ wabs cold × vmekal cold + wabs med × mekal med + wabs hot × mekal hot )
where the subscripts cold, med, and hot indicate the cold, medium-temperature, and hot thermal components, respectively.
4.2. Spectral analysis results
For both models A and B, the cold thermal component requires a subsolar abundance ( ) of the α elements (O, Ne, Mg, Si, S, Ar) and a lower subsolar iron abundance (
 ) at the 99.97% confidence level according to an F-test. This is consistent with Nardini et al. (2013). The absorbing column density for the cold thermal component (
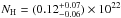 cm-2 for model A) is slightly higher than, but consistent with, the Galactic value (i.e., NH = 0.05× 1022 cm-2). The column densities of the gas obscuring the medium (kT ~ 0.9 keV) and the hot thermal components are similar, thus are linked together in the final fits (
 ) × 1022 cm-2 for model A). This is higher than the column density of the cold thermal component. Model B requires super-solar metal abundances for the medium-temperature and hot components (
 ).
).
The best-fit parameters are listed in Table 3. Both models are fully consistent with the data ( ); nevertheless, the quality of the fit for model B is slightly worse than for model A (Δχ2 = + 13 for the same number of degrees of freedom). The super-solar metallicity of the hot thermal component required by model B may indicate that the model is oversimplified. Indeed multitemperature plasma, nonthermal plasma, and X-ray binaries could contribute to this component with different percentages (see, e.g., Bauer et al. 2015; Arévalo et al. 2014). On the other hand, the temperature of the shock in model A (
 keV) is slightly higher than the temperature obtained by fitting only the XMM-Newton spectrum (kT = 5.5 ± 1.5 keV; Boller et al. 2003; Netzer et al. 2005) or the Chandra data (kT = 6.15 ± 0.3 keV; Wang et al. 2014) with similar xspec models, but is consistent within the uncertainties. In fact, if the shock temperature is fixed at 6 keV the best-fit solution is still statistically acceptable. On the basis of the above described physical arguments, we chose model A as the reference model. The broadband best-fit spectra residuals and model A are shown in Fig. 8.
Best-fitting parameters.
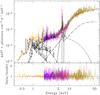 |
Fig. 8 Broadband spectra of the whole NGC 6240 galaxy, best-fit model (upper panel), and residuals (lower panel). The NuSTAR (green is FPMA, red is FPMB), XMM-Newton (blue is PN, magenta is MOS1+MOS2), and Chandra (orange) spectra unfolded with the instrument responses (for single XMM-Newton and Chandra spectra see Figs. 5 and 4, respectively) are plotted in the upper panel. The total model A is superimposed. The model’s single continuum components are also shown: the primary continuum (black solid line); the reflection continuum (black dashed line); the FeKα, FeKβ, and nickel lines (black dotted lines); and the three thermal components (black dash-dotted lines). The lower panel shows the data/best-fit model ratios. |
The best-fit parameters of the absorbed power-law, describing the nuclear X-ray continuum emission of the two nuclei, are Γ = 1.75 ± 0.08 and  cm-2. The nuclear absorption-corrected 2−10 keV luminosity is
  erg s-1; the reflection component in the 10−40 keV energy range is on the order of 20% of the observed primary emission.
We note, as pointed out by Murphy & Yaqoob (2009), that combining pexrav and plcabs may produce a bias toward solutions dominated by the direct continuum. Moreover, a disk/slab geometry with an infinite column density for the material responsible for the Compton-scattered continuum is assumed in the pexrav model. The spectral features associated with scattering (e.g., FeKα and FeKβ emission lines and Compton shoulder) in a more realistic, finite column density medium cannot be reproduced by infinite slab models. The mytorus model6 (Murphy & Yaqoob 2009; Yaqoob & Murphy 2011; see also Sect. 5) returns a more physically self-consistent description of the direct continuum and the reflection continuum and lines (Yaqoob & Murphy 2009, 2011; Yaqoob 2012) and it should not be affected by bias toward transmitted dominated solutions. Nevertheless, the presence in NGC 6240 of two nuclei unresolved by NuSTAR means that this source is not the best case for models like mytorus. Therefore, for the whole galaxy we used mytorus (described in the following section) for a first-order comparison with the spectral results obtained with model A.
Replacing plcabs+pexrav with mytorus in model A, the best-fitting parameters of the absorbed power-law, which describe the nuclear X-ray continuum emission of the two nuclei, are consistent with those obtained using model A (i.e., Γ = 1.70 ± 0.09 and 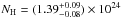 cm-2). Moreover, the source is still not reflection-dominated; we find that the 10−40 keV reflection component is less than 20% of the observed direct component. Finally, the nuclear absorption corrected 2−10 keV luminosity is ~8 × 1043 erg s-1, fully consistent with model A.
5. Resolving the two nuclei
The NGC 6240 hard X-ray emission is due to two AGNs in the center of the galaxy, resolved by Chandra (Komossa et al. 2003) but not by NuSTAR and XMM-Newton. This is the first attempt to disentangle the primary emission of each nucleus by combining the spatially resolved Chandra spectra with NuSTAR high-energy observations.
5.1. Chandra spectral analysis of the two individual nuclei
In order to disentangle the primary emissions, we independently fitted the Chandra spectra of the two nuclei (see Sect. 2.2) in the 0.3−8 keV energy range. The direct and reflection components (continuum and iron line emission) were modeled using the mytorus model (Murphy & Yaqoob 2009; Yaqoob & Murphy 2011).
Assuming that the direct continuum emission is a power law, three tables are needed to generate spectral fits: mytorusZ, mytorusS, and mytorusL. mytorusZ is a multiplicative table that contains the pre-calculated transmission factors that distort the direct continuum at all energies owing to photoelectric absorption and Klein-Nishina scattering (see Sect. 5.2 of the mytorus manual). mytorusS and mytorusL represent the Compton-scattered/reflected continuum toward the line of sight and the fluorescence emission lines typically produced in highly obscured AGNs (i.e., FeKα, FeKβ, and Compton shoulder), respectively. We used the mytorus model in the original geometry (i.e., the so-called coupled mode, which represents a uniform torus with a half-opening angle of 60°, corresponding to a covering factor of 0.5). The normalization of the line component (mytorusL) is linked to that of the scattered/reflected continuum (mytorusS). A set of mytorusL tables are available for a range of energy offsets for best-fitting the peak energies of the emission lines. We found that an offset of +30 eV is optimal for the northern nucleus. This energy offset is consistent with the results obtained fitting the spectra of the northern and the southern nucleus in the 5.5−8 keV energy range with an oversimplified model (i.e., empirical power-law continuum model plus redshifted Gaussian lines). The FeKα energy best-fit values are (6.39 ± 0.01) keV and (6.42 ± 0.01) keV for the southern and northern nucleus, respectively. These values are consistent with those obtained by Wang et al. (2014, see their Table 2). The FeKα energy of the northern nucleus line is systematically higher than the theoretical value, the energy blueshift is  eV (conservatively, the uncertainties are at the 90% confidence level for two parameters of interest, i.e., Δχ2 = 4.61). This offset could take into account any residual offset due to a blend of neutral and mildly ionized iron. Alternatively, the shift could be the Doppler effect due to outflowing reflecting/absorbing medium with velocity
  km s-1 (see, e.g., Elvis 2000; Risaliti et al. 2002) or residual relative motion between the two nuclei at the late stage of the merging process (see, e.g., Bournaud et al. 2011). In the latter scenario and assuming the above velocity, the coalescence will be in (
 ) Myr, which is shorter than the timescales of 10−20 Myr estimated by other authors (see, e.g., Scoville et al. 2015).
The spectrum of each nucleus contains part of the X-ray emission of the circumnuclear plasma because the hottest plasma probably originates near the nuclei. Moreover, for projection effects, the spectra can also be contaminated by the coldest plasma. Therefore, we include the multitemperature plasma, modeled using the cold, the medium-temperature, and the shock components as in model A (Sect. 4.2), in the spectral modeling.
The xspec format for the adopted model for each nucleus is
zpowerlaw ×mytorusZ(θobs) + mytorusS(θobs) + mytorusL(θobs) + wabscold×vmekalcold + wabsmed×mekalmed + wabshot×pshockhot
where θobs is the inclination angle between the torus polar axis and the observer’s line of sight and the photon index of the primary continuum was fixed to the best-fit value of the whole galaxy spectrum (see Sect. 4.2 and and Table 3).
We performed a fit initially fixing the parameters describing the temperatures, absorption column densities, and metal abundances of the three thermal components at the best-fit values obtained for the whole galaxy spectrum (see Table 3), leaving the normalizations free to vary. We note that the normalization of the cold thermal component for the northern nucleus is consistent with zero, while for the southern nucleus it is only ~4% of the normalization of the medium-temperature component. We do not find a statistically good description of the spectra ( ), and some residuals are left at low energies. The best fit for the southern nucleus (
 /χ2 prob.=1.2/7%) is obtained with slightly higher values of the temperature of the medium-temperature plasma component and the associated absorbing column density (kT = (1.3 ± 0.2) keV, NH = (1.5 ± 0.2) × 1022 cm-2), as well as a higher value of the absorbing column density of the shock component (NH = (10 ± 3) × 1022 cm-2). This is also the case for the northern nucleus, in which the best-fit (/χ2 prob.=1.3/3.4%) value of the absorbing column density of the shock component is slightly higher (NH = (1.9 ± 0.3) × 1022 cm-2) than that obtained in Sect. 4.2. These results are consistent with the fact that the extended X-ray emission of NGC 6240 over a large scale suffers from blending of thermal plasma with different temperatures, inhomogeneous absorption, and metal abundance. Therefore, spatially resolved analysis in small regions can give results that are slightly different from the results obtained using data from larger regions (e.g., Wang et al. 2014).
The intrinsic 2−10 keV flux due to the shock component is a factor of ~6.5 larger in the southern nucleus than in the northern, consistent with the scenario that the shock originates from the southern nucleus (see Feruglio et al. 2013b; Wang et al. 2014). We also found that about 60%, 10%, and 30% of the total Fe xxv line flux is emitted in the southern nucleus, northern nucleus, and extended region, respectively. These percentages are consistent with those found by Wang et al. (2014) through spectral and imaging analysis.
The Chandra best-fit parameters of the primary continuum for each nucleus are reported in Table 4. For both nuclei, the inclination angle of the torus and the absorbing column density are not correlated. The inclination angle of the two tori and the absorbing column densities are different above the 99% confidence level. The equatorial NH is higher in the northern nucleus, while the inclination angle is larger in the southern one (see Fig. 9). The actual line-of-sight column densities are  ) × 1024 cm-2 and
  ) × 1024 cm-2 for the southern and northern nuclei, respectively. For both nuclei, this is consistent with an optical depth to Thomson scattering of τT ~ 1.27. The equivalent widths of the FeKα line (Table 4) are fully consistent with previous results (Wang et al. 2014). The intrinsic primary 2−10 keV luminosity of the southern nucleus (5.2 × 1043 erg s-1) is a factor of ~2.6 larger than that of the northern.
Chandra best-fit parameters for the two nuclei.
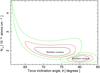 |
Fig. 9 Chandra 68%, 90%, and 99% confidence contours for the southern and northern nucleus: equatorial column density NH (in units of 1024 cm-2) versus θobs (i.e., inclination angle between the torus polar axis and the observer’s line of sight). The confidence contours are evaluated leaving NH, θobs, and the normalizations of the direct continuum free to vary. |
5.2. Chandra model of the two nuclei versus the NuSTAR spectrum
The sum of the best-fit models of the Chandra spectra of the two nuclei described above is extrapolated to high energies and overplotted on the NuSTAR data of the whole galaxy in Fig. 10. A statistically acceptable description of the NuSTAR spectrum is obtained without adjusting the fit: /χ2 prob. = 1.16/2.7% for the 3−70 keV energy range, and 1.09/15% ignoring the 7.5−9 keV energy range, where the discrepancies are the largest as judged by the residuals in the lower panel of Fig. 10.
Leaving the normalization of the direct continuum and the equatorial NH for the southern or the northern nucleus free to vary, the goodness of the fit improves to the 99.8% confidence level. While the best-fit values of the normalization of the direct continuum remain consistent with those previously measured, the best-fit values of the column density are systematically lower (NH = (1.38 ± 0.06) × 1024 cm-2 and 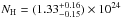 cm-2 for the southern and northern nucleus, respectively). This indicates possible column density variations ≤2 × 1023 cm-2 on timescales of ~3 yr. Fits were also performed leaving the spectral slope free to vary. While for the southern nucleus the best-fit photon index is relatively well constrained (Γ = 1.70 ± 0.08), only a lower limit could be obtained for the northern value (Γ > 1.67). In both cases, these slopes are fully consistent with that obtained fitting the total spectrum (Γ = 1.75).
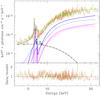 |
Fig. 10 NuSTAR spectra unfolded with the instrument responses (green is FPMA, red is FPMB) superimposed with the best-fit thermal component of the whole galaxy (black long dash-dotted line, medium-temperature and shock components in model A: wabsmed×mekalmed + wabshot×pshockhot, see Sect. 4.2), and the Chandra best-fit mytorus model for the two nuclei (see Sect. 5). The blue lines indicate the primary continuum (solid line) and the reflection continuum and lines (dotted line) of the southern nucleus; the magenta lines are the primary continuum (solid line), the reflection continuum, and lines (dotted line) of the northern nucleus. In the lower panel the NuSTAR data/Chandra best-fit model ratios are shown. |
6. Discussion
The two nuclei in NGC 6240 are separated by ~ (~0.7 kpc, Fried & Schultz 1983) and are therefore not spatially resolved by NuSTAR or XMM-Newton. As a first step, we performed joint NuSTAR+XMM-Newton+Chandra broadband spectral analysis (0.3−70 keV) of the data of the whole NGC 6240 galaxy (i.e., the combination of the two nuclei, extended emission, and serendipitous sources), to evaluate the mean properties of the whole system and for comparison with previous high-energy observations.
The broadband 0.3−70 keV spectrum is characterized by three main spectral components (model A in Sect. 4.1 and Table 3). The first is the primary continuum emission piercing through a Compton-thick obscuring medium, which dominates the spectrum at energies >10 keV where most of the X-ray luminosity is observed. The second component is the reflected/scattered emission from cold gas, which also generates strong FeKα and FeKβ emission lines at 6−7 keV. The third is a multitemperature thermal plasma due to the nuclear starburst and extended super-wind. Both the transmitted and the reflected components are required by the best fit at a high level of significance (>5σ) according to an F-test. The intensity of the reflection component in the 10−40 keV energy range is on the order of, or slightly lower than, ~20% of the observed primary emission. Therefore, most of the high-energy flux is transmitted rather than Compton-scattered, and the whole system is not reflection-dominated. This is consistent with the relatively low value of the FeKα line equivalent width (~0.3 keV; see also Shu et al. 2011; Brightman & Nandra 2011) and the observed variability at energies >10 keV.
The nuclear emission is characterized by a primary power law continuum with Γ = 1.75 ± 0.08 and  cm-2, and intrinsic luminosity of (
 1043 erg s-1 and (
 erg s-1 in the 2−10 keV and 3−78 keV energy ranges, respectively. Our findings significantly improve upon previous BeppoSAX (Vignati et al. 1999) and RXTE (Ikebe et al. 2000) results, both for disentangling the primary and reflection components, and for better constraining the spectral parameters.
The BeppoSAX best-fit absorbing column density ( cm-2) is higher than the NuSTAR best-fit value at >3σ. To better investigate this discrepancy we re-analyzed the BeppoSAX data using our best-fit model A (see Sect. 4.2 and Table 3) and leaving only the column density obscuring the primary continuum free to vary. We introduced a normalization factor between our best-fit model A and the BeppoSAX data to take into account the flux inter-calibration and the contribution from the serendipitous sources in the MECS extraction region (radius 4
 , see Sect. 2.4). The best-fit cross-normalization factor is 1.09 ± 0.05. We also added a normalization factor between the MECS and PDS data following the ABC BeppoSAX data analysis guide8. The best-fit (/χ2 prob. = 0.84/79%) value of the absorbing column density is
  cm-2, which is lower than, although consistent within the errors with the Vignati et al. (1999) best-fit value. The BeppoSAX best-fit NH remains systematically higher than that of NuSTAR by about ~(1−2) × 1023 cm-2, and the bolometric luminosity is ~9% higher than that measured from NuSTAR. This luminosity difference includes the inter-calibration uncertainty between the NuSTAR and the BeppoSAX data, and is consistent with little intrinsic variability in NGC 6240. This would also suggest that the BeppoSAX data are not contaminated by bright serendipitous sources.
6.1. Extended emission
The NuSTAR data have made a precise measurement of the nuclear continuum of NGC 6240 possible over a broad energy range and in turn allowed better constraints on the softer components associated with the host galaxy. More specifically, the medium-temperature plasma (mekalmed, kTmed in Table 3) has an observed luminosity of 2 × 1041 erg s-1 and ~0.9 × 1041 erg s-1 in the 0.5−2 and 2−10 keV energy ranges, respectively. Star-forming galaxies are luminous sources of X-ray emission that originates from X-ray binaries, young supernovae remnants, hot (0.2−1 keV) interstellar gas associated with star-forming regions, and O stars (Fabbiano 1989, 2006 for reviews). Their X-ray luminosity correlates with the SFR (see, e.g., Ranalli et al. 2003; Lehmer et al. 2010 and reference therein), thus using the NGC 6240 SFR (61 M⊙ yr-1 Yun & Carilli 2002) and the relations by Ranalli et al. (2003) and Lehmer et al. (2010) we estimate a 0.5−2 keV luminosity of 2.7 × 1041 erg s-1 and a 2−10 keV luminosity of  erg s-1. Despite the uncertainties that affect these relations, these results suggest that the medium-temperature component can be fully due to star formation.
The hot plasma (kThot in Table 3) is fitted with both a nonequilibrium model (model A in Table 3) and an equilibrium model (model B in Table 3). Using model A, the ionization timescale parameter is  s cm-3. If the plasma were close to being in collisional ionization equilibrium then we would expect a value ≥1012 s cm-3 (Masai 1994), suggesting that the plasma is in a marginally nonequilibrium state. The nonequilibrium model is statistically preferred over the equilibrium model (Δχ2 = + 13 for the same number of d.o.f.). Furthermore, it does not require super-solar metal abundances, which are required for model B (). The nonequilibrium model strongly favors the presence of a nuclear shock (Feruglio et al. 2013a; Wang et al. 2014).
For the shock component, we evaluated a best-fit value of the column density value of NH ≃ 1023 cm-2 and an intrinsic 0.5−8 keV luminosity of ~3 × 1042 erg s-1. This value is about a factor of 0.5 smaller than the luminosity obtained from the Chandra spectrum only, but, as noticed by Wang et al. (2014), their absorption-corrected luminosity could be overestimated by a factor of two, given their unlikely large column density of the gas obscuring the hot plasma (i.e., NH = (5.5 ± 1.7) × 1023 cm-2).
6.2. AGN contribution
The total AGN bolometric luminosity, calculated assuming the bolometric corrections for type 2 AGNs of Lusso et al. (2011; ~15 for the observed X-ray luminosity with an uncertainty of a factor of ~3) and the absorption-corrected nuclear 2−10 keV X-ray luminosity is  1045 erg s-1. This value is a factor of ~2 lower than that evaluated from the spectral energy distribution (Lira et al. 2002, Lbol ~ 2 × 1045 erg s-1, assuming the cosmology adopted in this paper). We note that Lira et al. (2002) − extrapolating the best-fit of Vignati et al. (1999) − assumed an AGN unabsorbed 2−10 keV continuum flux of 1 × 10⁻¹⁰ erg s-1 cm-2, which is ~twice ours; this explains the discrepancy in the bolometric luminosity. We also note that a lower value of the total AGN bolometric luminosity reduces the discrepancy between the luminosity of the 140 K component and the absorbed AGN continuum found by the spectral energy distribution (Lira et al. 2002). Therefore, NGC 6240 is one of the most luminous among the local bona fide Compton − Thick AGNs, similar to Mrk34 (Gandhi et al. 2014).
Assuming that the 8−1000 μm luminosity of 3.4 × 1045 erg s-1 (Wright et al. 1984; Sanders et al. 2003) is a good proxy for the total luminosity, the two AGNs contribute ~ % of the total energy output. This is consistent with the values obtained using multiple methods such as SED+Infrared spectroscopy fitting, PAH features, high- and low-excitation mid-infrared (MIR) lines, and MIR dust continuum (e.g., 20−24% − Armus et al. 2006; 25−50% − Lutz et al. 2003; up to 60% − Egami et al. 2006; 25.8% − Veilleux et al. 2009; 45−60% − Mori et al. 2014). The AGN fraction is relatively high for the observed infrared luminosity, but it is not implausible. Alonso−Herrero et al. (2012) showed that in local LIRGs the AGN bolometric contribution to the IR luminosity of the system is >25% in about 8% of the sample. Moreover, in the local Universe the AGN contribution increases with the IR luminosity of the system (Nardini et al. 2010; Imanishi et al. 2010a,b; Alonso Herrero et al. 2012), and NGC 6240 is a high-luminosity LIRG.
6.3. Accretion rate of the two nuclei
The spatially unresolved NuSTAR spectrum is consistent with the sum of the best-fit models obtained from the spectral analysis of the Chandra data of the two nuclei. This suggests that the emission at energies >10 keV of NGC 6240 is due only to the two nuclei, and is not strongly variable on long timescales (~3 yr). Moreover, there are possible column density variations of ≤2 × 1023 cm-2. The two nuclei are both highly absorbed with τT ~ 1.2 (i.e., NH ~ 1.5 × 1024 cm-2) and at energies >10 keV they are dominated by the primary continuum emission. The actual line-of-sight column density is a few 1022 cm-2 larger in the northern nucleus; this would be consistent with the results from the 3−5 μm spectroscopy (Risaliti et al. 2006). The similarity of the column densities of the Compton-thick material obscuring the two nuclei could suggest that there is a common obscurer along the line of sight, possibly originating in gas and dust thrown up by the ongoing galaxy merger. The current data do not allow us to determine where this material lies. The calorimeter on board the Astro-H mission (Takahashi et al. 2014) will allow the profile of the FeKα to be measured with a resolution on the order of ≈350 km s-1 and thus it will be possible to determine whether it originates in a compact circumnuclear torus or in larger scale material in the host galaxy (Gandhi et al. 2015).
The intrinsic primary 2−10 keV luminosities of the southern (5.2 × 1043 erg s-1) and northern nucleus (2 × 1043 erg s-1) are fairly consistent (within a factor of ~2) with those expected from the MIR-X-ray luminosity correlation (Gandhi et al. 2009), using the nuclear 12 μm fluxes (Asmus et al. 2014).
The bolometric luminosities are 8 × 1044 erg s-1 and 2.6 × 1044 erg s-1 for the southern and northern nuclei, respectively, using bolometric corrections for type 2 AGN from Lusso et al. (2011). The southern nucleus is brighter than the northern as expected according to the 3−5 μm luminosity (see, e.g., Risaliti et al. 2006; Mori et al. 2014). The bolometric luminosity of the southern nucleus is lower, but consistent with the value from the spectral energy distribution in the near- and mid-IR bands (Lbol = (1.4 ± 0.6) × 1045 erg s-1, assuming the cosmology adopted in this paper). The slight, not significant, discrepancy could be due to a residual starburst contribution in the MIR flux.
The inferred accretion rate, λEdd = Lbol/LEdd is ~0.005 for the southern nucleus, assuming a black hole mass of (0.84−2.2) ×109M⊙ (Medling et al. 2011), and
  for the northern nucleus assuming a black hole mass of (1.4 ± 0.4) × 108M⊙ (Engel et al. 2010). The northern nucleus shows a higher λEdd, but the uncertainties on its black hole mass are also a factor of a few. On the contrary, the black hole mass of the southern nucleus is more precise, being determined by high-resolution stellar kinematics. The estimated accretion rates are on the low tail of the distribution of Eddington ratios in nearby Seyfert 2 galaxies (e.g., Vasudevan et al. 2010). In this respect, it is similar to the obscured AGNs selected in the GOODS survey (Simmons et al. 2011, 2012). The low value of the accretion rate and the high black hole mass for both nuclei suggests that they could have already assembled most of their mass through accretion processes and are likely to become inactive. The low level of accretion in a luminous, highly obscured early merger system is somewhat unexpected. The relatively low accretion rate may be associated with the strong molecular outflow (Feruglio et al. 2013b), which has depleted the nuclear regions of gas. We also note that in spite of the large uncertainties in the black hole mass and Eddington ratio, the photon index of the primary continuum is consistent with the low accretion rates of the two nuclei according to the relation found for a few AGN type 1 samples (Shemmer et al. 2008; Risaliti et al. 2009; Brightman et al. 2013).
6.4. Hard X-ray variability
A detailed analysis of the light curves in several independent energy bands clearly reveals hard X-ray variability on timescales of ~15−20 ks by up to ~20%. The variability peaks at ~30 keV (~40%). These results are consistent with the variability detected earlier in the Swift BAT data on substantially longer timescales (i.e., months/years). In fact, Soldi et al. (2014) found maximum (54 ± 18%) and minimum variability (4 ±3%) in the 14−24 and 35−100 keV energy bands, respectively. Moreover, by re-analyzing the BeppoSAX PDS data (~15−200 keV), we found variability up to ~50% on timescales fully consistent with those of the NuSTAR hard X-ray light curve. The PDS has a field of view (FOV) of 1.3° and therefore the data could suffer from contamination. Nevertheless, for NGC 6240, no known bright sources are present in the PDS FOV, and the probability of a serendipitous source in the PDS FOV with a flux equal to or larger than that of NGC 6240 is ≤10-5 (see Vignati et al. 1999).
Assuming that the NuSTAR, BeppoSAX PDS, and Swift BAT hard X-ray variability have the same origin, the observed variability can be explained by the two following hypotheses:
-
a)
the variability is due to flux variations of the transmittedcomponent of the southern nucleus up to ~20−30% for NuSTAR, and by ~50−70% for the BeppoSAX PDS and Swift BAT observed variability. Indeed, the lack of variability of the FeKα line suggests that the reflection component is constant. Moreover, the spectral analysis suggests that the nuclei are transmission dominated at energies >10 keV.
-
b)
On the contrary, if the variability is due to the northern nucleus, the amplitude of the variations should be up to ~50−60% for NuSTAR, and up to a factor of ~2.6 for the BeppoSAX PDS and Swift BAT observed variability. The NuSTAR variability would be consistent with the tentative ~30% variability in the 6.4−8 keV Chandra light curve of the northern nucleus. Nevertheless the NuSTAR, BeppoSAX PDS, and Swift BAT hard X-ray variability would imply that the northern nucleus should be as bright as, or brighter than the southern nucleus in some periods. This is difficult to reconcile with the evidence that over the last ~15 yr all the data suggest that the southern nucleus has been brighter than the northern as indicated by the Chandra data (Komossa et al. 2003; Shu et al. 2011; Wang et al. 2014) and 3−5 μm luminosity (see, e.g., Mori et al. 2014; Risaliti et al. 2006). Therefore, the most plausible hypothesis is that the hard X-ray variability is mainly due to variations of the transmitted component of the southern nucleus.
The 6.4−8 keV tentative variability of the northern nucleus suggests changes of the direct continuum and/or of the column density; we are not able to disentangle them with the current data. In all cases, the different 6.4−8 keV variability could be an indication that the matter reflecting/Compton-scattering the nuclear emission is distributed differently in the nuclei, as the results obtained in the present analysis seem to suggest (see Fig. 9).
On timescales on the order of years, the mean hard X-ray flux state is approximately constant, suggesting that the accretion rates of the two nuclei do not experience strong variability on year-long timescales.
The variability observed in NGC 6240 is similar to that observed in NGC 4945. In NGC 4945 the hard X-ray variability is also ascribed to changes of the primary continuum, confirmed through a detailed count rate resolved spectral analysis (Puccetti et al. 2014). In NGC 4945, the fast and large hard X-ray variability, the constancy of the FeKα line, and the huge Compton depth along the line of sight (τT ~ 2.9) suggest a low global covering factor (~0.15) for the circumnuclear gas. In comparison with NGC 4945, in NGC 6240 the FeKα line is constant, but the hard X-ray variability is smaller and slower, likely due to the higher black hole masses and lower accretion rates, and the Compton depth along the line of sight is a factor ~2.5 lower. These findings indicate that the global covering factor for NGC 6240 should be larger than in NGC 4945.
7. Conclusion
We present NuSTAR observations of NGC 6240, one of the nearest luminous infrared galaxies in a relatively early merger state with two distinct nuclei separated by a distance of ~. The main results of this work can be summarized as follows:
-
We clearly detect at a high significance (>5σ) both the transmitted primary absorbed continuum and the cold reflection continuum. The primary continuum is obscured by a NH of ~1.6 × 1024 cm-2 and dominates at energies >10 keV.
-
The total AGN bolometric luminosity is (
 1045 erg s-1, which is % of the infrared luminosity. This indicates that the galaxy emission is not dominated by the two AGNs, but likely by a starburst and related processes.
 -
The spatially unresolved NuSTAR hard X-ray spectrum of NGC 6240 is consistent with the sum of the Chandra best-fit models of the two nuclei extrapolated to the NuSTAR hard X-ray energies. This suggests that the hard emission of NGC 6240 is only due to the two nuclei, and that it has not varied by much on a decade-long timescale. Both nuclei are highly absorbed with τT ~1.2 (i.e., NH ~ 1.5 × 1024 cm-2) as expected in the early stage of a major merger, and have bolometric luminosities ~8 × 1044 erg s-1 (southern nucleus) and ~2.6 × 1044 erg s-1 (northern nucleus). The two nuclei show low accretion rates (λEdd = Lbol/LEdd is ~0.005
for the southern nucleus and for the northern nucleus). -
We found variability in the NuSTAR light curve at energies >10 keV of ~20% on timescales of 15−20 ks. We found similar variability in the BeppoSAX PDS light curve. Various arguments lead us to conclude that the hard X-ray variability is due to variations of the primary continuum of the southern nucleus.
-
Finally, by comparing NuSTAR, BeppoSAX, and Chandra archival data we found that the two nuclei remain consistently Compton-thick. Although we find evidence of variability of the material along the line of sight with column densities NH ≤ 2 × 10²³ on timescales of ~3−15 yr.
LIR is the 8−1000 μm luminosity according to the cosmology used in this paper.
τT = x × σT × NH, where σT is the Thomson cross section and x is the mean number of electrons per H atom, which is ~1.2 assuming cosmic abundance.
Acknowledgments
This work was supported under NASA Contract NNG08FD60C, and made use of data from the NuSTAR mission, a project led by the California Institute of Technology, managed by the Jet Propulsion Laboratory, and funded by the National Aeronautics and Space Administration. We thank the NuSTAR Operations, Software and Calibration teams for support with the execution and analysis of these observations. This research has made use of the NuSTAR Data Analysis Software (NuSTARDAS) jointly developed by the ASI Science Data Center (ASDC, Italy) and the California Institute of Technology (USA). A.C., A.M., F.F. and L.Z. acknowledge support from the ASI/INAF grant I/037/12/0 − 011/13. W.N.B. acknowledges support from Caltech NuSTAR sub-contract 44A-1092750. F.E.B. and C.R. acknowledge support from CONICYT−Chile grants Basal−CATA PFB−06/2007 and FONDECYT 1141218. F.E.B., C.R. and P.A. acknowledge support from “EMBIGGEN” Anillo ACT1101. FEB acknowledges support from the Ministry of Economy, Development, and Tourism’s Millennium Science Initiative through grant IC120009, awarded to The Millennium Institute of Astrophysics, MAS. M.B. acknowledges support from NASA Headquarters under the NASA Earth and Space Science Fellowship Program, grant NNX14AQ07H.
References
- Alonso-Herrero, A., Pereira-Santaella, M., Rieke, G. H., & Rigopoulou, D. 2012, ApJ, 744, 2 [NASA ADS] [CrossRef] [Google Scholar]
- Anders, E., & Grevesse, N. 1989, Geochim. Cosmochim. Acta 53, 197 [Google Scholar]
- Arévalo, P., Bauer, F. E., Puccetti, S., et al. 2014, ApJ, 791, 81 [NASA ADS] [CrossRef] [Google Scholar]
- Armus, L., Bernard-Salas, J., Spoon, H. W. W., et al. 2006, ApJ, 640, 204 [NASA ADS] [CrossRef] [Google Scholar]
- Asmus, D., Hönig, S. F., Gandhi, P., Smette, A., & Duschl, W. J. 2014, MNRAS, 439, 1648 [NASA ADS] [CrossRef] [Google Scholar]
- Bauer, F. E., Arévalo, P., Walton, D. J., et al. 2015, ApJ, 812, 116 [NASA ADS] [CrossRef] [Google Scholar]
- Boella, G., Butler, R. C., Perola, G. C., et al. 1997, A&AS, 122, 299 [NASA ADS] [CrossRef] [EDP Sciences] [Google Scholar]
- Boller, Th., Keil, R., Hasinger, G., et al. 2003, A&A, 411, 63 [NASA ADS] [CrossRef] [EDP Sciences] [Google Scholar]
- Bournaud, F., Chapon, D., Teyssier, R., et al. 2011, ApJ, 730, 4 [NASA ADS] [CrossRef] [Google Scholar]
- Brightman, M., & Nandra, K. 2011, MNRAS, 413, 1206 [CrossRef] [Google Scholar]
- Brightman, M., Silverman, J. D., Mainieri, V., et al. 2013, MNRAS, 433, 2485 [NASA ADS] [CrossRef] [Google Scholar]
- Bush, S. J., Wang, Z., Karovska, M., & Fazio, G. G. 2008, ApJ, 688, 875 [NASA ADS] [CrossRef] [Google Scholar]
- Condon, J. J., Condon, M. A., Gisler, G., & Puschell, J. J. 1982, ApJ, 252, 102 [NASA ADS] [CrossRef] [Google Scholar]
- Di Matteo, T., Springel, V., & Hernquist, L. 2005, Nature, 433, 604 [NASA ADS] [CrossRef] [PubMed] [Google Scholar]
- Downes, D., Solomon, P. M., & Radford, S. J. E. 1993, ApJ, 414, L13 [NASA ADS] [CrossRef] [Google Scholar]
- Egami, E., Neugebauer, G., Soifer, B. T., et al. 2006, AJ, 131, 1253 [NASA ADS] [CrossRef] [Google Scholar]
- Elvis, M. 2000, ApJ, 545, 63 [NASA ADS] [CrossRef] [Google Scholar]
- Engel, H., Davies, R. I., Genzel, R., et al. 2010, A&A, 524, A56 [NASA ADS] [CrossRef] [EDP Sciences] [Google Scholar]
- Fabbiano, G. 1989, ARA&A, 27, 87 [NASA ADS] [CrossRef] [Google Scholar]
- Fabbiano, G. 2006, ARA&A, 44, 323 [NASA ADS] [CrossRef] [Google Scholar]
- Feruglio, C., Fiore, F., Maiolino, R., et al. 2013a, A&A, 549, A51 [NASA ADS] [CrossRef] [EDP Sciences] [Google Scholar]
- Feruglio, C., Fiore, F., Piconcelli, E., et al. 2013b, A&A, 558, A8 [Google Scholar]
- Fosbury, R. A. E., & Wall, J. V. 1979, MNRAS, 189, 79 [NASA ADS] [CrossRef] [Google Scholar]
- Fried, J. W., & Schulz, H. 1983, A&A, 118, 166 [NASA ADS] [Google Scholar]
- Frontera, F., Costa, E., dal Fiume, D., et al. 1997, SPIE, 3114, 206 [Google Scholar]
- Fruscione, A., McDowell, J. C., Allen, G. E., et al. 2006, Proc. SPIE, 6270 [Google Scholar]
- Gandhi, P., Horst, H., Smette, A., et al. 2009, A&A, 502, 457 [NASA ADS] [CrossRef] [EDP Sciences] [Google Scholar]
- Gandhi, P., Lansbury, G. B., Alexander, D. M., et al. 2014, ApJ, 792, 117 [NASA ADS] [CrossRef] [Google Scholar]
- Gandhi, P., Hoenig, S. F., & Kishimoto, M. 2015, ApJ, 812, 113 [NASA ADS] [CrossRef] [Google Scholar]
- Harrison, F. A., Craig, William, W., et al. 2013, ApJ, 770, 103 [NASA ADS] [CrossRef] [Google Scholar]
- Heckman, T. M., Armus, L., & Miley, G. K. 1987, AJ, 92, 276 [NASA ADS] [CrossRef] [Google Scholar]
- Hopkins, P. F., & Elvis, M. 2010, MNRAS, 401, 7 [NASA ADS] [CrossRef] [Google Scholar]
- Ikebe, Y., Leighly, K., Tanaka, Y., et al. 2000, MNRAS, 316, 433 [NASA ADS] [CrossRef] [Google Scholar]
- Imanishi, M., Maiolino, R., & Nakagawa, T. 2010a, ApJ, 709, 80 [Google Scholar]
- Imanishi, M., Nakagawa, T., Shirahata, M., Ohyama, Y., & Onaka, T. 2010b, ApJ, 21, 1233 [CrossRef] [Google Scholar]
- Iwasawa, K., Comastri, A. 1998, MNRAS, 297, 1219 [NASA ADS] [CrossRef] [Google Scholar]
- Kalberla, P. M. W., Burton, W. B., Hartmann, D. A., et al. 2005, A&A, 440, 775 [NASA ADS] [CrossRef] [EDP Sciences] [Google Scholar]
- Keel, W. C. 1990, AJ, 100, 356 [NASA ADS] [CrossRef] [Google Scholar]
- Komossa, S., Schulz, H., Greiner, J., et al. 1998, A&A, 334, 110 [NASA ADS] [Google Scholar]
- Komossa, S., Burwitz, V., Hasinger, G., et al. 2003, ApJ, 582, L15 [NASA ADS] [CrossRef] [Google Scholar]
- Lehmer, B. D., Alexander, D. M., Bauer, F. E., et al. 2010, ApJ, 724, 559 [NASA ADS] [CrossRef] [Google Scholar]
- Lira, P., Ward, M. J., Zezas, A., & Murray, S. S. 2002, MNRAS, 333, 709 [NASA ADS] [CrossRef] [Google Scholar]
- Lusso, E., Comastri, A., Vignali, C., et al. 2011, A&A, 534, A110 [NASA ADS] [CrossRef] [EDP Sciences] [Google Scholar]
- Lutz, D., Sturm, E., Genzel, R., et al. 2003, A&A, 409, 867 [Google Scholar]
- Magdziarz, P., & Zdziarski, A. A. 1995, MNRAS, 273, 837 [NASA ADS] [CrossRef] [Google Scholar]
- Marinucci, A., Bianchi, S., Matt, G., et al. 2016, MNRAS, 456, L94 [NASA ADS] [CrossRef] [Google Scholar]
- Masai, K. 1994, ApJ, 437, 770 [NASA ADS] [CrossRef] [Google Scholar]
- Medling, A. M., Ammons, S. M., Max, C. E., et al. 2011, ApJ, 743, 32 [NASA ADS] [CrossRef] [Google Scholar]
- Mori, T. I., Imanishi, M., Alonso-Herrero, A., et al. 2014, PASJ, 66, 93 [NASA ADS] [CrossRef] [Google Scholar]
- Morris, S. L., & Ward, M. J. 1988, MNRAS, 230, 639 [NASA ADS] [CrossRef] [Google Scholar]
- Murphy, K. D., & Yaqoob, T. 2009, MNRAS, 397, 1549 [NASA ADS] [CrossRef] [Google Scholar]
- Nardini, E., Risaliti, G., Watabe, Y., Salvati, M., & Sani, E. 2010, MNRAS, 405, 2505 [NASA ADS] [Google Scholar]
- Nardini, E., Wang, J., Fabbiano, G., et al. 2013, ApJ, 765, 141 [NASA ADS] [CrossRef] [Google Scholar]
- Netzer, H., Lemze, D., Kaspi, S., et al. 2005, ApJ, 629, 739 [NASA ADS] [CrossRef] [Google Scholar]
- Palmeri, P., Mendoza, C., Kallman, T. R., Bautista, M. A., & Meléndez, M. 2003, A&A, 410, 359 [NASA ADS] [CrossRef] [EDP Sciences] [Google Scholar]
- Planck Collaboration XVI. 2014, A&A, 571, A16 [NASA ADS] [CrossRef] [EDP Sciences] [Google Scholar]
- Puccetti, S., Fiore, F., Vignali, C., et al. 2009, ApJS, 185, 586 [NASA ADS] [CrossRef] [Google Scholar]
- Puccetti, S., Comastri, A., Fiore, F., et al. 2014, ApJ, 793, 26 [NASA ADS] [CrossRef] [Google Scholar]
- Ranalli, P., Comastri, A., & Setti, G. 2003, A&A, 399, 39 [NASA ADS] [CrossRef] [EDP Sciences] [Google Scholar]
- Rafanelli, P., Schulz, H., Barbieri, C., et al. 1997, A&A, 327, 901 [NASA ADS] [Google Scholar]
- Risaliti, G., Elvis, M., & Nicastro, F. 2002, ApJ, 571, 234 [NASA ADS] [CrossRef] [Google Scholar]
- Risaliti, G., Elvis, M., Fabbiano, G., Baldi, A., & Zezas, A. 2005, ApJ, 623, L93 [NASA ADS] [CrossRef] [Google Scholar]
- Risaliti, G., Sani, E., Maiolino, R., et al. 2006, ApJ, 637, L17 [NASA ADS] [CrossRef] [Google Scholar]
- Risaliti, G., Elvis, M., Fabbiano, G., et al. 2007, ApJ, 659, L111 [NASA ADS] [CrossRef] [Google Scholar]
- Risaliti, G., Young, M., & Elvis, M. 2009, ApJ, 700, L6 [NASA ADS] [CrossRef] [Google Scholar]
- Sanders, D. B., Mazzarella, J. M., Kim, D. C., et al. 2003, AJ, 126, 1607 [Google Scholar]
- Santini, P., Fontana, A., Grazian, A., et al. 2009, A&A, 504, 751 [NASA ADS] [CrossRef] [EDP Sciences] [Google Scholar]
- Schmitt, H. R., Bica, E., & Pastoriza, M. G. 1996, MNRAS, 278, 965 [NASA ADS] [Google Scholar]
- Scoville, N., Sheth, K., Walter, F., et al. 2015, ApJ, 800, 70 [NASA ADS] [CrossRef] [Google Scholar]
- Shemmer, O., Brandt, W. N., Netzer, H., Maiolino, R., & Kaspi, S. 2008, ApJ, 682, 81 [NASA ADS] [CrossRef] [Google Scholar]
- Shu, X. W., Yaqoob, T., & Wang, J. X. 2011, ApJ, 738, 147 [NASA ADS] [CrossRef] [Google Scholar]
- Simmons, B. D., Van Duyne, J., Urry, C. M., et al. 2011, ApJ, 734, 121 [NASA ADS] [CrossRef] [Google Scholar]
- Simmons, B. D., Urry, C. M., Schawinski, K., Cardamone, C., & Glikman, E. 2012, ApJ, 761, 75 [NASA ADS] [CrossRef] [Google Scholar]
- Soldi, S., Beckmann, V., Baumgartner, W. H., et al. 2014, A&A, 563, A57 [NASA ADS] [CrossRef] [EDP Sciences] [Google Scholar]
- Springel, V., White, S. D. M., Jenkins, A., et al. 2005, Nature, 435, 629 [NASA ADS] [CrossRef] [PubMed] [Google Scholar]
- Tacconi, L. J., Genzel, R., Tecza, M., et al. 1999, ApJ, 524, 732 [NASA ADS] [CrossRef] [Google Scholar]
- Takahashi, T., Mitsuda, K., Kelley, R., et al. 2014, SPIE, 9144, 24 [Google Scholar]
- Tecza, M., Genzel, R., Tacconi, L. J., et al. 2000, ApJ, 537, 178 [NASA ADS] [CrossRef] [Google Scholar]
- Tremaine, S., Gebhardt, K., Bender, R., et al. 2002, ApJ, 574, 740 [NASA ADS] [CrossRef] [Google Scholar]
- Vasudevan, R. V., Fabian, A. C., Gandhi, P., Winter, L. M., & Mushotzky, R. F. 2010, MNRAS, 402, 1081 [NASA ADS] [CrossRef] [Google Scholar]
- Vignati, P., Molendi, S., Matt, G., et al. 1999, A&A, 349, L57 [NASA ADS] [Google Scholar]
- Veilleux, S., Kim, D.-C., Sanders, D. B., Mazzarella, J. M., & Soifer, B. T. 1995, ApJS, 98, 171 [NASA ADS] [CrossRef] [Google Scholar]
- Veilleux, S., Rupke, D. S. N., Kim, D.-C., et al. 2009, ApJS, 182, 628 [NASA ADS] [CrossRef] [Google Scholar]
- Veilleux, S., Meléndez, M., Sturm, E., et al. 2013, ApJ, 776, 27 [NASA ADS] [CrossRef] [Google Scholar]
- Walton, D. J., Middleton, M. J., Rana, V., et al. 2015, ApJ, 806, 65 [NASA ADS] [CrossRef] [Google Scholar]
- Wang, J., Nardini, E., Fabbiano, G., et al. 2014, ApJ, 781, 55 [NASA ADS] [CrossRef] [Google Scholar]
- Wright, G. S., Joseph, R. D., & Meikle, W. P. S. 1984, Nature, 309, 430 [NASA ADS] [CrossRef] [Google Scholar]
- Yaqoob, T. 1997, ApJ, 479, 184 [NASA ADS] [CrossRef] [Google Scholar]
- Yaqoob, T., & Murphy, K. D. 2011, MNRAS, 412, 1765 [NASA ADS] [CrossRef] [Google Scholar]
- Yaqoob, T. 2012, MNRAS, 423, 3360 [NASA ADS] [CrossRef] [Google Scholar]
- Yun, M. S., & Carilli, C. L. 2002, ApJ, 568, 88 [NASA ADS] [CrossRef] [Google Scholar]
- Zasov, A. V., & Karachentsev, I. D. 1979, Sov. Astron. Lett., 5, 126 [NASA ADS] [Google Scholar]
All Tables
All Figures
|
Fig. 1 3−78.4 keV NuSTAR image for the FPMA module. The image was smoothed with a Gaussian filter with σ = 1.5 pixels ( |
| In the text | |
|
Fig. 2 Upper panel: 0.3−8 keV image mosaic of the 2001 and 2011 Chandra observations (see Table 2). The image was smoothed with a Gaussian filter with σ = 1.5 pixels (~ |
| In the text | |
|
Fig. 3 Chandra background-subtracted light curves in bins of 5500 s. From top to bottom: 0.3−8 keV count rates of the whole NGC 6240 galaxy, 0.3−8 keV count rates of the southern nucleus, 0.3−8 keV count rates of the northern nucleus, and 6.4−8 keV count rates of the northern nucleus. The dot-dashed lines correspond to the values of the count rate weighted means. Left panels: the light curves of the two ACIS-S Chandra observations (see Table 2): 1590 (magenta open dots) and 12713 (black solid dots). Right panels: the light curves of the zero-order ACIS-S HETG Chandra data: 6909 (blue solid squares) and 6908 (red open squares). We note that the X-axis does not represent the real time. |
| In the text | |
|
Fig. 4 Chandra spectra of the whole NGC 6240 galaxy, unfolded with the instrument response, extracted in the cyan region in the upper panel of Fig. 2. The colors represent the four observations (see Table 2). Since no significant spectral variability was present, we co-added the ACIS-S spectra. |
| In the text | |
|
Fig. 5 XMM-Newton spectra of the whole NGC 6240 galaxy, unfolded with the instrument response. The colors represent the EPIC-PN and co-added EPIC-MOS1 and EPIC-MOS2 spectra for all the observations (see Table 2). |
| In the text | |
|
Fig. 6 NuSTAR light curves in bins of 5800 s (~1 satellite orbit). The count rates are the added values detected by the FPMA and FPMB modules corrected for livetime, PSF losses, and vignetting, but not for background. The dotted lines correspond to the values of the count rate weighted means. The numbers in the lower left corner of each panel indicate the values of |
| In the text | |
|
Fig. 7 BeppoSAX 15−200 keV PDS light curve in bins of 10.5 ks. The dotted line corresponds to the value of the count rate weighted mean. The numbers at the top indicate the values of |
| In the text | |
|
Fig. 8 Broadband spectra of the whole NGC 6240 galaxy, best-fit model (upper panel), and residuals (lower panel). The NuSTAR (green is FPMA, red is FPMB), XMM-Newton (blue is PN, magenta is MOS1+MOS2), and Chandra (orange) spectra unfolded with the instrument responses (for single XMM-Newton and Chandra spectra see Figs. 5 and 4, respectively) are plotted in the upper panel. The total model A is superimposed. The model’s single continuum components are also shown: the primary continuum (black solid line); the reflection continuum (black dashed line); the FeKα, FeKβ, and nickel lines (black dotted lines); and the three thermal components (black dash-dotted lines). The lower panel shows the data/best-fit model ratios. |
| In the text | |
|
Fig. 9 Chandra 68%, 90%, and 99% confidence contours for the southern and northern nucleus: equatorial column density NH (in units of 1024 cm-2) versus θobs (i.e., inclination angle between the torus polar axis and the observer’s line of sight). The confidence contours are evaluated leaving NH, θobs, and the normalizations of the direct continuum free to vary. |
| In the text | |
|
Fig. 10 NuSTAR spectra unfolded with the instrument responses (green is FPMA, red is FPMB) superimposed with the best-fit thermal component of the whole galaxy (black long dash-dotted line, medium-temperature and shock components in model A: wabsmed×mekalmed + wabshot×pshockhot, see Sect. 4.2), and the Chandra best-fit mytorus model for the two nuclei (see Sect. 5). The blue lines indicate the primary continuum (solid line) and the reflection continuum and lines (dotted line) of the southern nucleus; the magenta lines are the primary continuum (solid line), the reflection continuum, and lines (dotted line) of the northern nucleus. In the lower panel the NuSTAR data/Chandra best-fit model ratios are shown. |
| In the text | |
Current usage metrics show cumulative count of Article Views (full-text article views including HTML views, PDF and ePub downloads, according to the available data) and Abstracts Views on Vision4Press platform.
Data correspond to usage on the plateform after 2015. The current usage metrics is available 48-96 hours after online publication and is updated daily on week days.
Initial download of the metrics may take a while.