Fig. 2
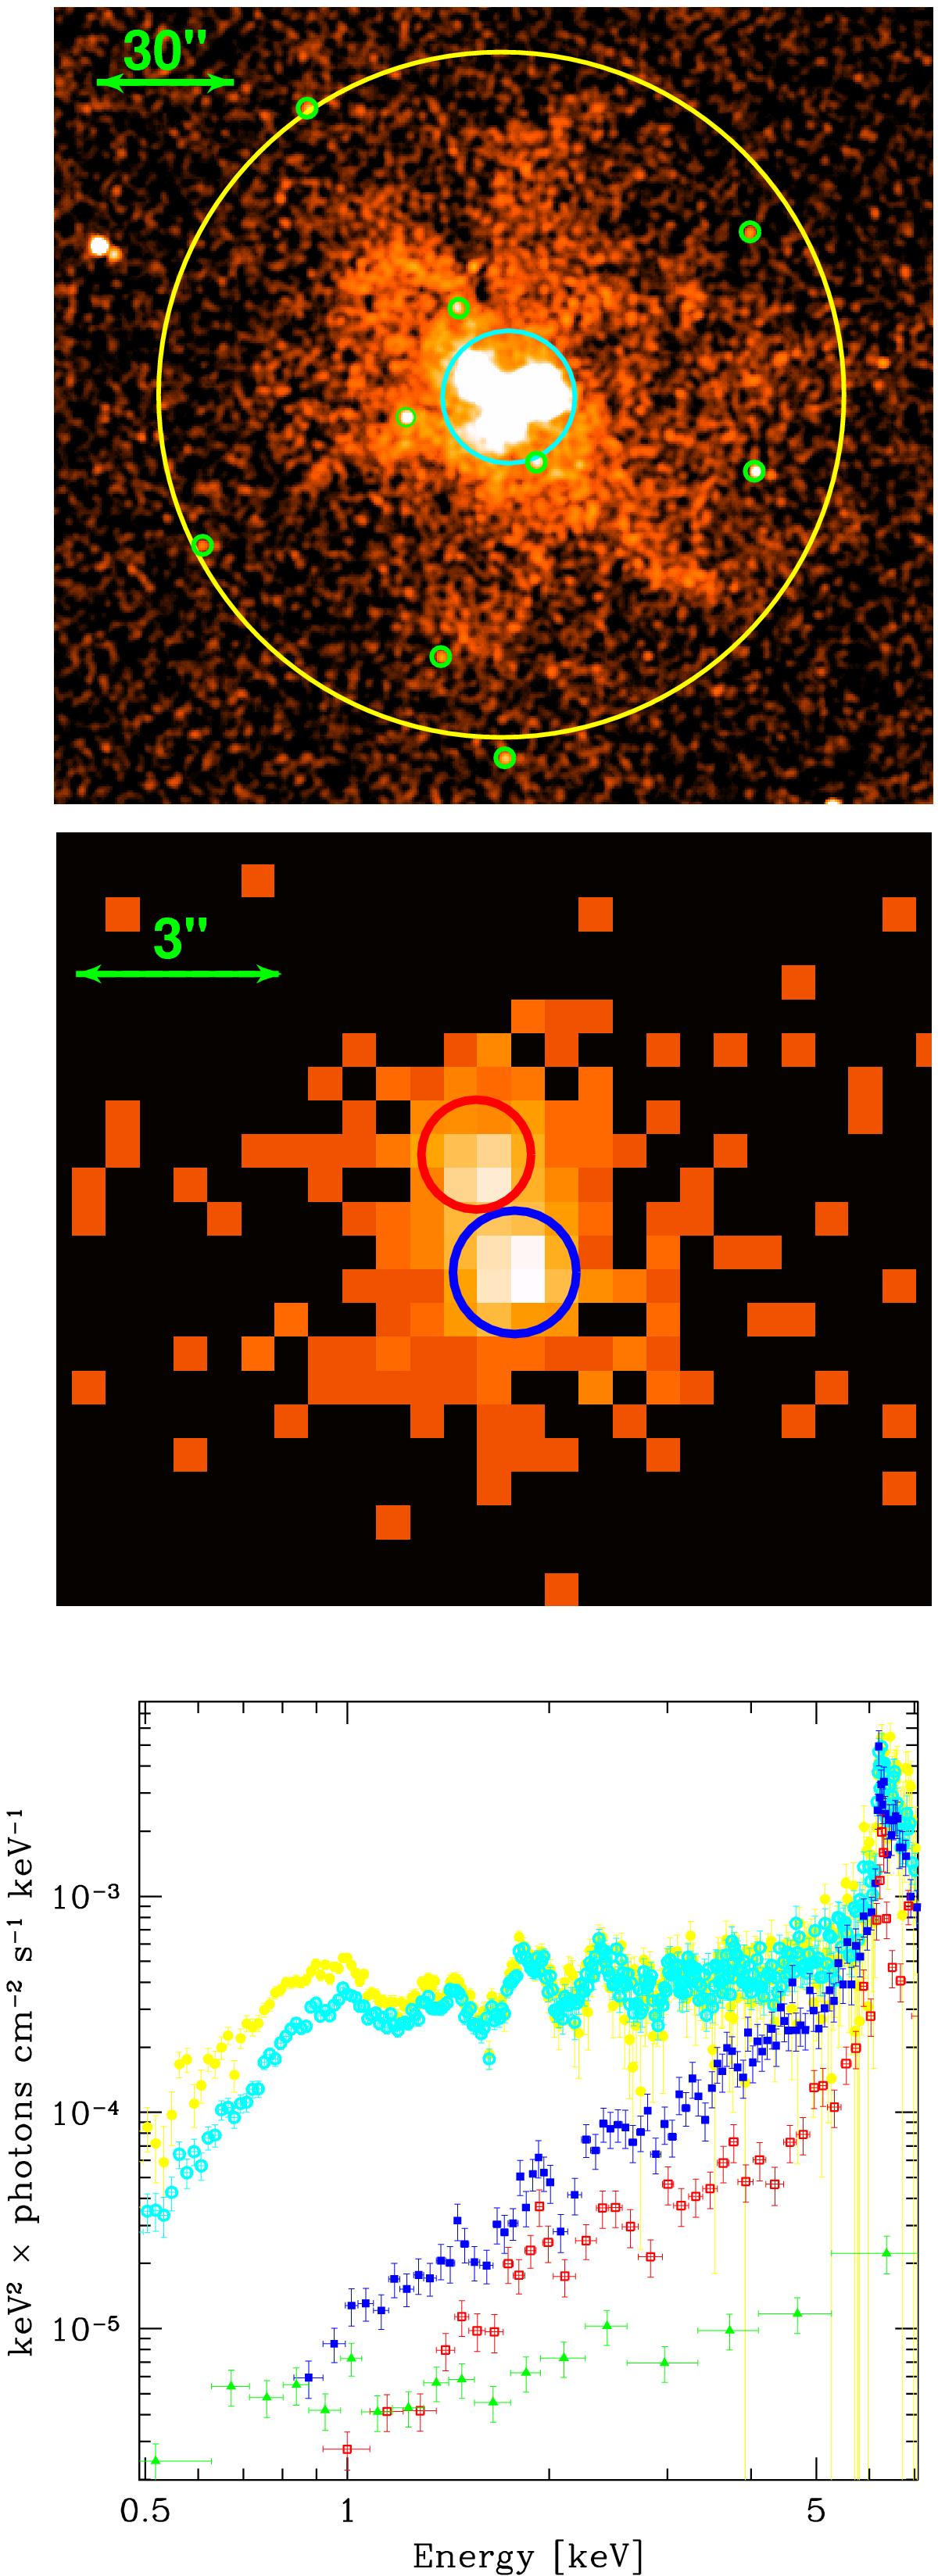
Upper panel: 0.3−8 keV image mosaic of the 2001 and 2011 Chandra observations (see Table 2). The image was smoothed with a Gaussian filter with σ = 1.5 pixels (~![]() ). The big yellow circle (75
). The big yellow circle (75![]() radius) marks the NuSTAR source extraction region; the cyan circle (14.̋5 radius) marks the Chandra source extraction region; the small green circles (2′′ radius) mark the nine serendipitous point sources with S/N ≥ 2 in the 0.3−8 keV band within/very near the area corresponding to the NuSTAR extraction region. Middle panel: 6−6.5 keV image mosaic of the two Chandra observations, zoomed into the center of the galaxy: the southern and northern nuclei are shown by blue and red circles, respectively. Lower panel: Chandra spectra unfolded with the instrument response of observation 12713 (see Table 2). The yellow, cyan, blue, and red spectra are extracted in the regions marked with the same color in the upper and middle panels. The green spectrum represents the contamination spectrum by the nearby bright sources detected in the NuSTAR source extraction region. This contamination is negligible in the NuSTAR extraction region, whose spectrum is shown in yellow.
radius) marks the NuSTAR source extraction region; the cyan circle (14.̋5 radius) marks the Chandra source extraction region; the small green circles (2′′ radius) mark the nine serendipitous point sources with S/N ≥ 2 in the 0.3−8 keV band within/very near the area corresponding to the NuSTAR extraction region. Middle panel: 6−6.5 keV image mosaic of the two Chandra observations, zoomed into the center of the galaxy: the southern and northern nuclei are shown by blue and red circles, respectively. Lower panel: Chandra spectra unfolded with the instrument response of observation 12713 (see Table 2). The yellow, cyan, blue, and red spectra are extracted in the regions marked with the same color in the upper and middle panels. The green spectrum represents the contamination spectrum by the nearby bright sources detected in the NuSTAR source extraction region. This contamination is negligible in the NuSTAR extraction region, whose spectrum is shown in yellow.
Current usage metrics show cumulative count of Article Views (full-text article views including HTML views, PDF and ePub downloads, according to the available data) and Abstracts Views on Vision4Press platform.
Data correspond to usage on the plateform after 2015. The current usage metrics is available 48-96 hours after online publication and is updated daily on week days.
Initial download of the metrics may take a while.