Fig. 8
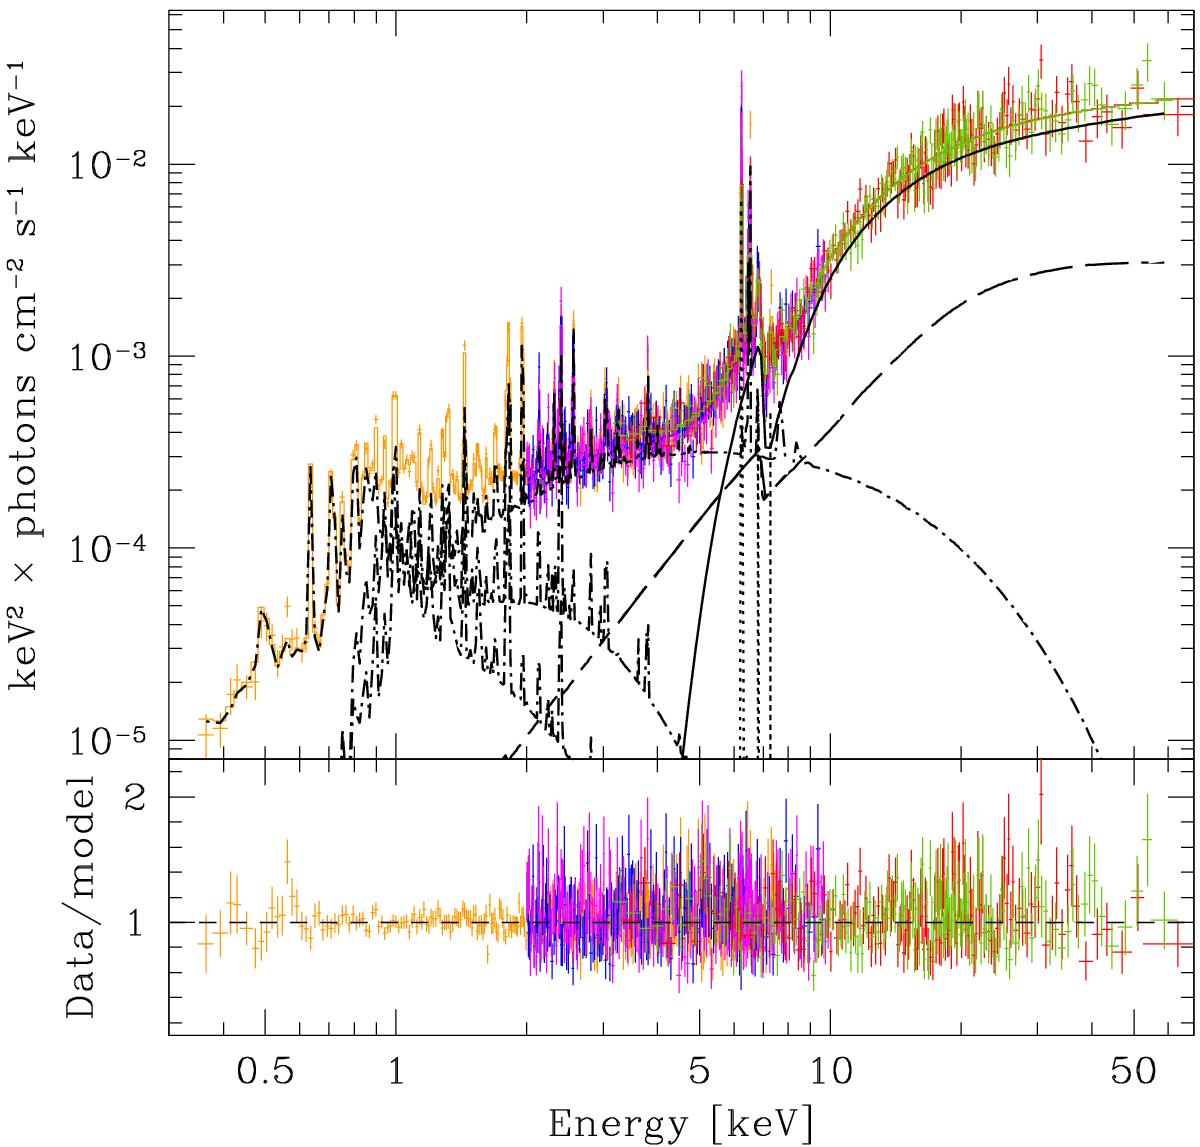
Broadband spectra of the whole NGC 6240 galaxy, best-fit model (upper panel), and residuals (lower panel). The NuSTAR (green is FPMA, red is FPMB), XMM-Newton (blue is PN, magenta is MOS1+MOS2), and Chandra (orange) spectra unfolded with the instrument responses (for single XMM-Newton and Chandra spectra see Figs. 5 and 4, respectively) are plotted in the upper panel. The total model A is superimposed. The model’s single continuum components are also shown: the primary continuum (black solid line); the reflection continuum (black dashed line); the FeKα, FeKβ, and nickel lines (black dotted lines); and the three thermal components (black dash-dotted lines). The lower panel shows the data/best-fit model ratios.
Current usage metrics show cumulative count of Article Views (full-text article views including HTML views, PDF and ePub downloads, according to the available data) and Abstracts Views on Vision4Press platform.
Data correspond to usage on the plateform after 2015. The current usage metrics is available 48-96 hours after online publication and is updated daily on week days.
Initial download of the metrics may take a while.