Fig. 6
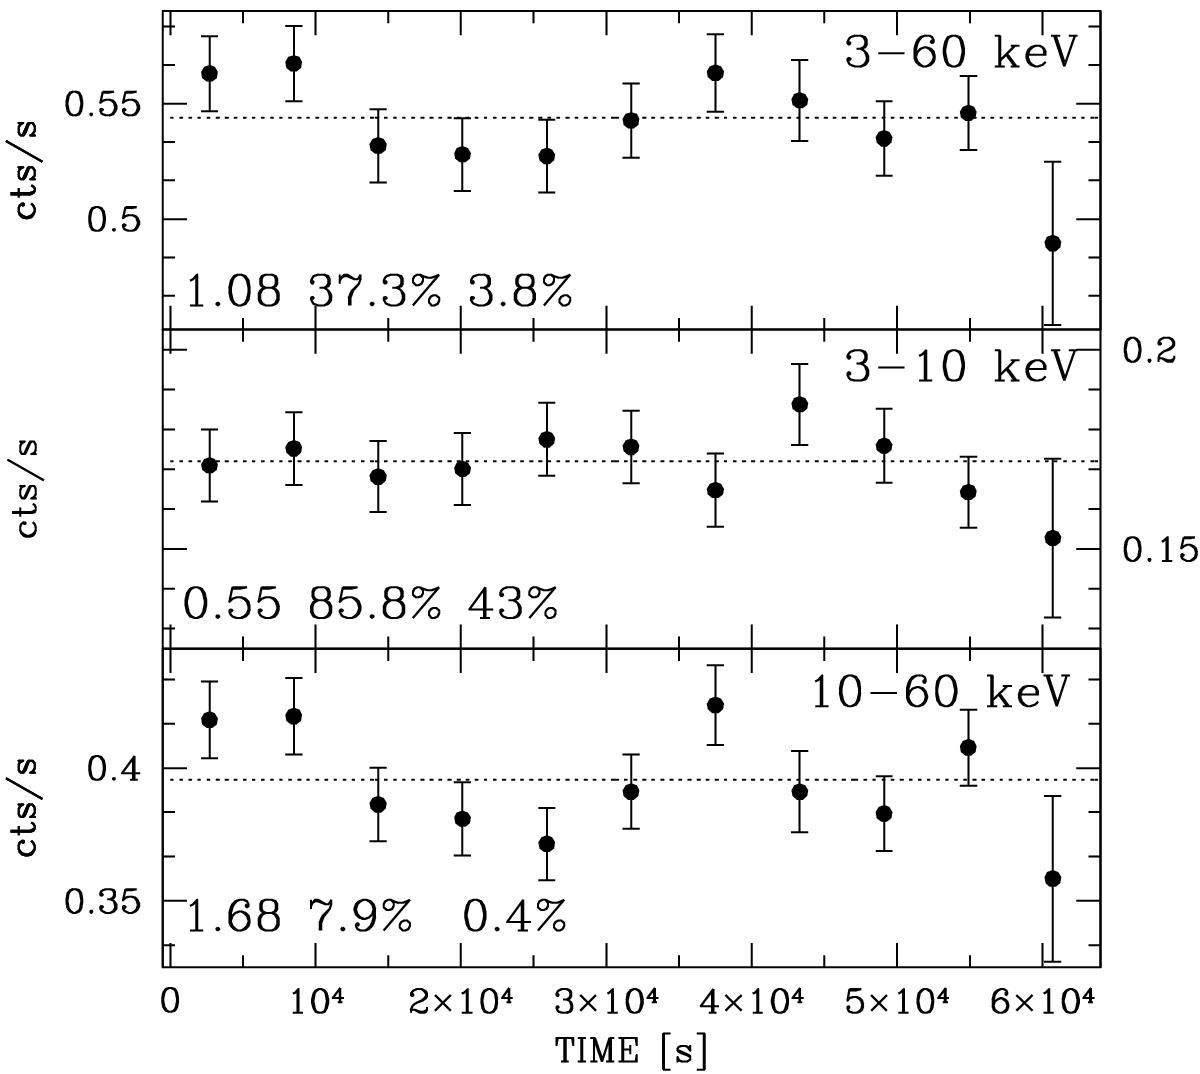
NuSTAR light curves in bins of 5800 s (~1 satellite orbit). The count rates are the added values detected by the FPMA and FPMB modules corrected for livetime, PSF losses, and vignetting, but not for background. The dotted lines correspond to the values of the count rate weighted means. The numbers in the lower left corner of each panel indicate the values of ![]() for 10 degrees of freedom, and the false positive χ2 and Kolmogorov-Smirnov probabilities in the constant light curve hypothesis. From top to bottom: 3−60, 3−10, and 10−60 keV count rates.
for 10 degrees of freedom, and the false positive χ2 and Kolmogorov-Smirnov probabilities in the constant light curve hypothesis. From top to bottom: 3−60, 3−10, and 10−60 keV count rates.
Current usage metrics show cumulative count of Article Views (full-text article views including HTML views, PDF and ePub downloads, according to the available data) and Abstracts Views on Vision4Press platform.
Data correspond to usage on the plateform after 2015. The current usage metrics is available 48-96 hours after online publication and is updated daily on week days.
Initial download of the metrics may take a while.