Fig. 3
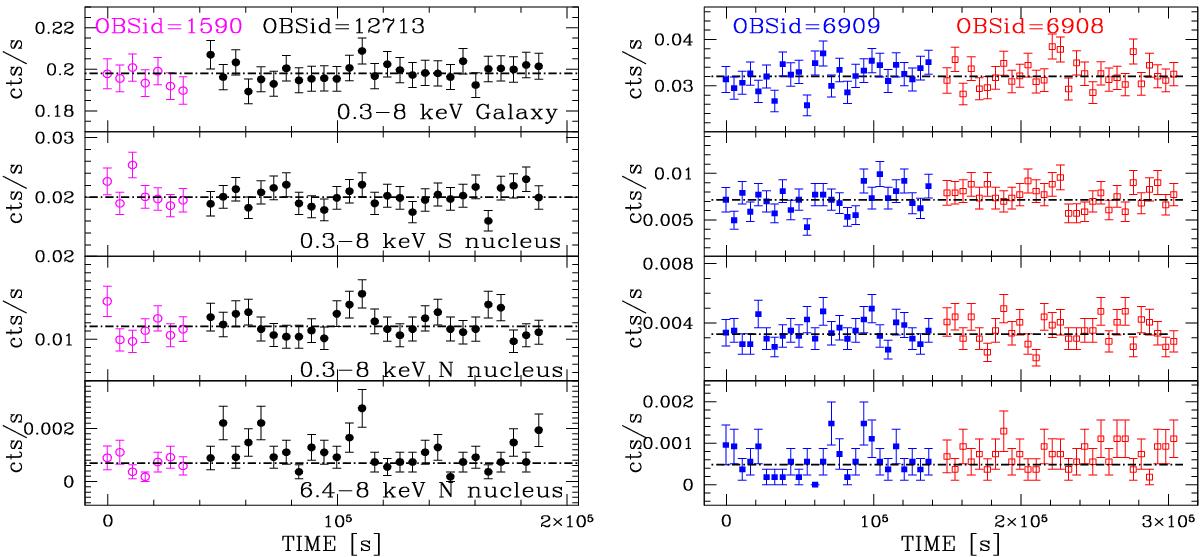
Chandra background-subtracted light curves in bins of 5500 s. From top to bottom: 0.3−8 keV count rates of the whole NGC 6240 galaxy, 0.3−8 keV count rates of the southern nucleus, 0.3−8 keV count rates of the northern nucleus, and 6.4−8 keV count rates of the northern nucleus. The dot-dashed lines correspond to the values of the count rate weighted means. Left panels: the light curves of the two ACIS-S Chandra observations (see Table 2): 1590 (magenta open dots) and 12713 (black solid dots). Right panels: the light curves of the zero-order ACIS-S HETG Chandra data: 6909 (blue solid squares) and 6908 (red open squares). We note that the X-axis does not represent the real time.
Current usage metrics show cumulative count of Article Views (full-text article views including HTML views, PDF and ePub downloads, according to the available data) and Abstracts Views on Vision4Press platform.
Data correspond to usage on the plateform after 2015. The current usage metrics is available 48-96 hours after online publication and is updated daily on week days.
Initial download of the metrics may take a while.