| Issue |
A&A
Volume 584, December 2015
|
|
|---|---|---|
| Article Number | A128 | |
| Number of page(s) | 15 | |
| Section | Galactic structure, stellar clusters and populations | |
| DOI | https://doi.org/10.1051/0004-6361/201527464 | |
| Published online | 07 December 2015 | |
An eclipsing double-line spectroscopic binary at the stellar/substellar boundary in the Upper Scorpius OB association⋆
1 Instituto de Astrofísica de Canarias (IAC), Calle Vía Láctea s/n, 38200 La Laguna, Tenerife, Spain
e-mail: This email address is being protected from spambots. You need JavaScript enabled to view it.
2 Departamento de Astrofísica, Universidad de La Laguna (ULL), 38206 La Laguna, Tenerife, Spain
3 Department of Astronomy, University of California, Berkeley, CA 94720, USA
4 National Astronomical Observatory of Japan, 2-21-1 Osawa, Mitaka, 181-8588 Tokyo, Japan
5 Astrobiology Center, National Institutes of Natural Sciences, 2-21-1 Osawa, Mitaka, 181-8588 Tokyo, Japan
6 SOKENDAI (The Graduate University for Advanced Studies), Shonan Village, Hayama, 240-0193 Kanagawa, Japan
7 Department of Earth and Planetary Science, The University of Tokyo, 7-3-1 Bunkyo-ku, 113-0033 Tokyo, Japan
8 Department of Earth and Planetary Sciences, Tokyo Institute of Technology, 2-12-1 Ookayama, Meguro-ku, 152-8551 Tokyo, Japan
Received: 28 September 2015
Accepted: 9 November 2015
Abstract
Aims. We aim at constraining evolutionary models at low mass and young ages by identifying interesting transiting system members of the nearest OB association to the Sun, Upper Scorpius (USco), which has been targeted by the Kepler mission.
Methods. We produced light curves for M-dwarf members of the USco region that has been surveyed during the second campaign of the Kepler K2 mission. We identified by eye a transiting system, USco J161630.68−251220.1 (=EPIC 203710387) with a combined spectral type of M5.25, whose photometric, astrometric, and spectroscopic properties makes it a member of USco. We conducted an extensive photometric and spectroscopic follow-up of this transiting system with a suite of telescopes and instruments to characterise the properties of each component of the system.
Results. We calculated a transit duration of about 2.42 h that occurs every 2.88 days with a slight difference in transit depth and phase between the two components. We estimated a mass ratio of 0.922 ± 0.015 from the semi-amplitudes of the radial velocity curves for each component. We derived masses of 0.091 ± 0.005M⊙ and 0.084 ± 0.004M⊙, radii of 0.388 ± 0.008R⊙ and 0.380 ± 0.008R⊙, luminosities of log (L/L⊙) = −2.020-0.121+0.099 dex and −2.032-0.121+0.099 dex, and effective temperatures of 2901-172+199 K and 2908-172+199 K for the primary and secondary, respectively.
Conclusions. We present a complete photometric and radial velocity characterisation of the least massive double-line eclipsing binary system in the young USco association with two components close to the stellar/substellar limit. This system falls in a gap between the least massive eclipsing binaries in the low-mass and substellar regimes at young ages and represents an important addition to constraining evolutionary models at young ages.
Key words: techniques: photometric / open clusters and associations: individual: Upper Scorpius OB association / techniques: spectroscopic / stars: low-mass
Based on observations made with telescopes (GTC, WHT) installed in the Spanish Observatorio del Roque de los Muchachos of the Instituto de Astrofísica de Canarias, in the island of La Palma.
NASA Sagan Fellow.
© ESO, 2015
1. Introduction
The mass of a star determines its fate. Thus, measuring masses of stars with high precision is of paramount importance to understand the evolution of stars at any mass and age. The precise determination of the mass and radius of the component of multiple systems allows constraining input parameters of evolutionary models (D’Antona & Mazzitelli 1994; Palla & Stahler 1993; Baraffe et al. 1998; Chabrier et al. 2000; Siess et al. 2000; Dotter et al. 2008; Tognelli et al. 2011; Bressan et al. 2012; Feiden & Chaboyer 2012) and distinguishing between the various models of star formation (e.g. Klessen 2001; Reipurth & Clarke 2001; Padoan & Nordlund 2002; Whitworth & Zinnecker 2004; Bate 2009; Stamatellos & Whitworth 2009). Low-mass eclipsing binaries represent an excellent test-bed for these models because masses and radii can both be measured with high precisions (Torres et al. 2010).
The advent of ground-based transiting surveys (e.g. HAT-Net, SuperWASP; Bakos et al. 2002, 2004; Pollacco et al. 2006) and space missions such as Corot (Barge et al. 2006) and Kepler (Borucki et al. 2010; Lissauer et al. 2014; Batalha 2014) revealed a significant number of low-mass stars and brown dwarfs eclipsing solar-type stars (Deleuil et al. 2008; Bakos et al. 2009; Irwin et al. 2010; Siverd et al. 2012; Steffen et al. 2012; Mamajek et al. 2012; Kenworthy et al. 2015) or giants (Bouchy et al. 2011; Mitchell et al. 2003; Liu et al. 2008). Of these, only a few brown dwarfs have accurate mass and radius measurements: Corot-3 b (Deleuil et al. 2008), KELT-1 b (Siverd et al. 2012), and Kepler-39 b (Bouchy et al. 2011). Additional mass measurements of brown dwarfs are available from microlensing events (OGLE-2013-BLG-0102L b; Jung et al. 2015) and dynamical orbits (Dupuy et al. 2009a,b, 2010, 2014, 2015; Konopacky et al. 2010).
The number of young low-mass eclipsing systems is even more scarce, most of them are identified in the Orion star-forming region (Irwin et al. 2007; Cargile et al. 2008; Morales-Calderón et al. 2012; Gómez Maqueo Chew et al. 2012), 25 Ori (van Eyken et al. 2011) and in the 3 Myr old cluster NGC 2264 with Corot (Gillen et al. 2014). Recently, Kraus et al. (2015) announced the first spectroscopic binary member of Upper Scorpius (UScoCTIO 5) with masses (0.317–0.329 M⊙) and radii (0.810–0.834 R⊙) for two M4.5 dwarfs; this system was originally classified as a M4 by Ardila et al. (2000). These are the first systems determined independently from evolutionary models at such low masses in this association. Only one eclipsing binary with two brown dwarfs has been announced as a member of the Orion star-forming region (Stassun et al. 2006) with a surprising temperature reversal (Stassun et al. 2007).
Kepler is a 0.95 m satellite launched in March 2009 to search for extrasolar planets in a large field of ~100 deg2 towards the constellations of Cygnus, Lyra, and Draco. The main goal of the mission was to explore the structure and diversity of planetary systems through the transit method with unprecedented photometric precision that is only achievable from space. The Kepler mission was very successful (Borucki et al. 2010) and was extended by NASA despite the loss of reaction wheels. A K2 “Second Light” mission started and is sub-divided into individual campaigns. The second campaign specifically included most of the known USco members (Luhman & Mamajek 2012).
The USco region is part of the nearest OB association to the Sun, Scorpius Centaurus, located at 145 pc from the Sun (de Bruijne et al. 1997). Its age lies in the range of 5 to 10 Myr (Song et al. 2012): earlier studies using isochrone fitting and dynamical studies derived an age of 5 ± 2 Myr (Preibisch & Zinnecker 2002) in agreement with deep surveys (Slesnick et al. 2006; Lodieu et al. 2008), but this was recently challenged by Pecaut et al. (2012), who quoted 11 ± 2 Myr from a spectroscopic study of F stars at optical wavelengths. The association has been targeted at multiple wavelengths, beginning in X rays (Walter et al. 1994; Kunkel 1999; Preibisch et al. 1998), but it was also examined astrometrically with Hipparcos (de Bruijne et al. 1997; de Zeeuw et al. 1999), and more recently in the optical (Preibisch et al. 2001; Preibisch & Zinnecker 2002; Ardila et al. 2000; Martín et al. 2004; Slesnick et al. 2006) and in the near–infrared (Lodieu et al. 2006, 2007, 2011; Dawson et al. 2013; Lodieu 2013; Dawson et al. 2011). Tens of brown dwarfs have now been confirmed spectroscopically as USco members (Martín et al. 2004, 2010; Slesnick et al. 2006, 2008; Lodieu et al. 2006, 2008, 2011; Dawson et al. 2011), and the mass function was determined for high-mass stars (Preibisch et al. 2002) as well as for low-mass stars and brown dwarfs (Slesnick et al. 2008; Lodieu et al. 2011). The coolest member candidates so far may be late-L or T-type dwarfs (Lodieu et al. 2013).
In this paper, we describe our analysis of the K2 light curves obtained in the USco region and present the discovery of a new eclipsing binary, USco J161630.68−251220.1 (hereafter USco16m25) with two components at the stellar/substellar limit. In Sect. 2 we describe the generation of light curves to search for transiting systems. In Sect. 3 we present additional transits at optical wavelengths to confirm the eclipsing nature of the USco16m25 system. In Sect. 4 we present optical spectroscopy of the system, which we classify as an M5.25 dwarf. We also used intermediate-resolution spectroscopy to measure the radial velocities and constrain the mass and radii of each component of the eclipsing system. In Sect. 5 we characterise the physical parameters of the two components of USco16m25 (masses, radii, effective temperature, and age) and place our results in context with other low-mass and brown dwarf members of eclipsing systems.
2. Identification of the transiting system
2.1. Extraction of K2 light curves
The second K2 campaign focused on a large region of the USco association. The K2 observations lasted 76.19 days, starting on 26 August 2014 at UT ~ 05h10m and ending on 10 November 2014 at UT ~ 09h44m. One photometric point was obtained every 30 min, that is, with the low cadence of K2.
We generated the photometric light curves from the K2 observations for a large number of USco members proposed by independent groups using our own tools. We retrieved the images obtained with the Kepler telescope via MAST public archive on 2015 March 20. As described in detail in Sanchis-Ojeda et al. (2015), we first obtained the centroids of the images and used them to identify images taken while the telescope was re-oriented, also known as thruster events (Howell et al. 2014; Vanderburg & Johnson 2014). After removing these images, we sliced the data into ten temporal segments, chosen to have a length of approximately one week and to start (end) right after (before) a thurster event. We defined an aperture at each segment with all the pixels that had 4% more counts than the mean background on at least 50% of the images of that segment. After subtracting the background, we generated a raw photometric light curve with a simple sum of the counts of each pixel. We removed systematic effects and long-term trends using fourth-order polynomials that have the centroid displacement and the time as variables. For more details on how this full process work, we refer to Sanchis-Ojeda et al. (2015). Scrolling through the light curves by eye, two targets caught our attention: HD 144548 (Alonso et al. 2015) and EPIC 203710387 (=USco16m25), which is the focus of this paper. Its full light curve is displayed in Fig. 1.
However, it is worth noting that studying stellar activity using the Kepler telescope is a complicated task. The Kepler photometric pipeline did not incorporate a good description of long-term systematics until a few years after the start of the mission (Smith et al. 2012; Stumpe et al. 2012) Our algorithm has preserved all the original long-term variations found in the raw photometry, but they could be a combination of astrophysical and unquantified systematic variations. However, the lack of a prevalence of periodic variations at a period of 2.6 days among the rest of the K2 targets in field 2 makes us confident that our signal is mostly dominated by stellar activity.
2.2. Preparation of K2 light curve
The K2 light curve of USco16m25 shows eclipses with depths of about 8% every 2.81 days, and out of eclipse photometric modulations with peak-to-peak amplitudes of up to 4%. To prepare the eclipses for the further studies described in this work, we attempted to minimise the effect of these modulations by normalising each individual eclipse using a parabolic fit to the regions adjacent to the eclipse, as described in Alonso et al. (2008). Using our first estimate of the ephemerides of the eclipse, we removed the regions with eclipses and interpolated them to a regular grid of time points to compute the autocorrelation of the out-of-eclipse data. This is plotted in Fig. 2, where the first maximum appears at a period close, but not equal to, the orbital period (2.6 d vs. 2.8 d). We attribute this modulation to stellar activity or clouds, in one or both components of the eclipsing binary. We also searched for effects at the orbital period (or its harmonics) of the eclipsing binary. These could be due to elliptical modulations caused by tidal deformations of the stars, mutual reflection effects, Doppler beaming, or a combination of all. The light curve phased at the orbital period shows no sign of any of these effects with an amplitude larger than ~0.2% (Fig. 3). We should also point out that we did not model the spots at the surface of the stars, an effect that can lead to unremoved systematics in the radial velocities and transit depth.
We derived the following ephemerides for the primary and secondary from the K2 light curves (the final adopted ephemerides are discussed in Sect. 5.3):
-
Primary (BJD) =2 456 897.5228 + 2.80882 × E
-
Secondary (BJD) = 2 456 896.1131 + 2.80882 × E,
where E stands for the number of eclipse.
Based on the ephemerides derived from the K2 light curve (Sect. 2.2), we undertook a large program of photometric and spectroscopic follow-up with a wide battery of telescopes and instruments to confirm the nature of the transit and constrain the physical parameters of the system.
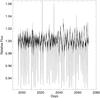 |
Fig. 1 Kepler light curve for USc16m25 over the full ~76 days of the second K2 campaign in Upper Scorpius. |
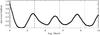 |
Fig. 2 Autocorrelation of the K2 light curve of USco16m25. The vertical dashed lines represent multiples of the period of the system. |
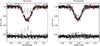 |
Fig. 3 K2 light curves folded in phase and normalised to unity for the primary (left) and the secondary (right) component of USco16m25. The circles at the bottom of the plots represent the residuals between the fit (red line) and the observed transits (black circles with error bars). The error bars were estimated from the out-of-eclipse dispersion of the K2 curve, as 0.37%. The primary eclipse curve shows a few outliers during the eclipse phases; we increased the error bars of these data points (four) by an extra factor of 4 to reduce their effect on the final determined parameters. The red line corresponds to the best-fit model to the global set of data (light curves, photometric transits, and radial velocities). |
3. Photometric follow-up with IAC80/CAMELOT
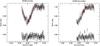 |
Fig. 4 Two additional transits with different levels of completeness for USco16m25. We observed the system on the night of 18 May and 11 June 2015 in the SDSSi filter with IAC80/CAMELOT. The red line corresponds to the best-fit model to the global set of data (light curves, photometric transits, and radial velocities). |
We attempted to observe several ground-based transits of USco16m25 with the CAMELOT instrument (acronym for “CAmara MEjorada LIgera del Observatorio del Teide” in Spanish) mounted on the 80 cm telescope IAC80 located at the Observatorio del Teide on the island of Tenerife in the Canary Islands (Spain).
CAMELOT is a e2v 2048 × 2048 back-illuminated charge-coupled device, providing a field of view of 10.4 × 10.4 arcmin with a pixel scale of 0.304 arcsec. We used a read-out speed of 200 kHz, resulting in a read-out duration of 21.5 s.
The presence of “calima” (sand from the Sahara) prevented observations on our first attempt on 11 May. However, we had two successful runs on the nights of 18 May and 11 June 2015, as described below. On the night of 18 May 2015, we obtained 91 frames with an on-source exposure time of 120 s, from UT = 00:24 until UT = 04:03. The average seeing, as measured from the frames, was 0.7 arcsec. These observations covered a partial primary eclipse event. On the night of 11 June 2015, a secondary eclipse was partially observed, with 70 frames collected between UT = 21h58m and UT = 00h46m, with a mean seeing of 0.9 arcsec. After standard calibrations of the frames (removal of flat and bias contributions), we performed simple aperture photometry on USco16m25 and eight stars in the field of view. We used an aperture radius of 16 pixels. We selected the best four and five stars for the first and second night, respectively, to produce an average reference star and obtain the final light curves plotted in Fig. 4.
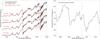 |
Fig. 5 Left: optical spectra of USco16m25 (black) obtained with the R1000R grating on GTC/OSIRIS. Overplotted in red are USco spectral template of spectral type M5, M5.25, and M5.5 kindly provided by Kevin Luhman. The top spectrum represents a combination of the normalised spectra of an M5 and an M6 member of USco. Right: zoom-in on the lithium absorption line at 6707.8 Å (marked with a vertical dashed red line) of USco16m25 (black) obtained with the R2500R grating on GTC/OSIRIS. |
4. Spectroscopic follow-up
4.1. Long-slit spectroscopy
4.1.1. GTC/OSIRIS optical spectra
We obtained low-resolution optical spectroscopy with the Optical System for Imaging and low-intermediate Resolution Integrated Spectroscopy (OSIRIS; Cepa et al. 2000) mounted on the 10.4 m GTC telescope in La Palma. We observed the target on 20 May 2015 (UT = 01h56m) in service mode as part of a filler program GTC38-15A (PI Lodieu). The system was in phase 0.725, so we decided to re-observe it with the grating R1000R in phase 0 when the light from the secondary is mostly blocked (2 August 2015 at UT = 21h20m) and at phase 0.5 when the light of the primary is blocked (9 August 2015 at UT = 21h45m) to compare the combined spectra and the contribution from each component because eclipses are not total (i.e. grazing). Unfortunately, bad weather in La Palma on 9 August 2015 did not allow us to fully characterise the degree of light from the secondary in the optical spectrum. No other attempt was made after that date because USco was too low for observations in this configuration from La Palma.
OSIRIS is equipped with two 2048 × 4096 Marconi CCD42-82 detectors offering a field of view of approximately 7 × 7 arcmin with a binned pixel scale of 0.25 arcsec. USco16m25 was observed between UT = 01h55m and UT = 02h35m when USco was the highest in the Canarian sky, under dark conditions and a seeing of ~1.6 arcsec. We used a slit of 1.0 arcsec. We obtained a single exposure of 600 s with the R1000R grating (510–1000 nm) and three exposures of 300 s shifted along the slit with the R2500R grating (557.5–768.5 nm). Bias frames, dome flat fields, as well as neon, xenon, and HgAr arc lamps were observed by the observatory staff during the afternoon.
We reduced the OSIRIS optical spectrum under the IRAF environment (Tody 1986, 1993)1. We subtracted the raw spectrum by a median-combined bias and divided by a normalised median-combined dome flat field taken during the afternoon. We extracted optimally a 1D spectrum from the 2D image and calibrated that spectrum in wavelength with the lines from the combined arc lamp. We corrected our spectra for instrumental response with the Ross 640 spectro-photometric standard (DZ5; Monet et al. 2003; Lépine & Shara 2005; Sion et al. 2009). For the R1000R grating we created a response function corrected for the second-order contamination beyond ~9200 Å by joining the response of the detector from the observations of the standard star with the R1000R grating and the same grating in combination with the Sloan z broad-band filter. The final GTC/OSIRIS spectrum of USco J16163068−2512201, normalised at 750 nm, is displayed in the left-hand side panel in Fig. 5 along with known USco members.
4.1.2. Subaru/FOCAS optical spectra
We obtained low-resolution optical spectra with the Faint Object Camera and Spectrograph (FOCAS; Kashikawa et al. 2002) instrument mounted on the 8.2 m Subaru telescope in Hawaii. We observed USco16m25 on 19 June 2015 (corresponding to a phase of ~0.13) during free times of the Subaru telescope normal program (PI: Y. Kawashima).
FOCAS is equipped with two 2048 × 4096 CCD detectors offering a circular field of view of 6 arcmin in diameter with the pixel scale of 0.1 arcsec. We observed USco16m25 between UT = 07h20m and UT = 08h24m when Upper Scorpius was high in the Hawaiian sky, under dark conditions but persistent cirrus with a seeing of ~1.5 arcsec. We used a long slit with a slit width of 0.4 arcsec. We obtained ten exposures of 600 s with the 300B grating and the SY47 filter, providing the spectral resolution of R ~ 1000 over the 470–910 nm wavelength coverage.
The spectra were de-biased, flat-fielded, traced, sky-subtracted, and extracted with standard IRAF procedures. Wavelength calibration was made using Th-Ar lines. Sensitivity calibration was not applied because of a lack of photometric standard observation on that night and large differences of sky conditions for photometric standard data taken on other nights. We note that the absence of sensitivity calibration has less impact on overall results of this paper, and the spectra taken with Subaru/FOCAS match those obtained with GTC/OSIRIS well (Fig. 6). The similarity between the FOCAS and OSIRIS spectra also demonstrates that the contribution of the light from the secondary is extremely small up to 850 nm or that both objects have very similar spectra energy distribution at these wavelengths. This is consistent with the similarity observed between the GTC spectra taken at phase 0 and phase 0.725.
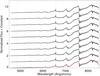 |
Fig. 6 Optical spectra of USco16m25 (black) obtained with Subaru/FOCAS at a resolution of 1000. The spectra were obtained on 19 June 2015 between UT = 07h and UT = 08h24m. Overplotted in red on the bottom spectrum is the GTC/OSIRIS spectrum obtained on 2 August 2015 at a similar resolution (see left-hand side panel of Fig. 5). The red dotted vertical lines mark the positions of Hβ and Hα lines at 4861 Å and 6563 Å, respectively. |
4.2. Radial velocity measurements with WHT/ISIS
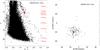 |
Fig. 7 Left: (Z−J, Z) colour–magnitude diagram for 6.5 deg2 in the central region of USco (Lodieu et al. 2007). The USco cluster sequence is well separated from field stars. Right: vector point diagram. We averaged the values of the proper motion in each direction from the datasets listed in Table 1, where the error bars represent the dispersion between each catalogue. The mean proper motion of the association is (μαcosδ,μδ) ~ (−11, −25) mas/yr. Our transiting system is highlighted with a large red dot, demonstrating its photometric and astrometric membership. |
We obtained several sets of optical spectra with the Intermediate dispersion Spectrograph and Imaging System (ISIS) instrument on the Cassegrain focus of the 4.2 m William Herschel Telescope (WHT) over the course of several nights (Table 2).
ISIS is a double-armed medium-resolution spectrograph equipped with a dichroic to spread the light in a blue and red arm. We are mainly interested in the red arm for our purposes because the target is a mid-M dwarf with little flux short wards of 500 nm. We used the same grating R1200R and the 1.2 arcsec slit covering the ~745–845 nm wavelength range at a spectral resolution of approximately 6000. All spectra were taken at parallactic angle. Arc lamps of CuAr+CuNe were observed immediately after the target, while bias and flat-field frames were obtained during the afternoon preceding both nights. We used different grating in the blue arm (R600B, R1200B, and R300B) during the first three sets of observations, confirming the low level of flux and lack of strong emission.
On the night of 2 June 2015 we took four spectra of USco16m25 as part of service program number SW2015a31 (PI Lodieu). We also obtained six spectra of the radial velocity (RV) standard star HD 164922 (G9V; I = 6.1 mag; RV = 20.29 ± 0.09 km s-1; Nidever et al. 2002; Gray et al. 2003; van Leeuwen 2007). This night was clear with variable seeing, but the moon was located at 13–14 degrees from the target, resulting in one of the lowest quality spectra of all that were obtained with ISIS. We obtained another five spectra of USco16m25 on the night of 8 June 2015 as part of a DDT program to continue our RV follow-up of the system. The moon rose up at UT = 1h with an illumination of 56% and was 94 degrees away from USco. We also observed the telluric standard HIP 77859 (B2V; V = 5.4 mag; RV = −9.20 ± 3.1 km s-1; Houk & Smith-Moore 1988; Gontcharov 2006; van Leeuwen 2007) and Barnard’s star as a RV standard because its spectral type is comparable to that of our target (M4; I = 6.74; RV = −110.5 ± 0.1 km s-1; Nidever et al. 2002; Gizis 1997; van Leeuwen 2007; Koen et al. 2010). This night was affected by thin cirrus, but the seeing was sub-arcsec at zenith. From this night on, we also observed the telluric standard HIP 77859 and Barnard’s star as a RV standard using the same configuration. We obtained another spectrum of the system on 17 June thanks to the collaboration with the team leading the ITP program ITP13-8 (PI Rubiño-Martin). This night was clear with seeing below 0.8 arcsec, although most of the observations were obtained during twilight. We collected three additional points for our target with the same configuration and same standard stars on 12, 13, and 14 July 2015 under variable conditions mainly affected by dust from the Sahara. The log of all WHT/ISIS observations is provided in Table 2.
We reduced the ISIS optical spectra under IRAF. We subtracted each raw spectrum by a median-combined bias and divided by a normalised median-combined dome flat field taken during the afternoon. We extracted optimally the spectrum and calibrated it in wavelength with the lines from the CuAr+CuNe arc lamps. We did not apply any flux calibration since we are only interested in the RV. We corrected the spectra for telluric lines with the telluric standard star HIP 77859 for all nights, except for the data taken on 2 June, where no telluric standard was observed. Hence, we corrected for telluric lines with the standard observed on 7 July at a similar airmass, but we can see that the correction is the poorest of all. Nonetheless, we can resolve each line of the sodium doublet, showing that our target is indeed a spectroscopic binary (Fig. 8). The sequence of ISIS spectra of USco16m25 is shown in Fig. 8.
Coordinates, photometry, and proper motion (mas/yr) of the K2 transiting system quoted in Simbad as USco J161630.68−251220.1 (= EPIC 203710387).
5. Characterisation of the transiting system
5.1. Membership to USco
The system is a photometric and astrometric member of the USco association (Fig. 7). Its position in the (Z−J, Z) colour–magnitude diagram shows that it lies on the USco sequence determined from the dataset of the UKIRT Infrared Deep Sky Survey (UKIDSS; Lawrence et al. 2007) Galactic Clusters Survey (Lodieu et al. 2006, 2007; Lodieu 2013). Its J-band magnitude is consistent with the spread of measurements for M5–M5.5 USco members (e.g. Slesnick et al. 2008; Lodieu et al. 2011). USco16m25 also matches the position of known USco members in the vector point diagram displayed on the right-hand side of Fig. 7 (see magnitude and proper motions reported in Table 1).
We obtained a low-resolution spectrum of the system at phase 0 with GTC/OSIRIS (Sect. 4.1.1), classified as an M5 dwarf by Luhman & Mamajek (2012). We compared our spectrum to known USco members2 and classified USco16m25 as M5.25 ± 0.25 from the spectral region in the 550–850 nm interval, in close agreement with the determination by Luhman & Mamajek (2012). This suggests that the object lies at the stellar/substellar boundary that is set to M6.5 dwarfs based on models (Luhman 1999). According to the scale of effective temperatures for young pre-main sequence dwarfs (Luhman 1999), USco16m25 would have a temperature of approximately 3100 ± 50 K (see also Luhman et al. 2003; Rice et al. 2010; Lodieu et al. 2011). We also compared our spectrum with field dwarfs of similar spectral types from the Sloan database (Bochanski et al. 2007) and found worse matches than the one for members of η Cha over the 6000–9000 Å wavelength region.
Logs of WHT/ISIS spectroscopic observations for the target, the telluric standard star HIP 77859, and the RV templates HD 164922 and GJ 699 (= Barnard’s star).
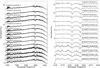 |
Fig. 8 Sequence of optical spectra of USco16m25 taken with WHT/ISIS over the course of 1.5 month, between 2 June and 14 July 2015. The wavelength range spans 745–845 nm at a spectral resolution of ~6000 (left plot), which includes the gravity-sensitive sodium (818.3/819.5 nm; right-hand side plot) doublets at 818.3/819.5 nm. |
We also measured the Hα equivalent widths in each individual spectrum, yielding values of between 6.2 and 6.7 Å over the course of 30 min. Assuming a mean value of 6.5/2 = 3.25 Å for the equivalent width of Hα of each component and applying equations of Stassun et al. (2012), chromospheric activity would imply a correction of 10.7 ± 5.8% in the radius (inflation) and −5.0 ± 2.3% in the effective temperature (suppression). A correction for an inflated radius for direct comparison with non-active models would imply an older age for the system and the USco association, but we note that we did not apply this correction to our final results described in Sect. 5.3.
We also investigated the strength of the gravity-sensitive sodium doublet at 8183/8195 Å in the lowest resolution spectrum, implying pseudo-equivalent widths of 1.7/2.1 Å for each component of the doublet. These values agree with the mean values of M5 dwarf members in USco (Fig. 4 of Lodieu et al. 2011). The presence of Hα in emission and the weak sodium doublet confirm that the system is young and that the K2 light curve is really associated to the binary system.
In the highest resolution spectrum, we resolved the lithium absorption line at 6707.8 Å into two components because the target was observed at a phase of 0.725. We measured pseudo-equivalent widths for the lithium line of 0.19 ± 0.1 and 0.29 ± 0.1 Å for the primary and the secondary, respectively (right-hand side panel in Fig. 5). The individual values, which should be corrected for the dilution factor, agree with the pseudo-equivalent widths reported by Kraus et al. (2015) for the M4.5 eclipsing binary and earlier studies of the USco population (Preibisch et al. 2001, 2002; Lodieu et al. 2011; Rizzuto et al. 2015), adding further credit to the membership of USco16m25. Our measurements of the lithium pseudo-equivalent width of the secondary translate into an abundance of log N(Li) = 3.1 ± 0.3 (in the usual scale of log N(H) = 12), consistent with no depletion (see Fig. 16 of Zapatero Osorio et al. 2002). For the primary, we would infer an abundance of log N(Li) = 2.0 ± 0.4, which suggests that some lithium destruction may have taken place in this slightly more massive object. While the absolute error bars on the equivalent widths consistent with other M dwarfs in USco prevent us from reaching any strong conclusion, it is worth mentioning that the differential error in the measurement is smaller, and this result could be taken as an indication that in the primary star, presumably a fully convective object, the core temperature has already reached the temperature needed to ignite lithium burning via 7 Li + p → α (T ~ 2.5 × 10⁶ K), while in the secondary this is not the case yet. We note that interior evolution models (e.g. Baraffe et al. 2015) predict that lithium-burning temperatures are reached at significantly older ages (>30 Myr) at 0.09 M⊙. More accurate lithium observations are worth pursuing as they will bring insight into the properties of the matter in the interior of these degenerate objects, with potential implications on the equation of state or opacities adopted.
5.2. Radial velocity confirmation
Figure 8 shows the full WHT/ISIS spectra on the left-hand side with a zoom on the potassium (KI and sodium (NaI) doublets. We observe that both doublets are resolved on several nights with a change in the position of individual lines, for example, on the night of 13 July (phase 0.889) and 14 July (phase 0.276). We measured the offsets of the NaI doublet with respect to the air wavelength3 with the task splot in IRAF. On the nights of 9 June and 12 July 2015, the doublet was unresolved because the observations took place very close to transit (phase between 0.46 and 0.53).
The RV measurements were extracted from the ISIS spectra (R ~ 6000) using the cross-correlation function (CCF) technique within the package MOLLY4. We first normalised the ISIS spectra of the target and the template star GJ699 (Barnard’s star) within the IRAF package using a low-order legendre polynomial. Then, we cross-correlated each target spectrum with the template stellar spectrum. We did not obtain a spectrum of the template star every night (see Sect. 4.2), thus, we used the spectrum of the night taken on 9 June 2015. We also corrected for possible drifts using the spectra of the sky subtracted during the reduction procedure. We derived the drifts by cross-correlating the sky spectrum of every target spectra with the sky spectrum of the template star taken on 17 July 2015 . We found drifts in the range −0.8 km s-1 to 3.7 km s-1.
In Table 3 we provide the heliocentric Julian days and radial velocities for the two components of the system. We do not see the double peak CCF in the spectra taken at orbital phases close to 0.5. For these cases, we associated the RVs to the primary star. The RV uncertainties are in the range 0.1–0.7 km s-1. We fitted these RVs with the RVFit code (Iglesias-Marzoa et al. 2015). We tried several fits by leaving free and fixing the orbital period to that derived from the transit analysis, but both gave too high reduced χ2 values because the RV uncertainties are probably underestimated. The zero point of the calibration estimated from the sky spectrum of the template star has an error of ~1.6 km s-1. Therefore, to take this systematic uncertainty into account, we multiplied the RV errors given in Table 3 by a factor of 10. These errors are of the order of or larger than potential RV variations induced by the presence of spots5 that can affect young M dwarfs, such as USco members. In addition, we decided to discard the RV point obtained on 12 July 2015 with a phase close to 0.5 because the rms of the fit improves significantly. The final reduced  values are 1.5–1.8, being ν the degrees of freedom, in this case, equal to 14.
Radial velocities of USco16m25 derived from the cross-correlation function method.
5.3. Physical parameters and global fits
From the K2 light-curve, we infer that the radii and luminosities of the two components are similar to less than a few percent. From the RV measurements, we derive a maximum semi-amplitude of 44.2 ± 1.2 km s-1 and 40.8 ± 1.4 km s-1 for the primary and secondary, respectively. Hence, the ratio of the maximum amplitude is 0.92 ± 0.03, corresponding to the mass ratio (q) of the system. This mass ratio is high and typical of low-mass and brown dwarf binaries (see review by Burgasser et al. 2007, and references therein).
We used the K2 light curve corrected for the out-of-eclipse modulation (see Sect. 2.2), the two photometric sequences obtained at the IAC80, and the RV data set to perform a combined fit and provide the final ephemerides and physical parameters of the system. For the photometric eclipses, we modified the analytic formalisms of both Mandel & Agol (2002) and Giménez (2006), which are generally used to model transiting exoplanets, to include the effect of a luminous transiting object. For our purposes, we assigned the name “primary” eclipses to the deepest ones, which occur when the hottest star is eclipsed by the less luminous component. We included a luminosity ratio L21 of both stars (luminositysec/luminositypri), leading to the following corrected expressions  (1)for the primary eclipses and
  (2)for the secondary eclipses.
The final χ2 is evaluated as the sum of the χ2 of the individual data sets. For the K2 data set, and to avoid the blurring effect caused by the long integration times compared to the eclipse timescales (Kipping 2010), we oversampled the time vector to evaluate the model at five different points inside each time stamp, and then computed the average model value.
Using the Giménez (2006) formalism, the parameters entering the fit were the orbital period, the epoch of primary eclipse, the phase of primary eclipse ingress φ1, the orbital inclination, the eccentricity and argument of periastron, the L21, the two masses of the stars, the time of periastron passage, and an offset in RV. Two combinations of the quadratic limb-darkening coefficients (u+ = ua + ub and u− = ua−ub) were kept fixed to values extracted from the tables of Claret et al. (2012)6. We used the amoeba downhill minimisation method (Csizmadia et al. 2011) to find a minimum of the parameter space. The errors were estimated by several repetitions of the amoeba minimisation, allowing the algorithm to start from slightly different initial positions to avoid the effect of falling into local minima. A total of 150 repetitions were performed, and we recorded the parameters and their χ2 at each step of the downhill algorithm. We selected a χ2 threshold as the maximum χ2 of all of the final convergence points of each of the amoeba trials. The uncertainties were finally estimated through Gaussian fits to the distribution of each of the free parameters of the chains that produced a χ2 below this threshold. The revised transit duration is 2.4163 h, given by the “Phi” parameters. All the parameters for this formalism are quoted in Table 4.
In the Eastman et al. (2013) re-implementation of the Mandel & Agol (2002) formalism, the parameters entering the fit were the log(period), the epoch of primary eclipse, the log of the system scale (a/r), the cosine of the orbital inclination, the  and
and  , the L12 ratio, the two masses of the stars, the time of periastron passage, and an offset in RV. The same quadratic limb-darkening coefficients were also kept fixed. We used the EXOFAST implementations of the amoeba minimisation algorithm to find a reasonable “global” minimum and used this minimum as a starting point for a differential evolution Markov chain method (Braak 2006). In this method, several Monte Carlo (MC) chains are run in parallel (twice the number of parameters entering the fit, in our case 22 chains), and they are used to evaluate the size of the steps on each MC iteration. The chains are evaluated for convergence when their number of independent draws is higher than 1000 and the Gelman-Rubin statistic is lower than 1.02 for all the parameters. After 60 000 steps, the acceptance rate of the chains was 17%, which is a reasonable value showing good mixing of the chains (Gelman et al. 2003). To facilitate the comparison between the two methods, the uncertainties were estimated in the same way as in the first method, and the final values and their uncertainties are in Table 5. Most of the distributions are reasonably symmetrical, therefore we only quote the mean uncertainties7. The values for the maximum amplitudes of the primary and secondary components agree within 1σ with the values derived solely from the RV analysis.
Physical parameters with their error bars of the eclipsing system USco16m25 derived using the formalism of Giménez (2006).
Physical parameters with their error bars of the eclipsing system USco16m25 derived using the formalism of Mandel & Agol (2002).
The two results agree and show that the system is on a grazing configuration. The most discordant parameters are the luminosity ratio, the omega, and the eccentricity. This is probably due to the MC runs exploring a region of the parameter space in which a more eccentric orbit with a periastron line a few degrees from the line of sight produces a slightly better χ2 than the other solutions. In such a configuration, the primary and secondary eclipses occur at different relative distances of the stars, and thus the flux of the occulted star is reduced by the square root of the distance when it is farther away. As the depths of primary and secondary eclipses are comparable, the parameter that is changed to produce reasonable fits is the luminosity ratio of both components. From the very similar spectral types and the mass ratio q close to 0.92, we deduce that luminosity ratios as high as 1.5 implied by the solution in Table 5 are less realistic. For these three parameters, we therefore rely on the values listed in Table 4. It is important to note that despite these slight discrepancies, the physical values of the two stars agree perfectly well with the two explored formalism and methodologies. Our results also agree with the independent analysis of the system by David et al. (2015).
A third fit to the light curve alone was also performed with the Universal Transit Modeller/Universal Fitter (UTM/UFIT; Deeg 2014) and gave binary parameters that agree well with those in Table 4. We note that we kept the limb-darkening coefficients fixed in both methods, relying on the stellar model tabulations, and this might influence the obtained parameters. Despite our efforts to select adequate limb-darkening coefficients, the masses of the stars are in a parameter space where the stellar models are poorly tested, and significant differences might arise (Csizmadia et al. 2013). Additionally, the photometric curve shows out-of-eclipse modulations that we interprete as the result of inhomogeneities on the stellar surfaces, and the stars are a few Myr old, again supporting a skeptical interpretation of the adopted limb-darkening coefficient values. This would mostly affect the measurements of the stellar radii, and we caution about this additional noise source, which is very difficult to overcome. We limit the third-light fraction to less than 10%, given the absence of a third-light emitter in our datasets. Within the small range of third light from 0 to 10%, the inclination or the relative radius, (R1+R2)/a only depend very little on third light. The values in Tables 4 and 5 are given for the case of no third light. If any third light were present, we estimate that the relative radius would decrease by 0.05 per 10% of third light, whereas the inclination would increase by 0.5 degrees.
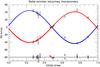 |
Fig. 9 Radial velocity measurements from WHT/ISIS as a function of phase for the primary (blue symbols) and the secondary (red symbols). |
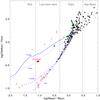 |
Fig. 10 Mass-radius diagram for detached eclipsing binaries: filled dots are primaries and asterisks are secondaries of systems with parameters determined with an accuracy better than 2%. Overplotted as red asterisks are field and young low-mass eclipsing binaries as well as four known eclipsing brown dwarfs: Corot-3 b (22 MJup; Deleuil et al. 2008), KELT-1 b (27.38 MJup; Siverd et al. 2012), and Kepler-39 b (18 MJup; Bouchy et al. 2011). Added in green are the only two eclipsing systems known to date in the USco association. Overplotted in red are the two components of USco16m25: the size of the symbols indicates the size of the error bars. Overplotted in blue are the solar-metallicity evolutionary tracks of the BT-Settl models (Baraffe et al. 2002) for two possible ages of 5 Myr (thick line) and 10 Myr (dashed line) for USco, the age of the Pleiades (120 Myr; long-dashed line), and the age of field dwarfs (1 Gyr; dot-dashed line). |
5.4. USco16m25 in the realm of eclipsing binaries
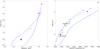 |
Fig. 11 Left: mass-luminosity diagram for the three eclipsing binaries identified in USco by K2: USco16m25 is represented as a black dot, UScoCTIO 5 as a green square, and HD 144588 as a red dot. Overplotted in blue are the solar-metallicity evolutionary tracks of the BT-Settl models (Baraffe et al. 2002) for two possible ages of 5 Myr (thick line) and 10 Myr (dashed line) for USco, the age of the Pleiades (120 Myr; long-dashed line), and the age of field dwarfs (1 Gyr; dot-dashed line). Right: effective temperature vs. luminosity diagram for the three USco systems with the same colour set as in the left panel. The blue dots on the 5 and 10 Myr isochrones correspond to masses of 1.4, 0.5, 0.3, and 0.1 M⊙, respectively. The size of the dots for the highest mass system represents the error bars on the measurements. |
In Fig. 10 we plot a mass-radius diagram to place USco16m25 in context with other known eclipsing binaries (Southworth 2014)8. The filled dots and grey asterisks in Fig. 10 represent the primaries and secondaries of detached eclipsing binaries with masses below 10 M⊙ where most components have mass and radius measurements accurate to 2%. At lower masses, several eclipsing binaries do exist, but the uncertainties on their masses and radii vary and are usually greater than 2%. Nonetheless, we added several known systems to populate this part of the mass-radius diagram. We overplotted three transiting brown dwarfs with accurate masses (below 30 Jupiter masses) and radii (Corot-3 b; KELT-1 b; Kepler-39 b; Deleuil et al. 2008; Siverd et al. 2012; Bouchy et al. 2011). We also overplotted very-low mass components of the eclipsing binaries listed in Table 3 of Tal-Or et al. (2013) whose masses range from 0.08 to 0.2 M⊙ (Pont et al. 2005a,b, 2006; Hebb et al. 2006; Maxted et al. 2007; Beatty et al. 2007; Pyrzas et al. 2009, 2012; Parsons et al. 2012b,c,a; Ofir et al. 2012; Triaud et al. 2013) and added the M-dwarf system from the WFCAM Transit Survey published by Nefs et al. (2013). We can see that most low-mass and brown dwarf components of eclipsing systems plotted in Fig. 10 follow the BT-Settl evolutionary models (Allard et al. 2012) with ages between the age of the Pleiades (120 Myr; Stauffer et al. 1998; Barrado y Navascués et al. 2004) and the age of field stars (~1 Gyr).
We also added as red asterisks in Fig. 10 three known young eclipsing binaries (King et al. 2000; Irwin et al. 2007; Cargile et al. 2008; Da Rio et al. 2009; Watson et al. 2009; Gómez Maqueo Chew et al. 2012; Gillen et al. 2014) with ages in the 1–20 Myr range (see Table 1 in Stassun et al. 2014) along with the sole brown dwarf eclipsing binary discovered to date (2MASS J05352184−0546085; Stassun et al. 2006, 2007). There are two known eclipsing systems recently discovered in the USco association (green symbols in Fig. 10). On the one, hand UScoCTIO-5, a M4.5 + M4.5 eclipsing binary with a period of 34 days and masses of 0.3287 ± 0.0024 and 0.3165 ± 0.0016M⊙ and radii of 0.834 ± 0.006 and 0.810 ± 0.006R⊙ for the primary and secondary, respectively (Kraus et al. 2015). On the other hand, a triple system composed of two solar-type stars (masses of 0.950 and 0.975 M⊙ and radii of 1.32–1.33 R⊙) and a late-F star with a mass of 1.44 M⊙ and a radius of 2.43 R⊙ (Torres et al. 2006; Chen et al. 2011; Alonso et al. 2015) USco16m25 bridges the gap between the coolest low-mass eclipsing binaries younger than 10 Myr and the only brown dwarf eclipsing system known to date.
We derived the bolometric luminosity of the system using the J-band magnitude from UKIDSS, assuming a distance of 145 pc for USco (de Bruijne et al. 1997) and the most recent bolometric correction for M dwarfs (1.97 ± 0.04 from the r−J colour of USco16m25; Mann et al. 2015). We calculated a total luminosity of log (L/L⊙) = −1.724 ± 0.096 dex, yielding individual luminosities of −2.020 dex and −2.032 for the primary and secondary, respectively. Using the Stefan-Boltzmann law, we derived an effective temperature of 2901
 K and 2908 K for the primary and secondary, respectively. We plot USco16m25 in a mass-luminosity diagram in the left-hand side plot in Fig. 11 along with the other two eclipsing systems in USco (HD 144588 and UScoCTIO 5).
We obtained an independent determination of the system’s effective temperature (Teff) and distance from a fit of the flux from a spherical blackbody of given size and distance against the system’s spectral energy distribution (Fig. 12), obtained from the Spanish Virtual Observatory Sed Analyzer (VOSA; Bayo et al. 2008) over the 0.8–4.6 micron wavelength range with data from the Deep Near-Infrared Southern Sky Survey (DENIS; DENIS Consortium 2005; Epchtein et al. 1997), UKIDSS (Lawrence et al. 2007), and the Wide Field Infrared Survey (WISE; Wright et al. 2010). We note that this system is undetected in the reddest mid-infrared bands of WISE, a region related to the presence of a hot accretion disc. This fit to the spectral energy distribution had two free parameters: Teff and the ratio R∗/d, were d is the distance. The fit indicated a temperature of 2800 ± 100 K and a distance ratio of 6.5 ± 0.5 × 10⁻¹¹. Given the component sizes of 0.388 Rsol listed in Table 4, we inferred a distance of 135 ± 10 pc. The distance estimate is strongly correlated with the temperature, in the sense that higher temperatures imply further distances. The best fit from the BT-Settl models suggests a temperature of 2800 K, a gravity of log g of 4.0, and a metallicity of −0.5 dex. All these temperature estimates agree within the error bars. By comparison, the same method leads to a temperature of 3260 K for UScoCTIO 5 (Kraus et al. 2015). Moreover, the triple system HD 144548 is composed of three components with Teff of 5943 K, 5103 K, and 5081 K, respectively, using the J-band and bolometric corrections from Pecaut & Mamajek (2013) to derive the bolometric luminosities. We compare the location of the three eclipsing systems identified in USco by K2 in a temperature vs. luminosity diagram on the right-hand side plot in Fig. 11.
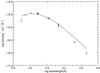 |
Fig. 12 Spectral energy distribution of USco16m25. We obtained the fluxes and their associated errors from the Spanish virtual observatory and calibrated them as incident fluxes on Earth. The wavelength ranges from the I band (7862 Å) from the DENIS survey to the WISE w2-band (4.6 microns). The solid line is the black-body fit. |
We note that UScoCTIO 5 and USco16m25 lie close to the 5 and 10 Myr isochrones from the latest models of Baraffe et al. (2015), while HD 144548 is located closer to older isochrones (see Fig. 11). Although it is too early to extrapolate the age of the association based on the two coolest systems, this estimate of 5–10 Myr is in line with the recent revision of the age of the USco association proposed by Pecaut et al. (11 ± 2 Myr; 2012) and the ages derived from isochrone fitting (5 ± 2 Myr; Preibisch & Zinnecker 1999; Slesnick et al. 2008; Lodieu et al. 2011). It is also consistent with the presence of lithium in absorption in the two components of USco16m25 and UScoCTIO 5 (Sect. 5.1).
The two components of USco16m25 have masses about 3.5 times lower than UScoCTIO-5 and radii twice as low. The difference is fairly large considering the similar spectral types of the two systems (M4–M4.5 vs. M5.25), suggesting that the mass-radius relation decreases swiftly close to the hydrogen-burning limit. USco16m25 is the lowest mass eclipsing binary in USco and fills an important gap in the mass-radius in the 0.3–0.03 M⊙ interval, a region occupied by three old objects (CM Draconis (M4.5 + M4.5) and LSPM J1112+7626 (>M4); Morales et al. 2009; Terrien et al. 2012; Irwin et al. 2011) and one secondary (LSPM J1112+7626 (>M4); Irwin et al. 2011) and two young systems (JW 380 and 2MASS J05352184−0546085; Irwin et al. 2007; Da Rio et al. 2009; Stassun et al. 2006, 2007). Overall, USco16m25 represents a key eclipsing binary because it is the lowest mass member of USco, filling the gap between the lowest mass stars and brown dwarfs in the mass-radius diagram.
We can conclude that the stellar/substellar boundary in USco lies at a spectral type of M5.5 or later, in agreement with the suggestion of Luhman (1999), which was purely based on theoretical models. We can now compare this with the Pleiades (125 Myr; Stauffer et al. 1998) and Orion (1–3 Myr), where eclipsing binaries straddling the hydrogen-burning limit are known. In the former, PPl15 is an M6.5 spectroscopic binary showing lithium in absorption at 670.8 nm (Stauffer et al. 1994; Basri et al. 1996; Basri & Martín 1999), implying that Pleiades brown dwarfs have spectral types equal to or later than M7 (Stauffer et al. 1998). In the latter, Stassun et al. (2006) discovered an M6.5 eclipsing binary in Orion, suggesting that the stellar/substellar boundary lies at slightly earlier spectral type. In conclusion, we propose that the evolution of objects at the hydrogen-burning mass limit evolve at very similar effective temperatures in a narrow range in spectral type (M5.5–M7) during the first 100 Myr, as predicted by models (e.g. Burrows & Liebert 1993; Chabrier & Baraffe 1997).
6. Conclusions and future work
We have exploited the K2 light curves from campaign two and discovered an eclipsing binary made of two very low mass star members of the young USco association that we confirmed with ground-based RV follow-up. The main results of our work can be summarised as follows:
-
1.
USco16m25 is the coolest eclipsing binary in USco with acombined spectral type of M5.25 ± 0.25;
-
2.
we inferred a period of ~2.81 days and transit duration of ~2.4 h from the analysis of the K2 light curve;
-
3.
we estimated comparable radii, luminosities, and effective temperatures to within 5% for both components of the binary;
-
4.
we derived masses of 0.091 ± 0.005M⊙ and 0.084 ± 0.004M⊙ for the primary and secondary component, yielding a mass ratio q of 0.922 ± 0.015;
-
5.
objects straddling the stellar/substellar boundary evolve at very similar effective temperatures in a narrow range in spectral type during the first 100 Myr;
-
6.
USco16m25 bridges the gap between the coolest low-mass eclipsing binaries and the only brown dwarf eclipsing system known at ages younger than 10 Myr;
-
7.
USco16m25 is the third eclipsing system in USco with masses and radii obtained independently of models, suggesting that members of the USco association share an age of around 5–10 Myr.
We plan to increase the number and accuracy of our RV curves by obtaining optical spectra at higher resolution during a longer period of time covering several days to refine the the physical parameters of the USco16m25 system. In the course of these RV measurements, we also plan to measure the spin-orbit (mis)-alignment of USco16m25 by modelling the change in shape of spectral lines (see e.g. Albrecht et al. 2014). Such a measurement for a young eclipsing binary system will provide us an important insight on the initial spin-orbit (mis)-alignment of multiple systems at the stellar/substellar boundary. We also aim at extending our analysis of the Kepler light curves to other clusters at different ages, such as the Pleiades (125 ± 8 Myr; Stauffer et al. 1998), Praesepe (590–800 Myr; Fossati et al. 2008; Brandt & Huang 2015), and the Hyades (625 ± 50 Myr; Maeder & Mermilliod 1981), which are included in the fourth and fifth K2 campaigns, to populate the mass-radius diagram at low masses and at different ages.
IRAF is distributed by the National Optical Astronomy Observatory, which is operated by the Association of Universities for Research in Astronomy (AURA) under a cooperative agreement with the National Science Foundation.
We thank Kevin Luhman for kindly providing his templates before publication.
Central wavelengths of the lines of the doublet (8183.25 Å and 8194.79 Å) are taken from the NIST (National Institute of Standards and Technology) atomic spectra database lines.
The MOLLY package can be download from www2.warwick.ac.uk/fac/sci/physics/research/astro/people/marsh/software/
Zero-order approximations show that the effect of star spots is approximately vsini × dF, where dF is the difference in flux between the unspotted and spotted stellar surface. Estimates of dF (<3%) and the rotation period (~5 days) from our activity-conserved light curve and assuming no inclination translates into uncertainties of <0.12 km s-1 in the RV. Similarly, the eclipse depth could be biased by at most dF, affecting the radius estimate by ~1.5%.
We used fixed values of u+ = 0.7 and u− = 0.15.
The only exception is the argument of the periastron, which produces the following median and 34% confidence intervals: 92.9 .
.
List of detached eclipsing binaries taken from the census updated by John Southworth at http://www.astro.keele.ac.uk/jkt/debcat/
Acknowledgments
N.L. was funded by the Ramón y Cajal fellowship number 08-303-01-02. J.I.G.H. acknowledges financial support from the Spanish Ministry of Economy and Competitiveness (MINECO) under the 2011 Severo Ochoa Program MINECO SEV-2011-0187. H.D. acknowledges support from MINECO under grant AYA2012-39346-C02-02. N.N. acknowledges supports by the NAOJ Fellowship, Inoue Science Research Award, and Grant-in-Aid for Scientific Research (A) (JSPS KAKENHI Grant Number 25247026). This work was performed, in part, under contract with the Jet Propulsion Laboratory (JPL) funded by NASA through the Sagan Fellowship Program executed by the NASA Exoplanet Science Institute. Y.K. acknowledges supports by Grant-in-Aid for JSPS Fellows (JSPS KAKENHI Grant Number 15J08463) and the Leading Graduate Course for Frontiers of Mathematical Sciences and Physics. N.L. thanks Kevin Luhman for kindly providing his spectra of USco members before publication. This paper includes data collected by the Kepler mission. Funding for the Kepler mission is provided by the NASA Science Mission directorate. The authors gratefully acknowledge the team who made Kepler possible, including the extension of the mission and the K2 campaign. This work is based on observations made with the Gran Telescopio Canarias (GTC), operated on the island of La Palma in the Spanish Observatorio del Roque de los Muchachos of the Instituto de Astrofísica de Canarias (program GTC38-15A; PI Lodieu). The WHT and its service programme are operated on the island of La Palma by the Isaac Newton Group in the Spanish Observatorio del Roque de los Muchachos of the Instituto de Astrofísica de Canarias (service program SW2015a31 and DDT program). We warmly thank the WHT staff for carrying out our observations. This article is based on observations made with the IAC80 and Carlos Sanchez telescopes operated on the island of Tenerife by the Instituto de Astrofísica de Canarias in the Spanish Observatorio del Teide. This research has been carried out using telescope time awarded by the CCI International Time Programme at the Canary Islands Observatories (program ITP13-8; PI: Rubiño-Martin). The WHT observer on 17 June 2015 was Antonio Ferragamo. We also thank Rafael Barrena for his help. This publication makes use of VOSA, developed under the Spanish Virtual Observatory project supported from the Spanish MICINN through grant AyA2011-24052. This research has made use of the Simbad and Vizier databases, operated at the Centre de Données Astronomiques de Strasbourg (CDS), and of NASA’s Astrophysics Data System Bibliographic Services (ADS).
References
- Albrecht, S., Winn, J. N., Torres, G., et al. 2014, ApJ, 785, 83 [NASA ADS] [CrossRef] [Google Scholar]
- Allard, F., Homeier, D., & Freytag, B. 2012, Roy. Soc. London Phil. Trans. Ser. A, 370, 2765 [Google Scholar]
- Alonso, R., Auvergne, M., Baglin, A., et al. 2008, A&A, 482, L21 [NASA ADS] [CrossRef] [EDP Sciences] [Google Scholar]
- Alonso, R., Deeg, H. J., Hoyer, S., et al. 2015, A&A, 584, L8 [NASA ADS] [CrossRef] [EDP Sciences] [Google Scholar]
- Ardila, D., Martín, E., & Basri, G. 2000, AJ, 120, 479 [NASA ADS] [CrossRef] [Google Scholar]
- Bakos, G. Á., Lázár, J., Papp, I., Sári, P., & Green, E. M. 2002, PASP, 114, 974 [NASA ADS] [CrossRef] [Google Scholar]
- Bakos, G., Noyes, R. W., Kovács, G., et al. 2004, PASP, 116, 266 [NASA ADS] [CrossRef] [Google Scholar]
- Bakos, G. Á., Howard, A. W., Noyes, R. W., et al. 2009, ApJ, 707, 446 [NASA ADS] [CrossRef] [Google Scholar]
- Baraffe, I., Chabrier, G., Allard, F., & Hauschildt, P. H. 1998, A&A, 337, 403 [NASA ADS] [Google Scholar]
- Baraffe, I., Chabrier, G., Allard, F., & Hauschildt, P. H. 2002, A&A, 382, 563 [NASA ADS] [CrossRef] [EDP Sciences] [Google Scholar]
- Baraffe, I., Homeier, D., Allard, F., & Chabrier, G. 2015, A&A, 577, A42 [NASA ADS] [CrossRef] [EDP Sciences] [Google Scholar]
- Barge, P., Léger, A., Ollivier, M., et al. 2006, in ESA SP 1306, eds. M. Fridlund, A. Baglin, J. Lochard, & L. Conroy, 83 [Google Scholar]
- Barrado y Navascués, D., Stauffer, J. R., & Jayawardhana, R. 2004, ApJ, 614, 386 [NASA ADS] [CrossRef] [Google Scholar]
- Basri, G., & Martín, E. L. 1999, AJ, 118, 2460 [Google Scholar]
- Basri, G., Marcy, G. W., & Graham, J. R. 1996, ApJ, 458, 600 [NASA ADS] [CrossRef] [Google Scholar]
- Batalha, N. M. 2014, PNAS, 111, 12647 [NASA ADS] [CrossRef] [Google Scholar]
- Bate, M. R. 2009, MNRAS, 392, 590 [NASA ADS] [CrossRef] [Google Scholar]
- Bayo, A., Rodrigo, C., Barrado Y Navascués, D., et al. 2008, A&A, 492, 277 [NASA ADS] [CrossRef] [EDP Sciences] [Google Scholar]
- Beatty, T. G., Fernández, J. M., Latham, D. W., et al. 2007, ApJ, 663, 573 [NASA ADS] [CrossRef] [Google Scholar]
- Bochanski, J. J., West, A. A., Hawley, S. L., & Covey, K. R. 2007, AJ, 133, 531 [NASA ADS] [CrossRef] [Google Scholar]
- Borucki, W. J., Koch, D., Basri, G., et al. 2010, 327, 977 [Google Scholar]
- Bouchy, F., Bonomo, A. S., Santerne, A., et al. 2011, A&A, 533, A83 [NASA ADS] [CrossRef] [EDP Sciences] [Google Scholar]
- Braak, C. J. 2006, Stat. Comput., 16, 239 [Google Scholar]
- Brandt, T. D., & Huang, C. X. 2015, ApJ, 807, 58 [NASA ADS] [CrossRef] [Google Scholar]
- Bressan, A., Marigo, P., Girardi, L., et al. 2012, MNRAS, 427, 127 [NASA ADS] [CrossRef] [Google Scholar]
- Burgasser, A. J., Reid, I. N., Siegler, N., et al. 2007, in Protostars and Planets V, eds. B. Reipurth, D. Jewitt, & K. Keil, 427 [Google Scholar]
- Burrows, A., & Liebert, J. 1993, Rev. Mod. Phys., 65, 301 [NASA ADS] [CrossRef] [Google Scholar]
- Cargile, P. A., Stassun, K. G., & Mathieu, R. D. 2008, ApJ, 674, 329 [NASA ADS] [CrossRef] [Google Scholar]
- Cepa, J., Aguiar, M., Escalera, V. G., et al. 2000, in SPIE Conf. Ser. 4008, eds. M. Iye, & A. F. Moorwood, 623 [Google Scholar]
- Chabrier, G., & Baraffe, I. 1997, A&A, 327, 1039 [NASA ADS] [Google Scholar]
- Chabrier, G., Baraffe, I., Allard, F., & Hauschildt, P. 2000, ApJ, 542, 464 [NASA ADS] [CrossRef] [Google Scholar]
- Chen, C. H., Mamajek, E. E., Bitner, M. A., et al. 2011, ApJ, 738, 122 [NASA ADS] [CrossRef] [Google Scholar]
- Claret, A., Hauschildt, P. H., & Witte, S. 2012, A&A, 546, A14 [NASA ADS] [CrossRef] [EDP Sciences] [Google Scholar]
- Csizmadia, S., Moutou, C., Deleuil, M., et al. 2011, A&A, 531, A41 [NASA ADS] [CrossRef] [EDP Sciences] [Google Scholar]
- Csizmadia, S., Pasternacki, T., Dreyer, C., et al. 2013, A&A, 549, A9 [NASA ADS] [CrossRef] [EDP Sciences] [Google Scholar]
- Cutri, R. M., Skrutskie, M. F., van Dyk, S., et al. 2003, VizieR Online Data Catalog: II/246 [Google Scholar]
- Cutri, R. M., et al. 2014, VizieR Online Data Catalog: II/328 [Google Scholar]
- Da Rio, N., Robberto, M., Soderblom, D. R., et al. 2009, ApJS, 183, 261 [NASA ADS] [CrossRef] [Google Scholar]
- D’Antona, F., & Mazzitelli, I. 1994, ApJS, 90, 467 [NASA ADS] [CrossRef] [Google Scholar]
- David, T. J., Hillenbrand, L. A., Cody, A. M., Carpenter, J. M., & Howard, A. W. 2015, ApJ, submitted [arXiv:1510.08087] [Google Scholar]
- Dawson, P., Scholz, A., & Ray, T. P. 2011, MNRAS, 418, 1231 [NASA ADS] [CrossRef] [Google Scholar]
- Dawson, P., Scholz, A., Ray, T. P., et al. 2013, MNRAS, 429, 903 [NASA ADS] [CrossRef] [Google Scholar]
- de Bruijne, J. H. J., Hoogerwerf, R., Brown, A. G. A., Aguilar, L. A., & de Zeeuw, P. T. 1997, in ESA SP-402: Hipparcos – Venice ’97, 575 [Google Scholar]
- Deeg, H. J. 2014, Astrophysics Source Code Library [record ascl:1412.003] [Google Scholar]
- Deleuil, M., Deeg, H. J., Alonso, R., et al. 2008, A&A, 491, 889 [NASA ADS] [CrossRef] [EDP Sciences] [Google Scholar]
- DENIS Consortium. 2005, VizieR Online Data Catalog, B/denis [Google Scholar]
- de Zeeuw, P. T., Hoogerwerf, R., de Bruijne, J. H. J., Brown, A. G. A., & Blaauw, A. 1999, AJ, 117, 354 [NASA ADS] [CrossRef] [Google Scholar]
- Dotter, A., Chaboyer, B., Jevremović, D., et al. 2008, ApJS, 178, 89 [NASA ADS] [CrossRef] [Google Scholar]
- Dupuy, T. J., Liu, M. C., & Ireland, M. J. 2009a, ApJ, 692, 729 [NASA ADS] [CrossRef] [Google Scholar]
- Dupuy, T. J., Liu, M. C., & Ireland, M. J. 2009b, ApJ, 699, 168 [Google Scholar]
- Dupuy, T. J., Liu, M. C., Bowler, B. P., et al. 2010, ApJ, 721, 1725 [NASA ADS] [CrossRef] [Google Scholar]
- Dupuy, T. J., Liu, M. C., & Ireland, M. J. 2014, ApJ, 790, 133 [NASA ADS] [CrossRef] [Google Scholar]
- Dupuy, T. J., Liu, M. C., Leggett, S. K., et al. 2015, ApJ, 805, 56 [NASA ADS] [CrossRef] [Google Scholar]
- Eastman, J., Gaudi, B. S., & Agol, E. 2013, PASP, 125, 83 [NASA ADS] [CrossRef] [Google Scholar]
- Epchtein, N., de Batz, B., & Capoani, L. E. 1997, The Messenger, 87, 27 [NASA ADS] [Google Scholar]
- Feiden, G. A., & Chaboyer, B. 2012, ApJ, 757, 42 [NASA ADS] [CrossRef] [Google Scholar]
- Fossati, L., Bagnulo, S., Landstreet, J., et al. 2008, A&A, 483, 891 [NASA ADS] [CrossRef] [EDP Sciences] [Google Scholar]
- Gelman, A., Carlin, J., Stern, H., et al. 2003, Bayesian Data Analysis (CRC Press) [Google Scholar]
- Gillen, E., Aigrain, S., McQuillan, A., et al. 2014, A&A, 562, A50 [NASA ADS] [CrossRef] [EDP Sciences] [Google Scholar]
- Giménez, A. 2006, A&A, 450, 1231 [NASA ADS] [CrossRef] [EDP Sciences] [Google Scholar]
- Gizis, J. E. 1997, AJ, 113, 806 [NASA ADS] [CrossRef] [Google Scholar]
- Gómez Maqueo Chew, Y., Stassun, K. G., Prša, A., et al. 2012, ApJ, 745, 58 [Google Scholar]
- Gontcharov, G. A. 2006, Astron. Lett., 32, 759 [NASA ADS] [CrossRef] [Google Scholar]
- Gray, R. O., Corbally, C. J., Garrison, R. F., McFadden, M. T., & Robinson, P. E. 2003, AJ, 126, 2048 [NASA ADS] [CrossRef] [Google Scholar]
- Hebb, L., Wyse, R. F. G., Gilmore, G., & Holtzman, J. 2006, AJ, 131, 555 [NASA ADS] [CrossRef] [Google Scholar]
- Houk, N., & Smith-Moore, M. 1988, Michigan Catalogue of Two-dimensional Spectral Types for the HD Stars, Vol. 4, Declinations −26° to −12° [Google Scholar]
- Howell, S. B., Sobeck, C., Haas, M., et al. 2014, PASP, 126, 398 [NASA ADS] [CrossRef] [Google Scholar]
- Iglesias-Marzoa, R., López-Morales, M., & Jesús Arévalo Morales, M. 2015, PASP, 127, 567 [NASA ADS] [CrossRef] [Google Scholar]
- Irwin, J., Aigrain, S., Hodgkin, S., et al. 2007, MNRAS, 380, 541 [NASA ADS] [CrossRef] [Google Scholar]
- Irwin, J., Buchhave, L., Berta, Z. K., et al. 2010, ApJ, 718, 1353 [NASA ADS] [CrossRef] [Google Scholar]
- Irwin, J. M., Quinn, S. N., Berta, Z. K., et al. 2011, ApJ, 742, 123 [NASA ADS] [CrossRef] [Google Scholar]
- Jung, Y. K., Udalski, A., Sumi, T., et al. 2015, ApJ, 798, 123 [NASA ADS] [CrossRef] [Google Scholar]
- Kashikawa, N., Aoki, K., Asai, R., et al. 2002, PASJ, 54, 819 [NASA ADS] [Google Scholar]
- Kenworthy, M. A., Lacour, S., Kraus, A., et al. 2015, MNRAS, 446, 411 [NASA ADS] [CrossRef] [Google Scholar]
- King, J. R., Soderblom, D. R., Fischer, D., & Jones, B. F. 2000, ApJ, 533, 944 [NASA ADS] [CrossRef] [Google Scholar]
- Kipping, D. M. 2010, MNRAS, 408, 1758 [NASA ADS] [CrossRef] [Google Scholar]
- Klessen, R. S. 2001, ApJ, 556, 837 [Google Scholar]
- Koen, C., Kilkenny, D., van Wyk, F., & Marang, F. 2010, MNRAS, 403, 1949 [Google Scholar]
- Konopacky, Q. M., Ghez, A. M., Barman, T. S., et al. 2010, ApJ, 711, 1087 [NASA ADS] [CrossRef] [Google Scholar]
- Kraus, A. L., Cody, A. M., Covey, K. R., et al. 2015, ApJ, 807, 3 [NASA ADS] [CrossRef] [Google Scholar]
- Kunkel, M. 1999, Ph.D. Thesis, Julius-Maximilians-Universität Würzburg [Google Scholar]
- Lawrence, A., Warren, S. J., Almaini, O., et al. 2007, MNRAS, 379, 1599 [NASA ADS] [CrossRef] [MathSciNet] [Google Scholar]
- Lépine, S., & Shara, M. M. 2005, AJ, 129, 1483 [NASA ADS] [CrossRef] [Google Scholar]
- Lissauer, J. J., Dawson, R. I., & Tremaine, S. 2014, Nature, 513, 336 [NASA ADS] [CrossRef] [Google Scholar]
- Liu, Y.-J., Sato, B., Zhao, G., et al. 2008, ApJ, 672, 553 [NASA ADS] [CrossRef] [Google Scholar]
- Lodieu, N. 2013, MNRAS, 431, 3222 [NASA ADS] [CrossRef] [Google Scholar]
- Lodieu, N., Hambly, N. C., & Jameson, R. F. 2006, MNRAS, 373, 95 [NASA ADS] [CrossRef] [Google Scholar]
- Lodieu, N., Hambly, N. C., Jameson, R. F., et al. 2007, MNRAS, 374, 372 [NASA ADS] [CrossRef] [Google Scholar]
- Lodieu, N., Hambly, N. C., Jameson, R. F., & Hodgkin, S. T. 2008, MNRAS, 383, 1385 [NASA ADS] [CrossRef] [Google Scholar]
- Lodieu, N., Dobbie, P. D., & Hambly, N. C. 2011, A&A, 527, A24 [NASA ADS] [CrossRef] [EDP Sciences] [Google Scholar]
- Lodieu, N., Dobbie, P. D., Cross, N. J. G., et al. 2013, MNRAS, 435, 2474 [NASA ADS] [CrossRef] [Google Scholar]
- Luhman, K. L. 1999, ApJ, 525, 466 [NASA ADS] [CrossRef] [Google Scholar]
- Luhman, K. L., & Mamajek, E. E. 2012, ApJ, 758, 31 [NASA ADS] [CrossRef] [Google Scholar]
- Luhman, K. L., Stauffer, J. R., Muench, A. A., et al. 2003, ApJ, 593, 1093 [NASA ADS] [CrossRef] [Google Scholar]
- Maeder, A., & Mermilliod, J. C. 1981, A&A, 93, 136 [NASA ADS] [Google Scholar]
- Mamajek, E. E., Quillen, A. C., Pecaut, M. J., et al. 2012, AJ, 143, 72 [NASA ADS] [CrossRef] [Google Scholar]
- Mandel, K., & Agol, E. 2002, ApJ, 580, L171 [NASA ADS] [CrossRef] [Google Scholar]
- Mann, A. W., Feiden, G. A., Gaidos, E., Boyajian, T., & von Braun, K. 2015, ApJ, 804, 64 [NASA ADS] [CrossRef] [Google Scholar]
- Martín, E. L., Delfosse, X., & Guieu, S. 2004, AJ, 127, 449 [NASA ADS] [CrossRef] [Google Scholar]
- Martín, E. L., Phan-Bao, N., Bessell, M., et al. 2010, A&A, 517, A53 [NASA ADS] [CrossRef] [EDP Sciences] [Google Scholar]
- Maxted, P. F. L., O’Donoghue, D., Morales-Rueda, L., Napiwotzki, R., & Smalley, B. 2007, MNRAS, 376, 919 [NASA ADS] [CrossRef] [Google Scholar]
- Mitchell, D. S., Frink, S., Quirrenbach, A., et al. 2003, BAAS, 35, 1234 [NASA ADS] [Google Scholar]
- Monet, D. B. A., Canzian, B., Dahn, C., et al. 1998, The USNO-A2.0 Catalogue, 1252 [Google Scholar]
- Monet, D. G., Levine, S. E., Canzian, B., et al. 2003, AJ, 125, 984 [NASA ADS] [CrossRef] [Google Scholar]
- Morales, J. C., Ribas, I., Jordi, C., et al. 2009, ApJ, 691, 1400 [NASA ADS] [CrossRef] [Google Scholar]
- Morales-Calderón, M., Stauffer, J. R., Stassun, K. G., et al. 2012, ApJ, 753, 149 [NASA ADS] [CrossRef] [Google Scholar]
- Nefs, S. V., Birkby, J. L., Snellen, I. A. G., et al. 2013, MNRAS, 431, 3240 [NASA ADS] [CrossRef] [Google Scholar]
- Nidever, D. L., Marcy, G. W., Butler, R. P., Fischer, D. A., & Vogt, S. S. 2002, ApJS, 141, 503 [NASA ADS] [CrossRef] [Google Scholar]
- Niels Bohr Institute, University of Copenhagen, Institute of Astronomy, Cambridge, UK, & Real Instituto y Observatorio de La Armada en San Fernando 2014, VizieR Online Data Catalog: I/327 [Google Scholar]
- Ofir, A., Gandolfi, D., Buchhave, L., et al. 2012, MNRAS, 423, L1 [NASA ADS] [CrossRef] [Google Scholar]
- Padoan, P., & Nordlund, Å. 2002, ApJ, 576, 870 [Google Scholar]
- Palla, F., & Stahler, S. W. 1993, ApJ, 418, 414 [NASA ADS] [CrossRef] [Google Scholar]
- Parsons, S. G., Gänsicke, B. T., Marsh, T. R., et al. 2012a, MNRAS, 426, 1950 [NASA ADS] [CrossRef] [Google Scholar]
- Parsons, S. G., Marsh, T. R., Gänsicke, B. T., et al. 2012b, MNRAS, 419, 304 [NASA ADS] [CrossRef] [Google Scholar]
- Parsons, S. G., Marsh, T. R., Gänsicke, B. T., et al. 2012c, MNRAS, 420, 3281 [NASA ADS] [Google Scholar]
- Pecaut, M. J., & Mamajek, E. E. 2013, ApJS, 208, 9 [NASA ADS] [CrossRef] [Google Scholar]
- Pecaut, M. J., Mamajek, E. E., & Bubar, E. J. 2012, ApJ, 746, 154 [NASA ADS] [CrossRef] [Google Scholar]
- Pollacco, D. L., Skillen, I., Collier Cameron, A., et al. 2006, PASP, 118, 1407 [NASA ADS] [CrossRef] [Google Scholar]
- Pont, F., Bouchy, F., Melo, C., et al. 2005a, A&A, 438, 1123 [NASA ADS] [CrossRef] [EDP Sciences] [Google Scholar]
- Pont, F., Melo, C. H. F., Bouchy, F., et al. 2005b, A&A, 433, L21 [NASA ADS] [CrossRef] [EDP Sciences] [Google Scholar]
- Pont, F., Moutou, C., Bouchy, F., et al. 2006, A&A, 447, 1035 [NASA ADS] [CrossRef] [EDP Sciences] [Google Scholar]
- Preibisch, T., & Zinnecker, H. 1999, AJ, 117, 2381 [NASA ADS] [CrossRef] [Google Scholar]
- Preibisch, T., & Zinnecker, H. 2002, AJ, 123, 1613 [NASA ADS] [CrossRef] [Google Scholar]
- Preibisch, T., Guenther, E., Zinnecker, H., et al. 1998, A&A, 333, 619 [NASA ADS] [Google Scholar]
- Preibisch, T., Guenther, E., & Zinnecker, H. 2001, AJ, 121, 1040 [NASA ADS] [CrossRef] [Google Scholar]
- Preibisch, T., Brown, A. G. A., Bridges, T., Guenther, E., & Zinnecker, H. 2002, AJ, 124, 404 [NASA ADS] [CrossRef] [Google Scholar]
- Pyrzas, S., Gänsicke, B. T., Marsh, T. R., et al. 2009, MNRAS, 394, 978 [NASA ADS] [CrossRef] [Google Scholar]
- Pyrzas, S., Gänsicke, B. T., Brady, S., et al. 2012, MNRAS, 419, 817 [NASA ADS] [CrossRef] [Google Scholar]
- Reipurth, B., & Clarke, C. 2001, AJ, 122, 432 [NASA ADS] [CrossRef] [Google Scholar]
- Rice, E. L., Barman, T., Mclean, I. S., Prato, L., & Kirkpatrick, J. D. 2010, ApJS, 186, 63 [NASA ADS] [CrossRef] [Google Scholar]
- Rizzuto, A. C., Ireland, M. J., & Kraus, A. L. 2015, MNRAS, 448, 2737 [NASA ADS] [CrossRef] [Google Scholar]
- Roeser, S., Demleitner, M., & Schilbach, E. 2010, AJ, 139, 2440 [NASA ADS] [CrossRef] [Google Scholar]
- Sanchis-Ojeda, R., Rappaport, S., Pallé, E., et al. 2015, ApJ, 812, 112 [NASA ADS] [CrossRef] [Google Scholar]
- Siess, L., Dufour, E., & Forestini, M. 2000, A&A, 358, 593 [Google Scholar]
- Sion, E. M., Holberg, J. B., Oswalt, T. D., McCook, G. P., & Wasatonic, R. 2009, AJ, 138, 1681 [NASA ADS] [CrossRef] [Google Scholar]
- Siverd, R. J., Beatty, T. G., Pepper, J., et al. 2012, ApJ, 761, 123 [Google Scholar]
- Skrutskie, M. F., Cutri, R. M., Stiening, R., et al. 2006, AJ, 131, 1163 [NASA ADS] [CrossRef] [Google Scholar]
- Slesnick, C. L., Carpenter, J. M., & Hillenbrand, L. A. 2006, AJ, 131, 3016 [NASA ADS] [CrossRef] [Google Scholar]
- Slesnick, C. L., Hillenbrand, L. A., & Carpenter, J. M. 2008, ApJ, 688, 377 [NASA ADS] [CrossRef] [Google Scholar]
- Smart, R. L., & Nicastro, L. 2014, A&A, 570, A87 [NASA ADS] [CrossRef] [EDP Sciences] [Google Scholar]
- Smith, J. C., Stumpe, M. C., Van Cleve, J. E., et al. 2012, PASP, 124, 1000 [NASA ADS] [CrossRef] [Google Scholar]
- Song, I., Zuckerman, B., & Bessell, M. S. 2012, AJ, 144, 8 [NASA ADS] [CrossRef] [Google Scholar]
- Southworth, J. 2014, ArXiv e-prints [arXiv:1411.1219] [Google Scholar]
- Stamatellos, D., & Whitworth, A. P. 2009, MNRAS, 400, 1563 [NASA ADS] [CrossRef] [Google Scholar]
- Stassun, K. G., Mathieu, R. D., & Valenti, J. A. 2006, Nature, 440, 311 [NASA ADS] [CrossRef] [PubMed] [Google Scholar]
- Stassun, K. G., Mathieu, R. D., & Valenti, J. A. 2007, ApJ, 664, 1154 [NASA ADS] [CrossRef] [Google Scholar]
- Stassun, K. G., Kratter, K. M., Scholz, A., & Dupuy, T. J. 2012, ApJ, 756, 47 [NASA ADS] [CrossRef] [Google Scholar]
- Stassun, K. G., Feiden, G. A., & Torres, G. 2014, New Astron. Rev., 60, 1 [NASA ADS] [CrossRef] [Google Scholar]
- Stauffer, J. R., Liebert, J., Giampapa, M., et al. 1994, AJ, 108, 160 [NASA ADS] [CrossRef] [Google Scholar]
- Stauffer, J. R., Schultz, G., & Kirkpatrick, J. D. 1998, ApJ, 499, L219 [CrossRef] [Google Scholar]
- Steffen, J. H., Fabrycky, D. C., Ford, E. B., et al. 2012, MNRAS, 421, 2342 [NASA ADS] [CrossRef] [Google Scholar]
- Stumpe, M. C., Smith, J. C., Van Cleve, J. E., et al. 2012, PASP, 124, 985 [NASA ADS] [CrossRef] [Google Scholar]
- Tal-Or, L., Mazeh, T., Alonso, R., et al. 2013, A&A, 553, A30 [NASA ADS] [CrossRef] [EDP Sciences] [Google Scholar]
- Terrien, R. C., Fleming, S. W., Mahadevan, S., et al. 2012, ApJ, 760, L9 [NASA ADS] [CrossRef] [Google Scholar]
- Tody, D. 1986, in SPIE Conf. Ser. 627, ed. D. L. Crawford, 733 [Google Scholar]
- Tody, D. 1993, in Astronomical Data Analysis Software and Systems II, eds. R. J. Hanisch, R. J. V. Brissenden, & J. Barnes, ASP Conf. Ser., 52, 173 [Google Scholar]
- Tognelli, E., Prada Moroni, P. G., & Degl’Innocenti, S. 2011, A&A, 533, A109 [NASA ADS] [CrossRef] [EDP Sciences] [Google Scholar]
- Torres, C. A. O., Quast, G. R., da Silva, L., et al. 2006, A&A, 460, 695 [NASA ADS] [CrossRef] [EDP Sciences] [Google Scholar]
- Torres, G., Andersen, J., & Giménez, A. 2010, A&ARv, 18, 67 [Google Scholar]
- Triaud, A. H. M. J., Hebb, L., Anderson, D. R., et al. 2013, A&A, 549, A18 [NASA ADS] [CrossRef] [EDP Sciences] [Google Scholar]
- van Eyken, J. C., Ciardi, D. R., Rebull, L. M., et al. 2011, AJ, 142, 60 [NASA ADS] [CrossRef] [Google Scholar]
- van Leeuwen, F. 2007, A&A, 474, 653 [NASA ADS] [CrossRef] [EDP Sciences] [Google Scholar]
- Vanderburg, A., & Johnson, J. A. 2014, PASP, 126, 948 [NASA ADS] [CrossRef] [Google Scholar]
- Walter, F. M., Vrba, F. J., Mathieu, R. D., Brown, A., & Myers, P. C. 1994, AJ, 107, 692 [NASA ADS] [CrossRef] [Google Scholar]
- Watson, M. G., Schröder, A. C., Fyfe, D., et al. 2009, A&A, 493, 339 [NASA ADS] [CrossRef] [EDP Sciences] [Google Scholar]
- Whitworth, A. P., & Zinnecker, H. 2004, A&A, 427, 299 [NASA ADS] [CrossRef] [EDP Sciences] [Google Scholar]
- Wright, E. L., Eisenhardt, P. R. M., Mainzer, A. K., et al. 2010, AJ, 140, 1868 [NASA ADS] [CrossRef] [Google Scholar]
- Zacharias, N., Monet, D. G., Levine, S. E., et al. 2005, VizieR Online Data Catalog: I/297 [Google Scholar]
- Zapatero Osorio, M. R., Béjar, V. J. S., Pavlenko, Y., et al. 2002, A&A, 384, 937 [NASA ADS] [CrossRef] [EDP Sciences] [Google Scholar]
All Tables
Coordinates, photometry, and proper motion (mas/yr) of the K2 transiting system quoted in Simbad as USco J161630.68−251220.1 (= EPIC 203710387).
Logs of WHT/ISIS spectroscopic observations for the target, the telluric standard star HIP 77859, and the RV templates HD 164922 and GJ 699 (= Barnard’s star).
Radial velocities of USco16m25 derived from the cross-correlation function method.
Physical parameters with their error bars of the eclipsing system USco16m25 derived using the formalism of Giménez (2006).
Physical parameters with their error bars of the eclipsing system USco16m25 derived using the formalism of Mandel & Agol (2002).
All Figures
|
Fig. 1 Kepler light curve for USc16m25 over the full ~76 days of the second K2 campaign in Upper Scorpius. |
| In the text | |
|
Fig. 2 Autocorrelation of the K2 light curve of USco16m25. The vertical dashed lines represent multiples of the period of the system. |
| In the text | |
|
Fig. 3 K2 light curves folded in phase and normalised to unity for the primary (left) and the secondary (right) component of USco16m25. The circles at the bottom of the plots represent the residuals between the fit (red line) and the observed transits (black circles with error bars). The error bars were estimated from the out-of-eclipse dispersion of the K2 curve, as 0.37%. The primary eclipse curve shows a few outliers during the eclipse phases; we increased the error bars of these data points (four) by an extra factor of 4 to reduce their effect on the final determined parameters. The red line corresponds to the best-fit model to the global set of data (light curves, photometric transits, and radial velocities). |
| In the text | |
|
Fig. 4 Two additional transits with different levels of completeness for USco16m25. We observed the system on the night of 18 May and 11 June 2015 in the SDSSi filter with IAC80/CAMELOT. The red line corresponds to the best-fit model to the global set of data (light curves, photometric transits, and radial velocities). |
| In the text | |
|
Fig. 5 Left: optical spectra of USco16m25 (black) obtained with the R1000R grating on GTC/OSIRIS. Overplotted in red are USco spectral template of spectral type M5, M5.25, and M5.5 kindly provided by Kevin Luhman. The top spectrum represents a combination of the normalised spectra of an M5 and an M6 member of USco. Right: zoom-in on the lithium absorption line at 6707.8 Å (marked with a vertical dashed red line) of USco16m25 (black) obtained with the R2500R grating on GTC/OSIRIS. |
| In the text | |
|
Fig. 6 Optical spectra of USco16m25 (black) obtained with Subaru/FOCAS at a resolution of 1000. The spectra were obtained on 19 June 2015 between UT = 07h and UT = 08h24m. Overplotted in red on the bottom spectrum is the GTC/OSIRIS spectrum obtained on 2 August 2015 at a similar resolution (see left-hand side panel of Fig. 5). The red dotted vertical lines mark the positions of Hβ and Hα lines at 4861 Å and 6563 Å, respectively. |
| In the text | |
|
Fig. 7 Left: (Z−J, Z) colour–magnitude diagram for 6.5 deg2 in the central region of USco (Lodieu et al. 2007). The USco cluster sequence is well separated from field stars. Right: vector point diagram. We averaged the values of the proper motion in each direction from the datasets listed in Table 1, where the error bars represent the dispersion between each catalogue. The mean proper motion of the association is (μαcosδ,μδ) ~ (−11, −25) mas/yr. Our transiting system is highlighted with a large red dot, demonstrating its photometric and astrometric membership. |
| In the text | |
|
Fig. 8 Sequence of optical spectra of USco16m25 taken with WHT/ISIS over the course of 1.5 month, between 2 June and 14 July 2015. The wavelength range spans 745–845 nm at a spectral resolution of ~6000 (left plot), which includes the gravity-sensitive sodium (818.3/819.5 nm; right-hand side plot) doublets at 818.3/819.5 nm. |
| In the text | |
|
Fig. 9 Radial velocity measurements from WHT/ISIS as a function of phase for the primary (blue symbols) and the secondary (red symbols). |
| In the text | |
|
Fig. 10 Mass-radius diagram for detached eclipsing binaries: filled dots are primaries and asterisks are secondaries of systems with parameters determined with an accuracy better than 2%. Overplotted as red asterisks are field and young low-mass eclipsing binaries as well as four known eclipsing brown dwarfs: Corot-3 b (22 MJup; Deleuil et al. 2008), KELT-1 b (27.38 MJup; Siverd et al. 2012), and Kepler-39 b (18 MJup; Bouchy et al. 2011). Added in green are the only two eclipsing systems known to date in the USco association. Overplotted in red are the two components of USco16m25: the size of the symbols indicates the size of the error bars. Overplotted in blue are the solar-metallicity evolutionary tracks of the BT-Settl models (Baraffe et al. 2002) for two possible ages of 5 Myr (thick line) and 10 Myr (dashed line) for USco, the age of the Pleiades (120 Myr; long-dashed line), and the age of field dwarfs (1 Gyr; dot-dashed line). |
| In the text | |
|
Fig. 11 Left: mass-luminosity diagram for the three eclipsing binaries identified in USco by K2: USco16m25 is represented as a black dot, UScoCTIO 5 as a green square, and HD 144588 as a red dot. Overplotted in blue are the solar-metallicity evolutionary tracks of the BT-Settl models (Baraffe et al. 2002) for two possible ages of 5 Myr (thick line) and 10 Myr (dashed line) for USco, the age of the Pleiades (120 Myr; long-dashed line), and the age of field dwarfs (1 Gyr; dot-dashed line). Right: effective temperature vs. luminosity diagram for the three USco systems with the same colour set as in the left panel. The blue dots on the 5 and 10 Myr isochrones correspond to masses of 1.4, 0.5, 0.3, and 0.1 M⊙, respectively. The size of the dots for the highest mass system represents the error bars on the measurements. |
| In the text | |
|
Fig. 12 Spectral energy distribution of USco16m25. We obtained the fluxes and their associated errors from the Spanish virtual observatory and calibrated them as incident fluxes on Earth. The wavelength ranges from the I band (7862 Å) from the DENIS survey to the WISE w2-band (4.6 microns). The solid line is the black-body fit. |
| In the text | |
Current usage metrics show cumulative count of Article Views (full-text article views including HTML views, PDF and ePub downloads, according to the available data) and Abstracts Views on Vision4Press platform.
Data correspond to usage on the plateform after 2015. The current usage metrics is available 48-96 hours after online publication and is updated daily on week days.
Initial download of the metrics may take a while.