Free Access
Fig. 4
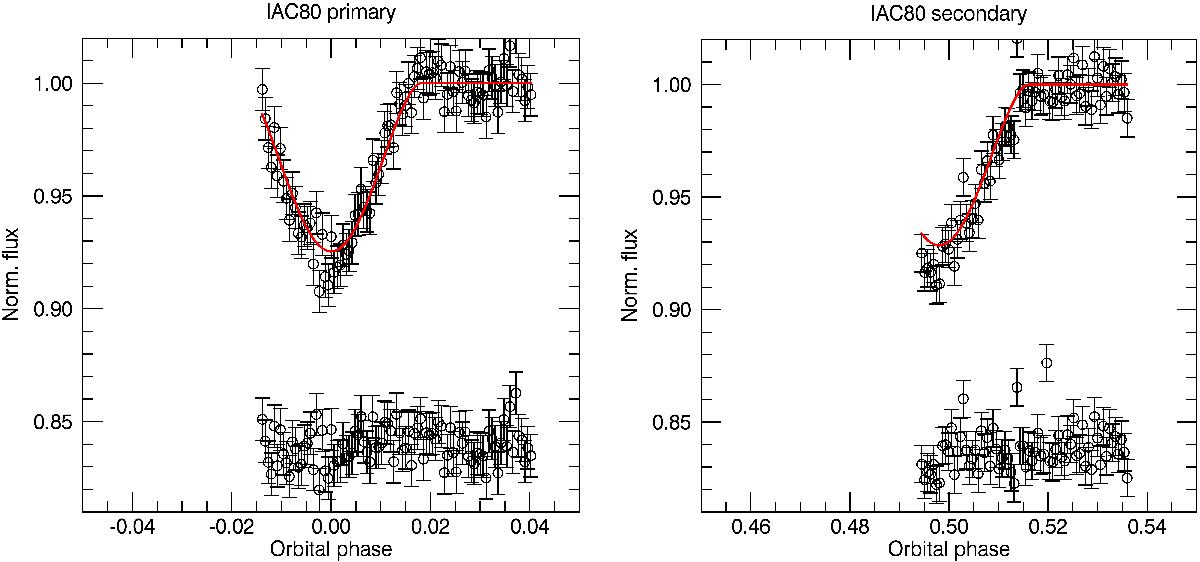
Two additional transits with different levels of completeness for USco16m25. We observed the system on the night of 18 May and 11 June 2015 in the SDSSi filter with IAC80/CAMELOT. The red line corresponds to the best-fit model to the global set of data (light curves, photometric transits, and radial velocities).
This figure is made of several images, please see below:
Current usage metrics show cumulative count of Article Views (full-text article views including HTML views, PDF and ePub downloads, according to the available data) and Abstracts Views on Vision4Press platform.
Data correspond to usage on the plateform after 2015. The current usage metrics is available 48-96 hours after online publication and is updated daily on week days.
Initial download of the metrics may take a while.