Fig. 7
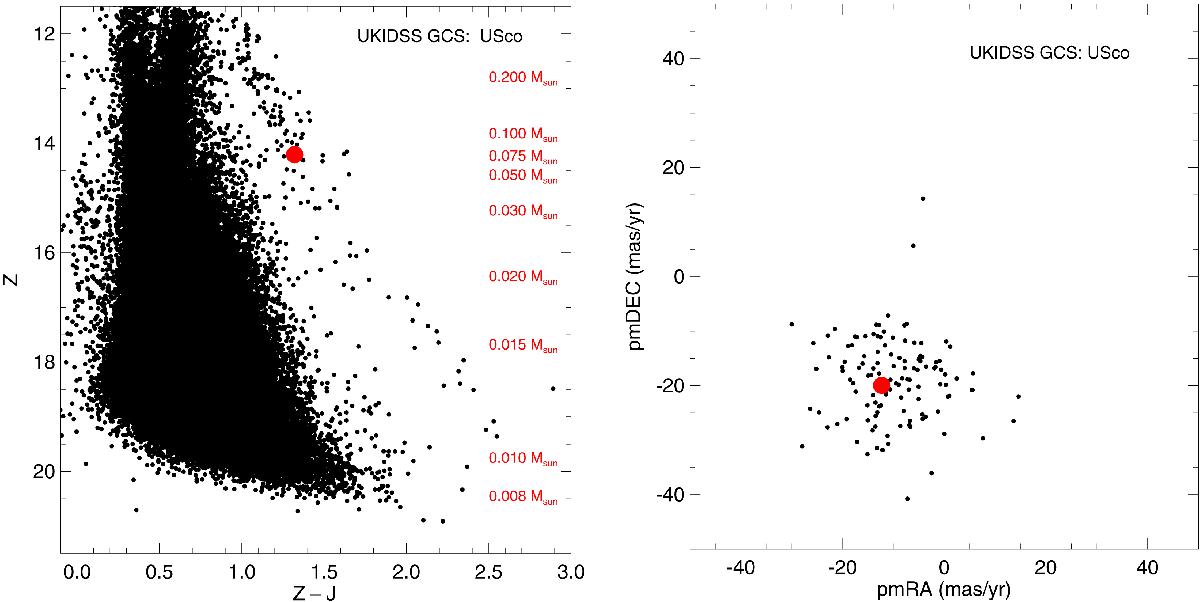
Left: (Z−J, Z) colour–magnitude diagram for 6.5 deg2 in the central region of USco (Lodieu et al. 2007). The USco cluster sequence is well separated from field stars. Right: vector point diagram. We averaged the values of the proper motion in each direction from the datasets listed in Table 1, where the error bars represent the dispersion between each catalogue. The mean proper motion of the association is (μαcosδ,μδ) ~ (−11, −25) mas/yr. Our transiting system is highlighted with a large red dot, demonstrating its photometric and astrometric membership.

Current usage metrics show cumulative count of Article Views (full-text article views including HTML views, PDF and ePub downloads, according to the available data) and Abstracts Views on Vision4Press platform.
Data correspond to usage on the plateform after 2015. The current usage metrics is available 48-96 hours after online publication and is updated daily on week days.
Initial download of the metrics may take a while.