Fig. 6
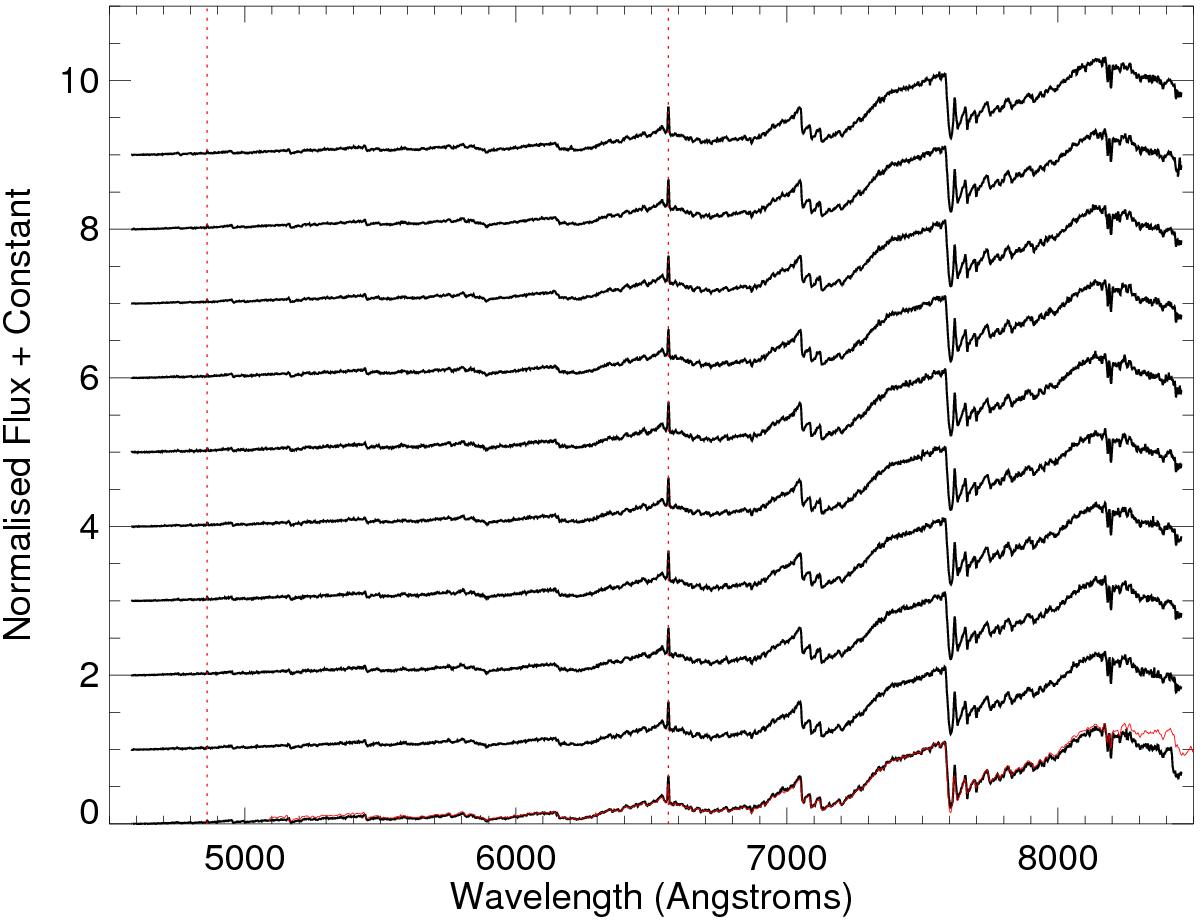
Optical spectra of USco16m25 (black) obtained with Subaru/FOCAS at a resolution of 1000. The spectra were obtained on 19 June 2015 between UT = 07h and UT = 08h24m. Overplotted in red on the bottom spectrum is the GTC/OSIRIS spectrum obtained on 2 August 2015 at a similar resolution (see left-hand side panel of Fig. 5). The red dotted vertical lines mark the positions of Hβ and Hα lines at 4861 Å and 6563 Å, respectively.
Current usage metrics show cumulative count of Article Views (full-text article views including HTML views, PDF and ePub downloads, according to the available data) and Abstracts Views on Vision4Press platform.
Data correspond to usage on the plateform after 2015. The current usage metrics is available 48-96 hours after online publication and is updated daily on week days.
Initial download of the metrics may take a while.