Fig. 3
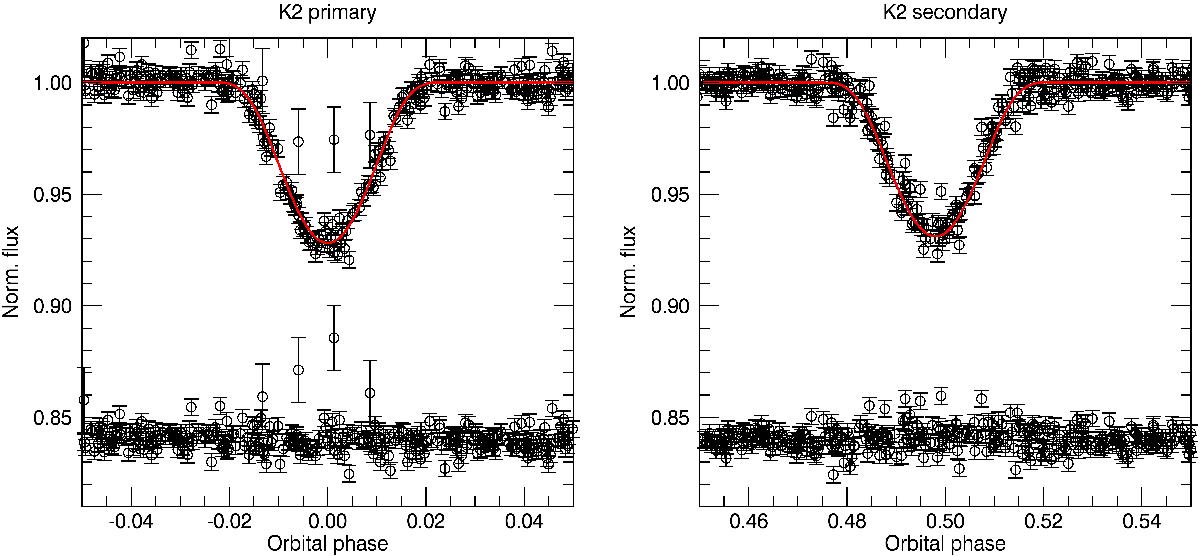
K2 light curves folded in phase and normalised to unity for the primary (left) and the secondary (right) component of USco16m25. The circles at the bottom of the plots represent the residuals between the fit (red line) and the observed transits (black circles with error bars). The error bars were estimated from the out-of-eclipse dispersion of the K2 curve, as 0.37%. The primary eclipse curve shows a few outliers during the eclipse phases; we increased the error bars of these data points (four) by an extra factor of 4 to reduce their effect on the final determined parameters. The red line corresponds to the best-fit model to the global set of data (light curves, photometric transits, and radial velocities).
Current usage metrics show cumulative count of Article Views (full-text article views including HTML views, PDF and ePub downloads, according to the available data) and Abstracts Views on Vision4Press platform.
Data correspond to usage on the plateform after 2015. The current usage metrics is available 48-96 hours after online publication and is updated daily on week days.
Initial download of the metrics may take a while.