| Issue |
A&A
Volume 584, December 2015
|
|
|---|---|---|
| Article Number | A3 | |
| Number of page(s) | 5 | |
| Section | Astronomical instrumentation | |
| DOI | https://doi.org/10.1051/0004-6361/201526503 | |
| Published online | 13 November 2015 | |
Ultra-pure digital sideband separation at sub-millimeter wavelengths
1 Astronomy Department, Universidad de Chile, Camino El Observatorio 1515, 1058 Santiago, Chile
e-mail: rfinger@u.uchile.cl
2 Electrical Engineering Department, Universidad de Chile, Avenue Tupper 2007, 1058 Santiago, Chile
3 SRON Netherlands Institute for Space Research, Postbus 800, 9700 AV Groningen, The Netherlands
4 NOVA/Kapteyn Astronomical Institute, University of Groningen, Postbus 800, 9700 AV Groningen, The Netherlands
Received: 8 May 2015
Accepted: 2 September 2015
Context. Deep spectral-line surveys in the mm and sub-mm range can detect thousands of lines per band uncovering the rich chemistry of molecular clouds, star forming regions and circumstellar envelopes, among others objects. The ability to study the faintest features of spectroscopic observation is, nevertheless, limited by a number of factors. The most important are the source complexity (line density), limited spectral resolution and insufficient sideband (image) rejection (SRR). Dual sideband (2SB) millimeter receivers separate upper and lower sideband rejecting the unwanted image by about 15 dB, but they are difficult to build and, until now, only feasible up to about 500 GHz (equivalent to ALMA Band 8). For example ALMA Bands 9 (602–720 GHz) and 10 (787–950 GHz) are currently double sideband (DSB) receivers.
Aims. This article reports the implementation of an ALMA Band 9 2SB prototype receiver that makes use of a new technique called calibrated digital sideband separation. The new method promises to ease the manufacturing of 2SB receivers, dramatically increase sideband rejection and allow 2SB instruments at the high frequencies currently covered only by DSB or bolometric detectors.
Methods. We made use of a Field Programmable Gate Array (FPGA) and fast analog-to-digital converters (ADCs) to measure and calibrate the receiver’s front end phase and amplitude imbalances to achieve sideband separation beyond the possibilities of purely analog receivers. The technique could in principle allow the operation of 2SB receivers even when only imbalanced front ends can be built, particularly at very high frequencies.
Results. This digital 2SB receiver shows an average sideband rejection of 45.9 dB while small portions of the band drop below 40 dB. The performance is 27 dB (a factor of 500) better than the average performance of the proof-of-concept Band 9 purely-analog 2SB prototype receiver developed by SRON.
Conclusions. We demonstrate that this technique has the potential of implementing 2SB receivers at frequencies where no such instruments exists, as well as improving the image rejection of current millimeter 2SB receivers to a level where sideband contamination is so low that would become negligible for any known astronomical source.
Key words: instrumentation: spectrographs / instrumentation: detectors / techniques: spectroscopic
© ESO, 2015
1. Introduction
Astronomy is one of the main drivers of high-frequency radio technology. Astronomical radio receivers have the most demanding specifications since they require very low noise, high stability and extremely large bandwidths. The ALMA observatory is the pinnacle example of such a technology driver. It has implemented 66 radio telescopes, each one with 10 observing bands covering frequencies from 35 to 950 GHz, fractional bandwidths ranging from 20 to 35%, and receiver noise temperatures just a few times above the absolute quantum limit (Wootten & Thompson 2009).
Modern single dish telescopes and arrays commonly have large collecting areas which, together with low receiver noise and high/dry locations, produce exceptional sensitivities allowing scientists to probe deeper than ever in the faintest spectroscopic features of astronomical sources. In fact, deep spectral line millimeter surveys can detect thousands of lines per band uncovering the rich chemistry of molecular clouds, star forming regions and circumstellar envelopes, among others objects (Cernicharo et al. 2013; Patel et al. 2011). For example, in 2010, Tercero et al. (2010), reported the detection of more than 14400 spectral lines in Orion-KL, observing the 80−115.5 GHz, 130−178 GHz, and 197−281 GHz bands. Lines intensities ranged from around 10 mK to almost 100 K, i.e. an intensity ratio of almost 10.000 or 40 dB.
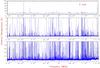 |
Fig. 1 A confusion limited spectroscopic survey of Orion-KL performed by Tercero et al. with the IRAM 30 m telescope. Taken from Tercero et al. (2010). From top to bottom the panels show the same spectrum at 3 different vertical scales. Lines intensities range from ~10 mK to almost 100 K. |
The ability to study the faintest features of spectroscopic observation is, nevertheless, limited by a number of factors. The most important are the source complexity (line density), limited spectral resolution, and insufficient sideband (image) rejection. These conditions set what is known as the confusion limit, i.e. the level below which the merging of a huge number of weak lines makes impossible any further discrimination.
For observing complex sources, as the one presented in Fig. 1, it is desirable to have single sideband (SSB) or, ideally, 2SB receivers, with sidebande rejection (SRR) in excess of 30 dB and preferably above 40 dB. Despite the clear importance of having high sideband rejection for deep spectroscopic surveys, the specifications set by ALMA for its bands 1 to 8 is only 7 dB across the band, and 10 dB for the 80% of the band (Wild & Payne 2001; Wild et al. 2002). The reason for requiring what might seems a low performance was based on the extreme difficulty of achieving higher suppressions, due to the need of keeping a flat phase and amplitude response, across wide bands at high frequencies.
Until recently 2SB receivers were only available at relatively low frequencies, below 300 GHz. ALMA pushed that limit, requiring its Band 8 (500 GHz) to be sideband separating. Nevertheless, ALMA receivers above 600 GHz (Bands 9 and 10) are double sideband (DSB) and, therefore, have limited capabilities to disentangle sources with a high line density, and a reduced sensitivity due to the noise contribution from the sideband.
A new technique that promises to ease 2SB receivers manufacturing as well as dramatically increase the sideband rejection performance has been proposed by Morgan & Fisher (2010) and implemented by Finger et al. (2013). In this approach the IF hybrid is removed, replaced by two analog-to-digital converters (ADC), and implemented in-digital within a Field Programmable Gate Array (FPGA). The digital implementation of the IF hybrid allows to calibrate-out imbalances of the analog components to achieve very high sideband rejection. The calibration of RF imbalances eases the requirements on phase flatness for RF hybrids and gain flatness for mixers and amplifiers, allowing the operation of 2SB receivers at frequencies and bandwidths where purely analog technics are impractical.
Digital receivers of this sort have been demonstrated in laboratory up to 100 GHz (Rodríguez et al. 2014a; Rodríguez 2015) showing a SRR in excess of 45 dB. This corresponds to 20 to 30 dB (a factor 100 to 1000) above state-of-the-art performance of analog 2SB receivers.
This article reports the integration of an FPGA digital sideband separating spectrometer with an ALMA Band 9 2SB prototype receiver to demonstrate, for the first time, calibrated digital sideband separation at sub-millimeter wavelengths.
2. Measurement setup and procedure
A digital sideband separating receiver was configured using as front-end an ALMA Band 9 2SB prototype receiver that uses AlN junctions as mixing elements (Khudchenko et al. 2011). The only modification respect to the original receiver was the removal of the IF hybrid to access the receiver’s I and Q channels independently. The experimental setup, shown in Fig. 2, allows the input signal to be injected into the receiver with a cold and ambient background using a beam-splitter and a chopper.
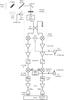 |
Fig. 2 Test setup block diagram: the front end of the receiver features an RF hybrid which splits the incoming signal into the I and Q channels. A first down-conversion to a 4–12 GHz IF band is performed using a pair of superconducting (SIS) mixers driven by an in-phase local oscillator (LO1). Cold and warm LNAs are used to boost the signal and then equalizers compensate the amplifiers gain slope. A second down-conversion to a 0–1 GHz baseband is performed using a pair of balanced mixers driven by an in-phase second local oscillator (LO2). Finally anti-aliasing filters and a last amplification stage are applied to reach optimal signal condition for the digitizers. The test source and the local oscillators are locked to the same 10 MHz reference to prevent frequency drift of the test tone during calibration. Recombination of the I and Q channels is done in the FPGA to produce the USB and LSB spectra. |
The IF outputs of the I and Q SIS mixers are amplified, equalized and then mixed again using a pair of DSB mixers and a second LO (LO2) which selects any 1 GHz segments within the 4–12 GHz range to be down-convert to the 0–1 GHz baseband. Two 1.5 GHz low pass filters are used after the second downconversion to reject out-of-band noise and spurious, as well as to prevent LO2 leakage getting into the ADCs. Since the second downconversion is DSB, noise and spurious signal coming from warm LNAs and the LO2 will not be suppressed. Sufficient gain in the cold LNAs should render the IF-chain noise contribution negligible.
The measurement procedure requires an initial calibration run which measures the amplitude and phase imbalances of the entire analog front end. These imbalances are then compensated for each spectral channel in the FPGA. The balanced I and Q mixer outputs are then recombined in a digital IF hybrid to produce two (LSB and USB) 2048 channels spectra with very high sideband rejection. After calibration a test tone is swept across the RF band and measurements are taken with ambient and cold backgrounds across the IF. The data is then used to calculate the sideband rejection using the method described in Kerr et al. (2001) which allows an SRR measurement independent of the test tone power. Details of this technique are reported in Finger et al. (2013), Rodríguez et al. (2014a,b). Typical spectra measured using the prototype ALMA Band-9 receiver, are presented in Fig. 3.
3. Factors limiting sideband rejection
There are two main effects causing the reduction in digital sideband rejection in this setup. First, the poor isolation between the RF and LO ports in the baseband mixers and within outputs in the LO2 splitter. Second, the intermodulation products of LO1 and test source harmonics. Following Fig. 2, the first issue is that the RF signal entering the baseband mixer I leaks to its LO port and is passed to channel Q through the LO2 splitter. The same happens in the opposite direction, i.e from channels Q to I. This leaked signal has the same frequency than the main RF signal on each branch, but having a different phase, it will not add up in counter-phase in the calibrated digital IF hybrid. Consequently, it will not be cancelled out. This unrejected signal is detected as a small tone in the order of −40 dBc at the same channel, in the rejected sideband (tone B in Fig. 3). Two 6 dB fixed attenuators were placed in the splitter outputs to increase isolation by an additional 12 dB. In this configuration the spurious tone is attenuated below the test setup noise floor, as seen in Fig. 3.
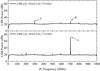 |
Fig. 3 Typical spectra for the calibrated receiver. Signals A, B and C correspond to the test tone in the pass-band, the tone in the rejected-sideband, and the highest spurious (intermodulation product) in the rejected-sideband, respectively. |
In addition to the unrejected image tone B, another spurious signal, which is caused by intermodulation of the RF test source and the first LO harmonics, can be seen (tone C in Fig. 3). They appear because the LO and RF sources are based on ×3 and ×9 multipliers and harmonics up to −20 dBc can be generated. In combination with the high nonlinearity of the SIS-mixers parasitic signals are produced. Even though these spurious signals are not limiting the suppression of the main test tone, it does limit the spurious free dynamic range of this receiver to about −45 dB. As we will explain below, it does also produce false reading of SRR when it falls into the same channel where the test tone is tuned.
Even with a perfectly clean LO, and fully isolated I and Q channels, there are others, more fundamental factors, limiting the sideband rejection than can be achieved by this technique. The most critical is the spurious free dynamic range (SFDR) of the ADC chips. For the hardware used in this experiment the average SFDR is close to 55 dB, so it is not the limiting factor here, but for lower frequency receiver, where low harmonic content and high isolation can be achieved, the ADC SFDR has been reported as the limiting factor for a usable sideband rejection (Finger et al. 2013).
Finally, numeric error due to the limited number of bits available for data representation within the FPGA and the calibration error due to the limited spectral resolution are possible limiting factors for SRR. In one hand, we have and 18+18 bits (real and imaginary) data type in the FFT, which limits the sideband rejection to about 100 dB, so it is not a practical limitation. On the other hand the calibration error depends on the gain and phase slopes to be compensated within the 1 GHz baseband. If we assume a receiver gain variation less than 3dB/GHz and a phase ripple less than 90°/GHz the limit to the SRR imposed by our 1024 points calibration is in the order of 70 dB. Both limits are considerable above the SFDR of the fast ADCs needed for this application, so the practical limit for usable SRR is imposed by ADC SFDR performance.
Summarizing, SRR could be improved by redesigning of the LO1 and RF test-source to reduce harmonic content and also modifying the LO2 splitting scheme for better I-Q isolation. I-Q isolation can be improved by adding isolators or amplifiers after the LO2 splitter. LO1 and RF-source spurious content could be reduced by adding waveguide filters after each multiplication stage. If both modifications are applied, we could improve SRR by an additional 5–10 dB where we will hit the 55 dB limit imposed by the ADCs SFDR.
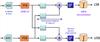 |
Fig. 4 FPGA firmware top-level block diagram. From left to right main subsystems are: ADC hardware interface, Polyphase Filter Bank (PFB), Complex vector multipliers (C1–C4), Complex Adders (+), Power blocks ()2, and vector accumulators. |
4. FPGA firmware
The ROACH-I FPGA open platform (CASPER-Berkeley 2015) was used to implement the sideband-separating spectrometer. The FPGA firmware used here, and presented schematically in Fig. 4, was similar in function to the one described in Finger et al. (2013), Rodríguez et al. (2014a,b). However, for this work, it features optimized versions of the calibration and sideband separating spectrometers. These enhanced spectrometers were implemented using a technique called floorplanning, which involves human-aided physical disposition of logical resources over the FPGA chip area, to minimize delays and equalize data paths lengths. Using this technique, faster clock speeds of those reachable by the use of automatic compilation tools can be reached. The software used to perform the floorplanning was Xilinx ISE, PlanAhead. The floorplanning strategy consisted in defining areas in the chip to target the compilation of the spectrometers different subsystems, and localize those areas in a way consistent with the data flow structure. This not only reduces data path lengths (and therefore delays) within subsystems in the chip, but also the delay-difference between parallel processing branches. The optimized design (see Fig. 5) doubled the clock frequency achievable by the automatic compilation tools, reaching an instantaneous bandwidth of 1 GHz per sideband (Alvear 2013).
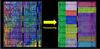 |
Fig. 5 Logic resources allocation in the FPGA (Virtex 5) chip surface before and after floorplanning. Each color represents a processing subsystem depicted in Fig. 4. Automatic place and routing algorithm implements the processing subsystems using logic resources scattered across the chip. Floorplaning optimizes resource location to minimize delay and delay-difference through the parallel processing pipeline. |
5. Results
Figure 6 shows the SRR for the entire ALMA Band-9 RF band using the technique presented above. LO1 was swept from 614 to 710 GHz with 8 GHz steps, while LO2 was swept from 4 to 11 GHz for each LO1 setting. Analog sideband rejection performance (Khudchenko et al. 2011) is shown for comparison.
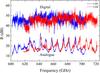 |
Fig. 6 Calibrated digital sideband rejection ratio. LO1 was swept from 614 to 710 GHz with 8 GHz steps. LO2 was swept from 4 to 11 GHz for each LO1 setting. Analogue sideband rejection performance (Khudchenko et al. 2011) is shown for comparison. |
The average performance of the digital implementation is around 45 dB while small portions of the band drop below 40 dB. The high dispersion in the data as well as the individual points that drop below the average are explained caused by strong spurious coming from LO1 and test source harmonics as seen in Fig. 7. These intermodulation products overlap the test tone fundamental frequency in the rejected band, generating false readings of the sideband rejection. These several spurious signals move in both directions when the test tone is sweep across the IF, so the overlaps with the rejected tone occur at random-looking frequencies.
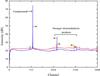 |
Fig. 7 A case of strong spurious contamination for LO1 = 686. Arrows indicate the direction of movement of each spurious signal while sweeping up the fundamental tone. |
The amplitude of such intermodulation product is highly dependent on frequency; consequently for some LO settings the dispersion and dropping points are larger than for others.
Finally, the more consistent drop of SRR measured on LSB between 620 and 630 GHz is explained by a reduction in signal to noise ratio due to a drop in the test tone power. This produces the fundamental tone to decrease in amplitude while the rejected tone was already below noise floor. It is important to mention that an integration of 134 milliseconds was used in our setup. More integration time would help SRR measurements in this part of the band.
6. On the calibration stability
Thermal stability of the calibration has been demonstrated in Finger et al. (2013) by thermal cycling the IF plate by 10 K for three times with no measurable degradation of SRR. In this work, the RF part of the receiver is inside a cryostat with very good (0.1 K) thermal stability so we do not see a need of recalibrating the receiver due to thermal stability. Stability of the calibration after SIS mixers defluxing can be partially estimated from the work of Bout et al. (2008), where SIS junctions were subjected to 40 defluxing cycles with very minor changes in conversion characteristics, warrantying a stability better than 0.1 dB for AlN junctions. This stability ensures an SSR above 40 dB without a new calibration. SIS phase delay stability after defluxing has not been particularly evaluated in published works, but ALMA and other observatories, which use analogue 2SB SIS receivers, have not reported significant SRR degradation to our knowledge, which suggest that phase delay of SIS junction do not change by important amounts. Therefore, we considered that recalibration will not be needed frequently and probably recalibration after each cryostat thermal cycle would be sufficient.
7. Conclusions
An ALMA Band-9 2SB prototype mixer was integrated with a digital sideband separating spectrometer based on FPGA. After calibration, full RF/IF band measurements were performed achieving an average sideband rejection of 45.9 dB and above 40 dB for 93% of the band. Although some frequency points dropped below 35 dB, this is explained as limitations of the test setup and LO1 source purity. Therefore, the digital receiver performance exceeded the analog receiver SRR by 27 dB on average.
The achieved SRR is high enough so that sideband contamination becomes negligible for any known astronomical application.
The ability of calibrating this sub-millimeter receiver achieving very high sideband rejection suggests that higher frequency 2SB receivers might be implemented using this technique, reaching image rejection levels otherwise impossible by purely analog means.
The measurements have also shown that to observe complex sources with line intensity ratios in excess of 30 dB, LO cleanness might be an issue at sub-millimeter wavelengths.
Even though the instantaneous bandwidth of this digital receiver is 1 GHz per sideband, scaling the bandwidth up has no conceptual limitations and involves only stacking several digital boards.
Acknowledgments
This work has been possible thanks to the support of CONICYT through the funds CATA-Basal PFB06 and FONDECYT 11140428 and 1121051. We also thank Xilinx Inc. for the donation of FPGA chips and software licenses as well as the whole CASPER community for its invaluable support.
References
- Alvear, A. 2013, Extensión del Ancho de Banda de Espectrómetros Radio Astronómicos Basados en FPGA, Tech. Rep., Pontificia Universidad Católica de Valparaíso, memoria para optar al Título de Ingeniero Civil Eléctrico [Google Scholar]
- Bout, J., Baryshev, A., Barkhof, J., et al. 2008, in 19th Int. Symp. on Space Terahertz Technology, Groningen, 28–30 April [Google Scholar]
- CASPER-Berkeley 2015, https://casper.berkeley.edu/ [Google Scholar]
- Cernicharo, J., Daniel, F., Castro-Carrizo, A., et al. 2013, ApJ, 778, L25 [Google Scholar]
- Finger, R., Mena, P., Reyes, N., Rodriguez, R., & Bronfman, L. 2013, PASP, 125, 263 [NASA ADS] [CrossRef] [Google Scholar]
- Kerr, A. R., Pan, S.-K., & Effland, J. E. 2001, ALMA Memo #357 – Sideband Calibration of Millimeter-Wave Receivers, Tech. Rep., NRAO [Google Scholar]
- Khudchenko, A., Hesper, R., Baryshev, A., et al. 2011, in 22nd Int. Symp. on Space Terahertz Technology, Tucson, 26–28 April [Google Scholar]
- Morgan, M. A., & Fisher, J. R. 2010, PASP, 122, 326 [NASA ADS] [CrossRef] [Google Scholar]
- Patel, N. A., Young, K. H., Gottlieb, C. A., et al. 2011, ApJS, 193, 17 [NASA ADS] [CrossRef] [Google Scholar]
- Rodríguez, R. 2015, Ph.D. Thesis, Universidad de Chile [Google Scholar]
- Rodríguez, R., Finger, R., Mena, F. P., et al. 2014a, PASP, 126, 380 [NASA ADS] [CrossRef] [Google Scholar]
- Rodríguez, R., Finger, R., Mena, F. P., Bronfman, L., & Michael, E. A. 2014b, in Millimeter, Submillimeter, and Far-Infrared Detectors and Instrumentation for Astronomy VII, eds. W. S. Holland, & J. Zmuidzinas, SPIE Proc., 9153, 91532E [Google Scholar]
- Tercero, B., Cernicharo, J., Pardo, J. R., & Goicoechea, J. R. 2010, A&A, 517, A96 [NASA ADS] [CrossRef] [EDP Sciences] [Google Scholar]
- Wild, W., & Payne, J. 2001, ALMA Specification: Specifications for the ALMA Front End Assembly, Tech. Rep., NRAO [Google Scholar]
- Wild, W., Payne, J., Lamb, J. W., et al. 2002, ALMA Construction Project Book, Tech. Rep., NRAO [Google Scholar]
- Wootten, A., & Thompson, A. R. 2009, Proc. IEEE, 97, 1463 [NASA ADS] [CrossRef] [Google Scholar]
All Figures
|
Fig. 1 A confusion limited spectroscopic survey of Orion-KL performed by Tercero et al. with the IRAM 30 m telescope. Taken from Tercero et al. (2010). From top to bottom the panels show the same spectrum at 3 different vertical scales. Lines intensities range from ~10 mK to almost 100 K. |
| In the text | |
|
Fig. 2 Test setup block diagram: the front end of the receiver features an RF hybrid which splits the incoming signal into the I and Q channels. A first down-conversion to a 4–12 GHz IF band is performed using a pair of superconducting (SIS) mixers driven by an in-phase local oscillator (LO1). Cold and warm LNAs are used to boost the signal and then equalizers compensate the amplifiers gain slope. A second down-conversion to a 0–1 GHz baseband is performed using a pair of balanced mixers driven by an in-phase second local oscillator (LO2). Finally anti-aliasing filters and a last amplification stage are applied to reach optimal signal condition for the digitizers. The test source and the local oscillators are locked to the same 10 MHz reference to prevent frequency drift of the test tone during calibration. Recombination of the I and Q channels is done in the FPGA to produce the USB and LSB spectra. |
| In the text | |
|
Fig. 3 Typical spectra for the calibrated receiver. Signals A, B and C correspond to the test tone in the pass-band, the tone in the rejected-sideband, and the highest spurious (intermodulation product) in the rejected-sideband, respectively. |
| In the text | |
|
Fig. 4 FPGA firmware top-level block diagram. From left to right main subsystems are: ADC hardware interface, Polyphase Filter Bank (PFB), Complex vector multipliers (C1–C4), Complex Adders (+), Power blocks ()2, and vector accumulators. |
| In the text | |
|
Fig. 5 Logic resources allocation in the FPGA (Virtex 5) chip surface before and after floorplanning. Each color represents a processing subsystem depicted in Fig. 4. Automatic place and routing algorithm implements the processing subsystems using logic resources scattered across the chip. Floorplaning optimizes resource location to minimize delay and delay-difference through the parallel processing pipeline. |
| In the text | |
|
Fig. 6 Calibrated digital sideband rejection ratio. LO1 was swept from 614 to 710 GHz with 8 GHz steps. LO2 was swept from 4 to 11 GHz for each LO1 setting. Analogue sideband rejection performance (Khudchenko et al. 2011) is shown for comparison. |
| In the text | |
|
Fig. 7 A case of strong spurious contamination for LO1 = 686. Arrows indicate the direction of movement of each spurious signal while sweeping up the fundamental tone. |
| In the text | |
Current usage metrics show cumulative count of Article Views (full-text article views including HTML views, PDF and ePub downloads, according to the available data) and Abstracts Views on Vision4Press platform.
Data correspond to usage on the plateform after 2015. The current usage metrics is available 48-96 hours after online publication and is updated daily on week days.
Initial download of the metrics may take a while.