| Issue |
A&A
Volume 583, November 2015
Rosetta mission results pre-perihelion
|
|
|---|---|---|
| Article Number | A27 | |
| Number of page(s) | 11 | |
| Section | Planets and planetary systems | |
| DOI | https://doi.org/10.1051/0004-6361/201526671 | |
| Published online | 30 October 2015 | |
Far-UV phase dependence and surface characteristics of comet 67P/Churyumov-Gerasimenko as observed with Rosetta Alice
1
Department of AstronomyUniversity of Maryland, College Park, MD
20742, USA
e-mail: feaga@astro.umd.edu
2
Southwest Research Institute, Boulder, CO
80302,
USA
3
LATMOS, CNRS/UVSQ/IPSL, 78280
Guyancourt,
France
4
Department of Physics and Astronomy, Johns Hopkins
University, Baltimore, MD
21218,
USA
5
Johns Hopkins University Applied Physics Laboratory,
Laurel, MD
20723,
USA
Received: 4 June 2015
Accepted: 7 October 2015
Aims. The Alice far-ultraviolet (FUV) spectrograph onboard Rosetta has, for the first time, imaged the surface of a comet, 67P/Churyumov-Gerasimenko (67P), in the FUV. With spatially resolved data, the nucleus properties are characterized in the FUV, including phase dependence, albedo, and spectral slope. Regional measurements across the nucleus are compared to discern any compositional variations.
Methods. Hapke theory was utilized to model the phase dependence of the material on the surface of 67P. The phase dependence of 67P was derived from a subset of data acquired at various phase angles in November 2014, within 50 km of the comet such that the nucleus was spatially resolved. The derived photometric correction was then applied to a different subset of spatially resolved data sampling several distinct geographical regions on the nucleus acquired in August−November 2014 under similar viewing geometries.
Results. In the FUV, the surface of 67P is dark, blue sloped, has an average geometric albedo of 0.054±0.008 at 1475 Å near the center of the Alice bandpass, and is mostly uniform from region to region, with the exception of the Hatmehit region, which is slightly more reflective. These results are consistent with the suggestion made by the Rosetta OSIRIS and VIRTIS teams that the surface of 67P is covered with a homogeneous layer of material and that surface ice is not ubiquitous in large abundances. The modeled Hapke parameters, specifically the single scattering albedo (w) and the asymmetry factor (ζ), are determined to be 0.031 ± 0.003 and −0.530 ± 0.025 near the center of the Alice bandpass at 1475 Å. These parameters are consistent with measurements of other comet nuclei that have been observed by flyby missions in the visible and the near-infrared regimes.
Key words: comets: individual: 67P/Churyumov-Gerasimenko / techniques: spectroscopic
© ESO, 2015
1. Introduction
Rosetta, the European Space Agency’s cornerstone planetary mission, launched in 2004 and set out on an ambitious exploration of comet 67P/Churyumov-Gerasimenko (67P). All previous missions to comets have been fly-bys (Soderblom et al. 2002; Brownlee et al. 2004; A’Hearn et al. 2005, 2011; Veverka et al. 2013); Rosetta is equipped with 12 scientific instruments on the orbiter spacecraft (and 10 more on the lander) and will escort 67P for more than a year around its orbit from 3.6 AU through perihelion and beyond (Glassmeier et al. 2007). The bi-lobed nucleus of 67P will be globally characterized using measurements and techniques in the far-ultraviolet (FUV) through the sub-millimeter wavelength regimes. These measurements have already achieved unprecedented spatial resolution of a cometary nucleus and its coma, and will continue to document variability across the comet and throughout its environment with heliocentric distance. For the first time, the morphology and composition of the nucleus and coma, their volatile content and development of activity, and evolution of the surface-coma interface will be studied in great detail.
Alice, part of the Rosetta orbiter instrument suite (Stern et al. 2007), is a low-power, lightweight imaging spectrograph designed primarily to determine the onset of activity, production rates, and distribution of the primary volatiles (H2O, CO2, and CO), search for and inventory noble gases in the near nucleus coma, and document the atomic budget of the coma as a function of time. Secondarily, Alice will study the properties of small grains in the FUV, search for variability in ionic emissions in the coma and ion tail, and characterize the nuclear surface in the FUV, including mapping the distribution of FUV absorbers on the surface (e.g. water ice, iron bearing minerals, etc.) and deriving FUV photometric properties of the nucleus. Alice is the first FUV instrument ever to fly in the inner coma of a comet and to acquire surface spectra of a comet’s nucleus, otherwise shrouded by the coma and not visible to Earth-based observatories.
For the initial FUV coma results from Alice, including the detection and interpretation of the relative line intensities of H i, O i, and C i, dissociation products of H2O, CO2, and CO, see Feldman et al. (2015). Stern et al. (2015) reported on 67P’s globally averaged FUV spectrum from Alice, revealing a dark surface with a blue spectral slope, fit well with tholins, and no obvious absorption signature from water ice. In this paper, we will focus on the FUV surface properties derived from data in which the comet was spatially resolved, acquired up through the week of the Philae lander delivery (November 12, 2014). The observing geometry around lander delivery makes it possible to study the phase dependence of the bidirectional reflectance of the surface material in the FUV, a trend never measured before in the FUV but determined in the visible and near-infrared regimes for a sampling of comets (Li et al. 2013b; Fornasier et al. 2015; Ciarniello et al. 2015). With a photometric correction for the bidirectional reflectance at hand, a geometric albedo for 67P will be calculated and regional surface spectra of the nucleus corrected for viewing geometry will be compared to search for differences in reflectivity across the nucleus.
Visible observations of 67P from the Rosetta’s Optical, Spectroscopic, and Infrared Remote Imaging System (OSIRIS), show a dark, overall uniformly colored nucleus, excepting the Hapi neck region, with an average geometric albedo of 5.9%±0.2% at 550 nm and 6.5%±0.2% at 649 nm (Sierks et al. 2015; and Fornasier et al. 2015, respectively). Some small bright icy outcrops exist on the surface in higher resolution OSIRIS data, possibly recently uncovered or deposited at the surface (Pommerol et al. 2015). Similarly, large-scale compositional homogeneity and a low albedo of 6.0%±0.3% at 550 nm, with localized variability mainly in the neck, is evident in the Rosetta Visual IR Thermal Imaging Spectrometer (VIRTIS) spectral data (Capaccioni et al. 2015; Ciarniello et al. 2015) with spectral detections of water ice absorptions in select regions near shadowed areas. These data suggest that a dark refractory layer is widespread across the surface of the nucleus with very little ice content. Here we investigate whether these properties are also observed in the FUV with the spatially resolved Alice data and report on our findings.
2. Observations
The details of the Alice instrument are described in Stern et al. (2007), with key specifications noted here. The FUV wavelength range of the detector, 700−2050 Å, is spanned by 1024 pixels, and 20 spatial channels (of 32 on the detector) span the 5.5° long entrance slit at every wavelength. The slit is shaped like a dog bone with the central third of the slit half as narrow as the two ends, 0.05° and 0.1° wide, respectively. Each of Alice’s narrow pixels subtends a solid angle of 4.69 × 10⁻⁶ sr, while each of the wide pixels subtends a solid angle of 9.38 × 10⁻⁶ sr. Whenever the Rosetta spacecraft is within ~50 km from the comet, the longest axis of the nucleus (~4 km) approximately fills (or overfills if much closer) the length of the Alice slit (Fig. 1) and is observed on all 20 detector pixels (each 0.3° long) that are exposed by instrument design during observations, resulting in a spatial resolution along the slit of ~250 m/pixel (or better if closer than 50 km). At these distances, in the direction perpendicular to the slit, the nucleus always overfills the slit and only a sliver of the nucleus is imaged.
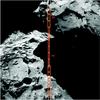 |
Fig. 1 NAVCAM context image when Rosetta was 30 km away from 67P on 11 November 2014 at 15:45 UT. The position of the Alice slit is indicated in white and orange with the approximate location of rows 8, 14, and 20 annotated for reference. In this example, row 8 is imaging a well-illuminated surface region, while central rows of the slit are looking at shadowed regions of the surface. |
Data set parameters for the phase dependence derivation.
Data set parameters for the regional surface property analysis.
The strategy for observing the surface of 67P with Alice utilizes the Histogram mode of the instrument, which produces a one-dimensional spatial image along the slit at each of 1024 FUV wavelengths as the nucleus fills the slit. In order to achieve two-dimensional spatial coverage, the Alice slit is either scanned across the nucleus in a direction perpendicular to the length of the slit or kept approximately nadir pointed to stare at the nucleus as it rotates under the field of view. Depending on the planned trajectory, viewing geometry, and distance from the comet, a scan or stare observation is designed and the exposure time is set to either 10 min for low spatial resolution data or 5 min for the highest expected spatial resolution data. Proximal orbits early in the rendezvous with 67P (August 2014) achieved spacecraft to comet distances of ~50 km at intermediate phase angles (30−50°). In September, the spacecraft to comet altitudes were reduced and in October a month of close observations were acquired from a distance of ~10 km, but with the spacecraft in a terminator orbit. By definition, these high-resolution data were at high phase angles of ~90°. During the month of November around the time of lander delivery, the spacecraft traveled between ~30 km and ~15 km then receded again from the comet, and passed through a wide range of phase angles between ~10° and ~90°. Zero-phase angle data were not acquired in the August through November 2014 time period and are thus not analyzed in this paper.
In order to complete an analysis of the phase dependence of the surface of 67P in the FUV, the November 2014 data spanning many phase angles are optimal. On the other hand, for best results when comparing regional spectra of 67P in search of variability and heterogeneities in the composition of the surface, data of the illuminated hemisphere acquired at similar viewing geometries with lower phase angles have higher signal to noise and are therefore more ideal.
We report here on data from Rosetta’s escort of 67P at heliocentric distances of 3.4 AU down to 3 AU. At these heliocentric distances, in combination with the cometocentric distances, there is very little coma contamination in the spectra. During this time period, Alice collected data regularly, but only subsets of the data meet the criteria laid out below for each of our analyses: determining the phase dependence and completing a comparative mineralogical study. All of the Alice calibrated data were produced using a typical data reduction algorithm and run through the automated Alice pipeline (Stern et al. 2007). The geometries of the observations were calculated and recorded in the data files for each Alice pixel along the slit based on SPICE kernels and the shape model derived by the OSIRIS team (SHAP5; Jorda et al. 2015).
For the phase analysis, we utilize a subset of data with phase angle coverage from ~10°−90°, and thus an inherently large range of solar incidence and emergence angles. As part of the selection, we restrict the incidence and emergence angles to be <60° (Table 1) to avoid limb darkening effects. In contrast, for the mineralogical study, we require that the subset of Alice data selected for the analysis samples various regions of terrain on the nucleus of 67P and were acquired at similar viewing geometries and spacecraft distances from the comet (Table 2). Specifically, the phase angles are restricted to 35°−40°, and the solar incidence and emergence angles are required to be <40° for best comparison among spectra. In both cases, the nucleus is resolved and each Alice pixel contains a well-illuminated patch of the surface. In the case of the phase dependence derivation, typically only one Alice spatial pixel per exposure meets all the predefined requirements simultaneously. In addition, using a single pixel per exposure retains the most precise geometric information. Whereas, in the case of the regional mineralogical study, two neighboring Alice spatial pixels typically cover the same region in any given exposure, meet the geometric requirements set forth, and are averaged together for the analysis. To increase signal to noise for both studies, four consecutive 10-min exposures covering the same regional area on the surface are averaged together using a resistant mean, where data outliers beyond 2.5 sigma from the mean are excluded. When averaging the four exposures, a range of viewing geometries are combined; the phase angle coverage within each average has a very small range (less than 1.5° from the mean of the exposures), but the spread of the solar incidence and emergence angles is larger (reaching up to 20° from the mean but more commonly a deviation less than 10°). Similarly, up to 30° swaths of longitude and latitude are averaged together, but always carefully chosen to stay within the same local region on the nucleus. Only the average values of the phase angle, solar incidence angle, emergence angle, longitude, and latitude for each of the combined 40-min observation sets are listed in Tables 1 and 2.
3. Results
As the Rosetta data of 67P encompass widely varying viewing geometries, we will first establish if there is a phase dependence of the surface in the FUV such that the rest of the observations can be photometrically corrected before they are analyzed and compared.
3.1. Phase dependence
We start by investigating instrumental effects across the Alice detector to see if observing the comet in different pixels will have any effect on our analysis. We also examine the subset of data in Table 1 to see if there appears to be any obvious large-scale variations across the nucleus at the Alice spatial resolutions, since observations of a single location on the nucleus spanning all phase angles do not exist at this time for the determination of phase dependence. The comparison of data from two different pixels, one in the wide part of the slit (row 20) and one in the narrow part of the slit (row 14), at similar phase (~12°) and longitudes (~170°) but different latitudes (~+18° and near the equator, respectively), is shown in Fig. 2a. The spectral shape and absolute fluxes are very similar for both observations, well within the uncertainties of the data. In Fig. 2b, even less difference can be seen between the two compared spectra; the wide pixel (row 8) and narrow pixel (row 14) include data from ~70° phase and similar positive latitudes (~+25°), but different longitudes (~232° and ~186°, respectively). The data in Fig. 2 show a dependence on phase angle, but not on location on the detector or location on the nucleus. Combining these results with those from other Rosetta instruments suggesting a relatively homogeneous layer of material covering the surface of 67P at the spatial resolution of these Alice data (Sierks et al. 2015; Capaccioni et al. 2015), we proceed with the phase dependence derivation assuming that the bulk surface properties are the same across the nucleus and the pixels along the detector are well calibrated such that a mix of viewing geometries and detector pixels can be used in the analysis without adversely affecting the results. This hypothesis will be corroborated by the analysis presented in Sect. 3.3.
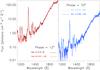 |
Fig. 2 a) Flux comparison between data in row 14 and row 20, both at ~12° phase and ~170° longitude but different latitudes (~0° and ~+18°, respectively) and b) comparison between row 8 and row 14, data at ~70° phase observing similar positive latitudes (~25°), but different longitudes (~232° and ~186°, respectively). Both comparisons show very little difference (well within the uncertainties of the data) between the spectra at similar phase angles; but a statistically significant difference, up to a factor of ~10, between the different phase angles sampled in the two panels. |
Now that we have established that all of the data in Table 1 can be intercompared and used for this part of the analysis, it is important to determine whether to model the surface of 67P as a Lambert surface (diffuse surface) or as a more complicated scattering surface. Figure 3 displays all of the spectra utilized in the phase dependence derivation. As expected, it is quite clear that without any correction, the absolute flux (photons cm-2 s-1 Å-1) detected from the nucleus of 67P is strongly dependent on geometry and appears at first glance to be a function of phase angle. As the phase angle decreases, the measured fluxes are consistently brighter at all wavelengths by up to a factor of ten. We do not interpret the observed discrepancy among the spectra in Fig. 3 as due to incident angle alone, even though the actual illuminating solar flux per unit area falling on 67P is modified by a multiplicative factor of the cosine of the incidence angle. Considering that we have restricted the solar incidence angle of the data listed in Table 1 to be <60°, the contribution of the cosine of the incidence angle can account for a factor of two at most, not a factor of ten as seen in the data (Fig. 3).
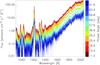 |
Fig. 3 Alice flux spectra for all data detailed in Table 1. These data are used to determine the phase dependence for the surface of 67P. From red down to purple, the phase angles of the observations increase. One-sigma error bars are included. |
In Fig. 4, viewing geometry corrections are first
considered and confirm that the incidence angle is not responsible for the variation
across the spectra. The reflectance factors are plotted for each of the flux spectra in
Fig. 3. The reflectance factor takes into account the
solar incidence angle (i) only. As defined in Hapke (1993), the reflectance factor (r) is derived as
follows: 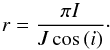 (1)The Alice flux measured in any given pixel
(units of photons cm-2 s-1 Å-1) is converted to power per unit area per wavelength
per unit solid angle to achieve I, the radiance of 67P measured by Alice.
The solar irradiance, J (in units of power per unit area per wavelength),
is available from the TIMED SEE database1 (Woods et al. 2005). TIMED SEE collects daily solar
spectra from 1 AU, and thus the solar irradiance needs to be corrected for the square of
the heliocentric distance of the comet. Because the Alice data in Table 1 were acquired in November 2014, the solar data
extracted from the TIMED SEE database and used in this part of the analysis are averaged
over the month of November in order to remove small-scale solar variability that would
introduce noise to the analysis. Once the solar irradiance is divided out, a slight trend
with wavelength for a blue slope becomes apparent (Fig. 4). Note that the SEE data span the wavelengths from ~260−1875 Å, so for the remaining figures in the
paper where the SEE data have be used to derive the plotted data, the wavelength axis is
truncated at 1850 Å rather than the full Alice coverage, to avoid asymptotes when
dividing by missing data.
(1)The Alice flux measured in any given pixel
(units of photons cm-2 s-1 Å-1) is converted to power per unit area per wavelength
per unit solid angle to achieve I, the radiance of 67P measured by Alice.
The solar irradiance, J (in units of power per unit area per wavelength),
is available from the TIMED SEE database1 (Woods et al. 2005). TIMED SEE collects daily solar
spectra from 1 AU, and thus the solar irradiance needs to be corrected for the square of
the heliocentric distance of the comet. Because the Alice data in Table 1 were acquired in November 2014, the solar data
extracted from the TIMED SEE database and used in this part of the analysis are averaged
over the month of November in order to remove small-scale solar variability that would
introduce noise to the analysis. Once the solar irradiance is divided out, a slight trend
with wavelength for a blue slope becomes apparent (Fig. 4). Note that the SEE data span the wavelengths from ~260−1875 Å, so for the remaining figures in the
paper where the SEE data have be used to derive the plotted data, the wavelength axis is
truncated at 1850 Å rather than the full Alice coverage, to avoid asymptotes when
dividing by missing data.
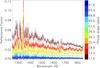 |
Fig. 4 Similar to Fig. 3, but with the Alice flux spectra converted to reflectance factors. The plot range is from 1250−1850 Å rather than the larger wavelength coverage in Fig. 3 in order to focus on the spectral region not contaminated by the strong Hydrogen Lyman series of emissions at shorter wavelengths and to avoid the longer wavelengths where there are no TIMED SEE solar data. Accounting for the solar incidence angle, it is clear that the surface of 67P does not behave like a Lambertian as there still exists a strong dependence on phase. Note that the spectrum corresponding to 11.5° stands out above all the rest of the data due in part to its relatively high solar incidence angle and low phase angle, whereas the spectra corresponding to 25.4° and 29.2° appear to be flipped in the reflectance trend because of their relatively similar phase angles, but much different solar incidence angles. |
As anticipated, a substantial trend with phase angle still exists in the data in Fig. 4 after accounting for the solar incidence angle, with the brightest reflectance factors occurring in the lowest phase angle and the faintest corresponding to phase angles near 90°. Therefore, 67P cannot be treated simply as a Lambert surface. We conclude that the remaining discrepancies are a result of phase angle effects, which need to be accounted for prior to deriving surface and albedo properties of various regions.
In order to characterize 67P’s surface phase function, we model our measurements,
converted into bidirectional reflectance (I/J with units
of sr-1; Fig. 5), employing Hapke theory (Hapke 1993) with the formulas and assumptions described here in detail.
We aim to compare our analysis with that completed for other comets, and thus chose to
adopt similar equations and assumptions to match the analysis of Li et al. (2007a,b, 2009, 2013a,b) for comets Tempel 1, Borrelly,
Wild 2, and Hartley 2. The bidirectional reflectance,
r(i,e,g), of a planar,
semi-infinite, particulate medium illuminated by collimated radiation from solar incidence
angle i, observed at emergence angle e, and phase angle
g, is
approximated by: ![\begin{equation} \label{eq:2} r(i,e,g) = \frac{I}{J} \!=\! \frac{w}{4\pi} \frac{\mu_0}{\mu_0+\mu} \left[\left[1 + B(g)\right]p(g) \!+ \!H(\mu_0)H(\mu) \!-\! 1\right], \end{equation}](/articles/aa/full_html/2015/11/aa26671-15/aa26671-15-eq17.png) (2)where w is the single scattering
albedo, μ0 = cos(i), and
μ =
cos(e).
(2)where w is the single scattering
albedo, μ0 = cos(i), and
μ =
cos(e).
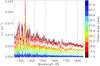 |
Fig. 5 Similar to Fig. 4, but converted to bidirectional reflectance (I/J) as defined in Hapke (1993) rather than reflectance factor. Vertical dotted lines indicate the two regions between 1425−1525 Å and 1700−1800 Å where little to no coma nor strong solar lines contaminate the spectra and are thus used to calculate the broadband flux averages in the phase dependence derivation. |
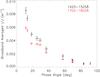 |
Fig. 6 Average I/J values over the wavelength ranges 1425−1525 Å (black) and 1700−1800 Å (red) for all phase angles listed in Table 1. |
Equation (2) accounts for the
shadow-hiding opposition effect. The function B(g) is the backscatter
function and is given by: 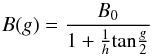 (3)where B0 and h are
related to the amplitude and angular width of the opposition effect, respectively. Because
there are not sufficient Alice data at low phase angles to model the opposition surge
effect fully at this time, the opposition parameters are assumed. Similar to Li et al. (2013b) and Clark et al. (2002), we assume B0 and h equal to
1 and 0.01, respectively.
(3)where B0 and h are
related to the amplitude and angular width of the opposition effect, respectively. Because
there are not sufficient Alice data at low phase angles to model the opposition surge
effect fully at this time, the opposition parameters are assumed. Similar to Li et al. (2013b) and Clark et al. (2002), we assume B0 and h equal to
1 and 0.01, respectively.
We model anisotropic scattering by means of the Henyey-Greenstein phase function,
p(g):  (4)where ζ is the cosine asymmetry
factor. Finally, the refined Chandrasekhar H-function approximation as defined in Hapke (2002) is used:
(4)where ζ is the cosine asymmetry
factor. Finally, the refined Chandrasekhar H-function approximation as defined in Hapke (2002) is used: ![\begin{equation} \label{eq:5} H(x) = \left[1 - wx(r_0 + \left(\frac{1 - 2r_0x}{2}\right)\ln\left(\frac{1 + x}{x}\right)\right]^{-1} \end{equation}](/articles/aa/full_html/2015/11/aa26671-15/aa26671-15-eq23.png) (5)where r0 = (1−γ)/(1 +
γ) and
(5)where r0 = (1−γ)/(1 +
γ) and  .
.
All of the parameters in this set of equations are known, i.e., measured at the time of data acquisition or assumed, except for the single scattering albedo (w) and the asymmetry factor (ζ). We now fit Alice broadband I/J data in phase space with the above formulation for the bidirectional reflectance, r(i,e,g), and solve for the two unknown parameters, w and ζ.
In order to increase signal to noise but still search for variations in the phase dependence with wavelength, broadband (100 Å wide) I/J values are calculated for all phase angles sampled in Table 1 (Fig. 6). We again use an outlier resistant average and propagate the measurement uncertainties. The wavelength ranges (1425−1525 Å and 1700−1800 Å) avoid most strong cometary (Feldman et al. 2015) and solar emission lines in the FUV and will be used here and in future surface analyses once cometary activity increases. Furthermore, the combination of small distances to the comet with nadir pointing and large heliocentric distances removes most of the foreground coma, thus the contribution of cometary emission lines is negligible in the broadband averages in the data presented here. In doing this, the data have very high signal to noise in the given bandpasses and the 3σ uncertainties of the data are a few percent. Error bars for the selected phase angles are determined by the range of phase angles sampled by an Alice pixel in the 40 min of consecutive exposures used for each measurement and entry in Table 1. Within the 40 min, the phase does not vary by more than 1.5°.
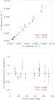 |
Fig. 7 a) Measured broadband averaged I/J values plotted against the best-fit modeled I/J values for all phase angles analyzed. b) Ratio of the measured I/J values to best-fit modeled values plotted against phase angle. In both panels, the error bars correspond to the uncertainties in the measured I/J values, with no error bars plotted for the model. |
The parameter values for w and ζ listed in Table 3 are derived from the best χ2 model fit of the dependence of the bidirectional reflectance on phase angle for the two FUV wavelength regimes. The error bars listed correspond to a 68% confidence level in the minimum χ2 method. The measured versus modeled I/J values are shown in Fig. 7.
3.2. Photometric correction
Following Clark et al. (2002), the formulation for
applying the photometric correction (i, e, and
g all equal
to 0°) to the bidirectional
reflectance is: 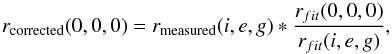 (6)where rfit is the reflectance
modeled substituting the values of w and ζ reported in Table 3 into Eq. (2). In Fig. 8a, the broadband averaged bidirectional reflectance
measurements (I/J) from Fig. 6 are plotted with wavelength and are photometrically corrected in Fig.
8b. The photometric correction brings all of the
data to a higher absolute value of I/J, removes the
clear phase dependence trend visible in Fig. 5, and
achieves consistency across the data set within the error bars. The propagated error bars
on the overall photometric correction include the errors on the observed measurements of
I/J and the derived errors on w and ζ, and are around 15%.
Inherent to the data (e.g., Figs. 5 and 8a) but not quantified prior to applying the photometric
correction, a blue slope is seen in Fig. 8b. A
measure of that spectral slope, i.e., the amount of change in the bidirectional
reflectance across wavelength range, results in a value of −63% per 1000 Å at zero phase in the FUV
wavelength region between 1425 Å and 1800 Å. This is considered to be blue sloped because
of the decrease with increasing wavelength and is consistent with the derived values of
the single scattering albedo, w, which also decreases from 1425−1525 Å to 1700−1800 Å (Table 3). While a blue slope may be suggestive of water ice on the surface in
this finite FUV region as seen in the laboratory (Hapke et
al. 1981; Wagner et al. 1987), using Hapke
modeling as in Hendrix & Hansen (2008) it has
also been shown that the water ice spectrum is expected to have a red slope at these
wavelengths due to the location of the edge of the FUV cut-off if water ice were present.
Therefore, the FUV blue slope alone is inconclusive with respect to the presence of water
ice. It is noteworthy that the blue slope and its magnitude is comparable to that seen in
the bidirectional reflectance of ice tholin presented in Hendrix & Hansen (2008). In future analyses, we will look to higher spatial
resolution data to search for any spectral evidence of absorption bands that can be better
attributed to water ice.
(6)where rfit is the reflectance
modeled substituting the values of w and ζ reported in Table 3 into Eq. (2). In Fig. 8a, the broadband averaged bidirectional reflectance
measurements (I/J) from Fig. 6 are plotted with wavelength and are photometrically corrected in Fig.
8b. The photometric correction brings all of the
data to a higher absolute value of I/J, removes the
clear phase dependence trend visible in Fig. 5, and
achieves consistency across the data set within the error bars. The propagated error bars
on the overall photometric correction include the errors on the observed measurements of
I/J and the derived errors on w and ζ, and are around 15%.
Inherent to the data (e.g., Figs. 5 and 8a) but not quantified prior to applying the photometric
correction, a blue slope is seen in Fig. 8b. A
measure of that spectral slope, i.e., the amount of change in the bidirectional
reflectance across wavelength range, results in a value of −63% per 1000 Å at zero phase in the FUV
wavelength region between 1425 Å and 1800 Å. This is considered to be blue sloped because
of the decrease with increasing wavelength and is consistent with the derived values of
the single scattering albedo, w, which also decreases from 1425−1525 Å to 1700−1800 Å (Table 3). While a blue slope may be suggestive of water ice on the surface in
this finite FUV region as seen in the laboratory (Hapke et
al. 1981; Wagner et al. 1987), using Hapke
modeling as in Hendrix & Hansen (2008) it has
also been shown that the water ice spectrum is expected to have a red slope at these
wavelengths due to the location of the edge of the FUV cut-off if water ice were present.
Therefore, the FUV blue slope alone is inconclusive with respect to the presence of water
ice. It is noteworthy that the blue slope and its magnitude is comparable to that seen in
the bidirectional reflectance of ice tholin presented in Hendrix & Hansen (2008). In future analyses, we will look to higher spatial
resolution data to search for any spectral evidence of absorption bands that can be better
attributed to water ice.
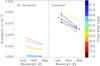 |
Fig. 8 a) Measured broadband averaged I/J values for all data in Table 1 plotted against wavelength are displayed. From red down to blue, the phase angles of the observations increase. Error bars are shown. b) Photometrically corrected broadband averaged I/J values display an overall increase in the absolute flux. The phase dependence (panel a)) is no longer observed. Within the propagated uncertainties, the data at all phase angles are now consistent with each other and show a blue spectral slope. Note that a representative error bar is shown in this panel rather than all the individual uncertainties to reduce plot confusion. |
Derived Hapke modeling parameters (w, the single scattering albedo, and ζ, the asymmetry factor) for 67P and its FUV geometric albedo.
3.3. Spatially resolved regional analysis
With a photometric correction of the phase dependence in hand, we are now able to compare the FUV bidirectional reflectance spectra of different geographic regions, as defined by the OSIRIS camera team (Thomas et al. 2015), across the nucleus of 67P in order to look for compositional variations. In the subset of data detailed in Table 2, Alice acquired coverage of Hatmehit (the depression in the small lobe of the comet), Hapi (the smooth neck region with boulder outcrops), Seth (a region of the large lobe adjacent to the neck), and Ash (along the edge of the large lobe wrapping around from the top to the bottom of the lobe). This sampling includes a variety of terrain and regions on both lobes of the comet and the neck.
The solar irradiance measurements used to calculate the I/J values are again from TIMED SEE (Woods et al. 2005), but for the month of August 2014. The photometric correction (Eq. (6)) is applied to all of the data using the best-fit values for w and ζ listed in Table 3 for the 1425−1525 Å bandpass. This is a valid approach because the Hapke parameters do not present a strong variation with wavelength within the accuracy of our analysis (Table 3). When applied to the data shown in Fig. 8a, this method, employing a single wavelength solution for w and ζ, led to the same results shown in Fig. 8b where the wavelength dependency was taken into account. Figure 9 shows the data before and after the photometric correction. Before the correction was applied, the data do not display much variance. The artifact at 1657 Å seen in all of the plotted data is due to a slight difference in wavelength registration and line width between the strong C i line in the solar spectrum measured by SEE and that reflected off of 67P and measured by Alice. As a reminder, the data were acquired at similar spacecraft distances from the nucleus as well as at a small range of moderate phase angles. With the correction applied, all of the data remain consistent within the error bars, indicative of a compositionally homogeneous layer of material at the surface of the comet at all of the geographic regions sampled, with the exception of the Hatmehit region. This region has an I/J statistically higher than the rest of the nuclear regions sampled, especially between 1650 Å and 1850 Å. The Ash region may be slightly darker at shorter wavelengths than the other 3 regions, but is comparable to Seth beyond 1500 Å. All of the spectra lack the signatures of water ice if it were prevalent on the surface: there are no obvious broad absorptions and no noticeable rise in spectral slope at an absorption edge between 1600 Å and 1850 Å.
3.4. Geometric albedo
With the Hapke parameters derived in Sect. 3.1 and listed in Table 3, the average geometric albedo, by definition at zero phase, of 67P’s surface is calculated here (Hapke 1993):
![\begin{equation} \label{eq:7} A_p = r_0\left(\frac{1}{2} + \frac{1}{6}r_0\right) + \frac{w}{8} \left[\left(1 + B_0\right)p(0) - 1\right]. \end{equation}](/articles/aa/full_html/2015/11/aa26671-15/aa26671-15-eq30.png) (7)Again, the assumption has been made that the
surface is relatively homogeneous and that in utilizing the average properties of the
nucleus sampled in November 2014 (Table 1) we will
arrive at an average geometric albedo for the surface. The calculation was completed for
both of the broadband FUV wavelength regimes denoted in Fig. 5. For 1425−1525 Å
and 1700−1800 Å, the
corresponding geometric albedos are 0.054±0.008 and 0.041±0.006 for 67P and are listed in Table 3. Because of the strong phase dependence, it is important to remember that the
nucleus would only be this bright under zero phase angle viewing conditions, which most of
the Rosetta mission trajectories do not achieve. Therefore, the nucleus of 67P appears to
be much darker than this in most of the Alice data as shown in Stern et al. (2015).
(7)Again, the assumption has been made that the
surface is relatively homogeneous and that in utilizing the average properties of the
nucleus sampled in November 2014 (Table 1) we will
arrive at an average geometric albedo for the surface. The calculation was completed for
both of the broadband FUV wavelength regimes denoted in Fig. 5. For 1425−1525 Å
and 1700−1800 Å, the
corresponding geometric albedos are 0.054±0.008 and 0.041±0.006 for 67P and are listed in Table 3. Because of the strong phase dependence, it is important to remember that the
nucleus would only be this bright under zero phase angle viewing conditions, which most of
the Rosetta mission trajectories do not achieve. Therefore, the nucleus of 67P appears to
be much darker than this in most of the Alice data as shown in Stern et al. (2015).
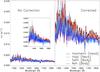 |
Fig. 9 a) Measured I/J for all of the data listed in Table 2 without any photometric correction. The distinct geographical regions of the nucleus have very similar fluxes and spectral shape. There are no apparent absorption features in the spectra. The artifact at 1657 Å is due to a slight difference in wavelength registration and line width between the strong C i line in the solar spectrum measured by SEE and that reflected off of 67P and measured by Alice. b) Photometrically corrected I/J of 4 representative spectra of the regions (Hatmehit, Hapi, Seth, Ash) sampled and shown in panel a). Hatmehit, the depression on the small lobe of the comet, is an overall brighter region between 1500 and 1850 Å, whereas Ash may be slightly darker then the other regions between 1250 and 1500 Å. |
4. Discussion
The Alice data presented in this paper have allowed a thorough analysis of a cometary nucleus in the FUV, a first for this wavelength regime. At variance with a simple Lambert surface, the surface of comet 67P has a large dependence on the phase, with a large decrease in bidirectional reflectance with increasing phase angle in the FUV. As was suggested by Hapke (1993), this is linked to small-scale structure of the cometary material, indicative of porosity. Very porous material has also been inferred on the other comets visited by spacecraft, where the densities are less that that for pure water ice (e.g., A’Hearn et al. 2011). The photometric correction derived here will be applied to future Alice data of the surface of 67P and changes with heliocentric distance, hence solar insolation and activity, will be searched for.
The overall blue spectral slope measured in the spatially resolved Alice data, −63% per 1000 Å in the region between 1400 Å and 1800 Å, is in agreement with the global average reported in Stern et al. (2015) of −57%±11%/1000 Å measured over a wider FUV bandpass. In the 1400−1800 Å wavelength region, a slight blue slope would be expected if water ice existed on the surface, due to a broad water ice absorption band centered around 1600 Å in the FUV. However, if water ice were detected with Alice, at the longer wavelengths beyond 1800 Å, outside of the absorption band, we should see a rise in the bidirectional reflectance of 67P (Hapke et al. 1981; Wagner et al. 1987; Hendrix & Hansen 2008), which we do not. In fact, the spectra presented here do not show indications of any absorption features or absorption edges.
This work presents the first FUV geometric albedo measurement of a cometary nucleus, determining values of 5.4% and 4.1% at 1425−1525 Å and 1700−1800 Å, respectively. 67P’s low geometric albedo values derived here are in agreement with the dark material measured globally with Alice (Stern et al. 2015). Similarly, they are in agreement with those detected for 67P in the visible and infrared by OSIRIS and VIRTIS. Fornasier et al. (2015) derived disk averaged geometric albedos increasing from 3% to 8% from 325 nm to 989 nm with OSIRIS and Capaccioni et al. (2015) measured an albedo of 6.0%±0.3% at 550 nm with VIRTIS. For comparison, a variety of C-, S- and M-class asteroids have been studied in the NUV (2670 Å) with a range in geometric albedos between 2% and 12% (Roettger & Buratti 1994).
In addition to being dark and lacking spectral features within a single spectrum, we conclude that at the spatial resolution of the Alice detector in the data presented here, the material on the surface of 67P is not very spectrally distinct from location to location. With very little variability between geographical regions in I/J and no obvious absorption bands, we infer a homogeneous dusty layer on the surface consistent with other Rosetta results. The Hatmehit region, being the exception in the Alice data, is slightly brighter than the rest of the nucleus in the FUV regime, but still shares the characteristic blue spectral slope measured in the other regions. Perhaps the existence of the large depression in the small lobe is correlated to its brighter I/J.
In this first modeled FUV phase dependence for a comet, the dependence is stronger at shorter wavelengths, but overall, the derived Hapke parameters for 67P in the FUV are comparable to, if not slightly darker than, all other spatially resolved comet nuclei measured in the visible and near-infrared (Li et al. 2013b). 67P has a single scattering albedo of 0.031±0.003 measured at 1425−1525 Å as compared to 0.036±0.006 for Hartley 2 (550 nm), 0.039±0.005 (550 nm) and 0.043±0.006 (650 nm) for Tempel 1, 0.038±0.004 (650 nm) for Wild 2, and 0.057±0.009 (650 nm) for Borrelly (Li et al. 2013b). The Alice data presented here help bolster the fact that 67P, like the other comets visited by spacecraft, are very dark bodies with much less ice exposed on the surface than once thought. Without full elemental modeling across all wavelengths for 67P, it is difficult to further interpret the single scattering albedo. The asymmetry factor, ζ = −0.53 ± 0.03 at 1425−1525 Å, is constant with wavelength in the FUV, and is consistent with that measured for Wild 2, −0.52, and just slightly higher than the values for the other mission target comets listed here, which range from −0.43 to −0.49 (Li et al. 2013b). All of these cometary nuclei have shown varying degrees of activity, including outgassing, erosion, and resurfacing, and a diverse range of surface morphologies. They are therefore not necessarily expected to have identical surface properties. The similarity between the Hapke parameters for these comets potentially reflects a combination of a common characteristic particle size, porosity, and roughness, found on the surface of all comets.
Acknowledgments
Rosetta is an ESA (European Space Agency) mission with contributions from its member states and NASA. We thank the full Rosetta team for the role they played in this manuscript, including those members who have tirelessly helped to plan and execute the Alice observations and those who have participated in comparative surface science discussions at various meetings. Research conducted by the Alice team is supported by NASA’s Jet Propulsion Laboratory through contract 1336850 to the Southwest Research Institute (SwRI). Work at the University of Maryland is supported by a sub-contract from SwRI.
References
- A’Hearn, M. F., Belton, M. J. S., Delamere, W. A., et al. 2005, Science, 310, 258 [Google Scholar]
- A’Hearn, M. F., Belton, M. J. S., Delamere, W. A., et al. 2011, Science, 332, 1396 [CrossRef] [Google Scholar]
- Brownlee, D. E., Horz, F., Newburn, R. L., et al. 2004, Science, 304, 1764 [NASA ADS] [CrossRef] [Google Scholar]
- Capaccioni, F., Coradini, A., Filacchione, G., et al. 2015, Science, 347, 0628 [NASA ADS] [CrossRef] [Google Scholar]
- Ciarniello, M., Capaccioni, F., Filacchione, G., et al. 2015, A&A, 583, A31 [NASA ADS] [CrossRef] [EDP Sciences] [Google Scholar]
- Clark, B. E., Helfenstein, P., Bell, J. F., et al. 2002, Icarus, 155, 189 [NASA ADS] [CrossRef] [Google Scholar]
- Feldman, P. D., A’Hearn, M. F., Bertaux, J.-L., et al. 2015, A&A, 583, A8 [NASA ADS] [CrossRef] [EDP Sciences] [Google Scholar]
- Fornasier, S., Hasselmann, P. H., Barucci, M. A., et al. 2015, A&A, 583, A30 [NASA ADS] [CrossRef] [EDP Sciences] [Google Scholar]
- Glassmeier, K.-H., Boehnhardt, H., Koschny, D., Kührt, E., & Richter, I. 2007, Space Sci. Rev., 128, 1 [Google Scholar]
- Hapke, B. 1993, in Topics in Remote Sensing (Cambridge UK: Cambridge University Press), 455 [Google Scholar]
- Hapke, B. 2002, Icarus, 157, 523 [NASA ADS] [CrossRef] [Google Scholar]
- Hapke, B., Wells, E., Wagner, J., & Partlow, W. 1981, Icarus, 47, 361 [Google Scholar]
- Hendrix, A. R., & Hansen, C. J. 2008, Icarus, 193, 323 [Google Scholar]
- Jorda, L., Gaskell, R., Hviid, S. F., et al. 2015, NASA Planetary Data System and ESA Planetary Science Archive [Google Scholar]
- Li, J.-Y., A’Hearn, M. F., Belton, M. J. S., et al. 2007a, Icarus, 187, 41 [Google Scholar]
- Li, J.-Y., A’Hearn, M. F., McFadden, L. A., & Belton, M. J. S. 2007b, Icarus, 188, 195 [CrossRef] [Google Scholar]
- Li, J.-Y., A’Hearn, M. F., Farnham, T. L., & McFadden, L. A. 2009, Icarus, 204, 209 [Google Scholar]
- Li, J.-Y., A’Hearn, M. F., Belton, M. J. S., et al. 2013a, Icarus, 222, 467 [Google Scholar]
- Li, J.-Y., Besse, S., A’Hearn, M. F., et al. 2013b, Icarus, 222, 559 [CrossRef] [Google Scholar]
- Pommerol, A., Thomas, N., El-Maarry, M. R., et al. 2015, A&A, 583, A25 [NASA ADS] [CrossRef] [EDP Sciences] [Google Scholar]
- Roettger, E. E., & Buratti, B. J. 1994, Icarus, 112, 496 [Google Scholar]
- Sierks, H., Barbieri, C., Lamy, P. L., et al. 2015, Science, 347, 1044 [NASA ADS] [CrossRef] [Google Scholar]
- Soderblom, L. A., Becker, T. L., Bennett, G., et al. 2002, Science, 296, 1087 [NASA ADS] [CrossRef] [Google Scholar]
- Stern, S. A., Slater, D. C., Scherrer, J., et al. 2007, Space Sci. Rev., 128, 507 [Google Scholar]
- Stern, S. A., Feaga, L. M., Schindhelm, E., et al. 2015, Icarus, 256, 117 [Google Scholar]
- Thomas, N., Sierks, H., Barbieri, C., et al. 2015, Science, 347, aaa0440 [Google Scholar]
- Veverka, J., Klaasen, K., A’Hearn, M., et al. 2013, Icarus, 222, 424 [Google Scholar]
- Wagner, J. K., Hapke, B. W., & Wells, E. N. 1987, Icarus, 69, 14 [CrossRef] [Google Scholar]
- Woods, T. N., Eparvier, F. G., Bailey, S. M., et al. 2005, J. Geophys. Res. (Space Phys.), 110, 1312 [CrossRef] [Google Scholar]
All Tables
Derived Hapke modeling parameters (w, the single scattering albedo, and ζ, the asymmetry factor) for 67P and its FUV geometric albedo.
All Figures
|
Fig. 1 NAVCAM context image when Rosetta was 30 km away from 67P on 11 November 2014 at 15:45 UT. The position of the Alice slit is indicated in white and orange with the approximate location of rows 8, 14, and 20 annotated for reference. In this example, row 8 is imaging a well-illuminated surface region, while central rows of the slit are looking at shadowed regions of the surface. |
| In the text | |
|
Fig. 2 a) Flux comparison between data in row 14 and row 20, both at ~12° phase and ~170° longitude but different latitudes (~0° and ~+18°, respectively) and b) comparison between row 8 and row 14, data at ~70° phase observing similar positive latitudes (~25°), but different longitudes (~232° and ~186°, respectively). Both comparisons show very little difference (well within the uncertainties of the data) between the spectra at similar phase angles; but a statistically significant difference, up to a factor of ~10, between the different phase angles sampled in the two panels. |
| In the text | |
|
Fig. 3 Alice flux spectra for all data detailed in Table 1. These data are used to determine the phase dependence for the surface of 67P. From red down to purple, the phase angles of the observations increase. One-sigma error bars are included. |
| In the text | |
|
Fig. 4 Similar to Fig. 3, but with the Alice flux spectra converted to reflectance factors. The plot range is from 1250−1850 Å rather than the larger wavelength coverage in Fig. 3 in order to focus on the spectral region not contaminated by the strong Hydrogen Lyman series of emissions at shorter wavelengths and to avoid the longer wavelengths where there are no TIMED SEE solar data. Accounting for the solar incidence angle, it is clear that the surface of 67P does not behave like a Lambertian as there still exists a strong dependence on phase. Note that the spectrum corresponding to 11.5° stands out above all the rest of the data due in part to its relatively high solar incidence angle and low phase angle, whereas the spectra corresponding to 25.4° and 29.2° appear to be flipped in the reflectance trend because of their relatively similar phase angles, but much different solar incidence angles. |
| In the text | |
|
Fig. 5 Similar to Fig. 4, but converted to bidirectional reflectance (I/J) as defined in Hapke (1993) rather than reflectance factor. Vertical dotted lines indicate the two regions between 1425−1525 Å and 1700−1800 Å where little to no coma nor strong solar lines contaminate the spectra and are thus used to calculate the broadband flux averages in the phase dependence derivation. |
| In the text | |
|
Fig. 6 Average I/J values over the wavelength ranges 1425−1525 Å (black) and 1700−1800 Å (red) for all phase angles listed in Table 1. |
| In the text | |
|
Fig. 7 a) Measured broadband averaged I/J values plotted against the best-fit modeled I/J values for all phase angles analyzed. b) Ratio of the measured I/J values to best-fit modeled values plotted against phase angle. In both panels, the error bars correspond to the uncertainties in the measured I/J values, with no error bars plotted for the model. |
| In the text | |
|
Fig. 8 a) Measured broadband averaged I/J values for all data in Table 1 plotted against wavelength are displayed. From red down to blue, the phase angles of the observations increase. Error bars are shown. b) Photometrically corrected broadband averaged I/J values display an overall increase in the absolute flux. The phase dependence (panel a)) is no longer observed. Within the propagated uncertainties, the data at all phase angles are now consistent with each other and show a blue spectral slope. Note that a representative error bar is shown in this panel rather than all the individual uncertainties to reduce plot confusion. |
| In the text | |
|
Fig. 9 a) Measured I/J for all of the data listed in Table 2 without any photometric correction. The distinct geographical regions of the nucleus have very similar fluxes and spectral shape. There are no apparent absorption features in the spectra. The artifact at 1657 Å is due to a slight difference in wavelength registration and line width between the strong C i line in the solar spectrum measured by SEE and that reflected off of 67P and measured by Alice. b) Photometrically corrected I/J of 4 representative spectra of the regions (Hatmehit, Hapi, Seth, Ash) sampled and shown in panel a). Hatmehit, the depression on the small lobe of the comet, is an overall brighter region between 1500 and 1850 Å, whereas Ash may be slightly darker then the other regions between 1250 and 1500 Å. |
| In the text | |
Current usage metrics show cumulative count of Article Views (full-text article views including HTML views, PDF and ePub downloads, according to the available data) and Abstracts Views on Vision4Press platform.
Data correspond to usage on the plateform after 2015. The current usage metrics is available 48-96 hours after online publication and is updated daily on week days.
Initial download of the metrics may take a while.