Fig. 2
Download original image
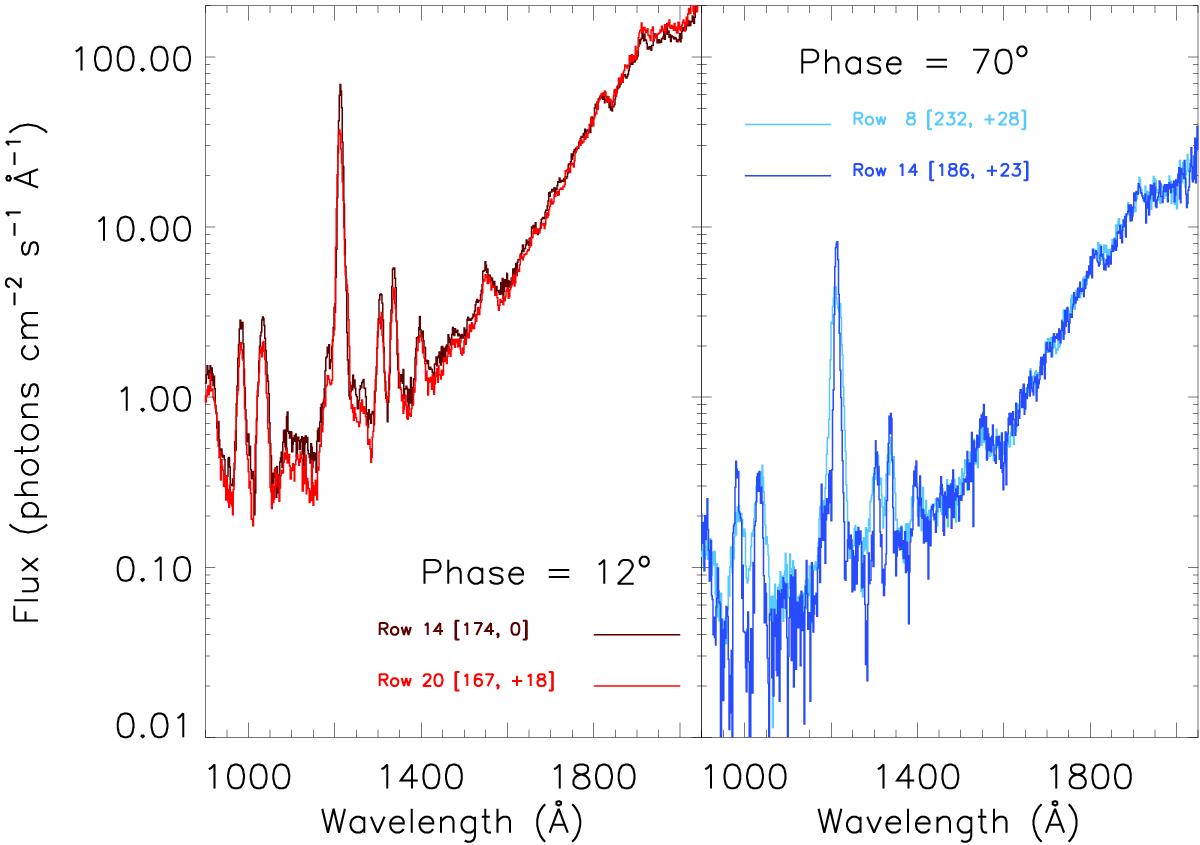
a) Flux comparison between data in row 14 and row 20, both at ~12° phase and ~170° longitude but different latitudes (~0° and ~+18°, respectively) and b) comparison between row 8 and row 14, data at ~70° phase observing similar positive latitudes (~25°), but different longitudes (~232° and ~186°, respectively). Both comparisons show very little difference (well within the uncertainties of the data) between the spectra at similar phase angles; but a statistically significant difference, up to a factor of ~10, between the different phase angles sampled in the two panels.
Current usage metrics show cumulative count of Article Views (full-text article views including HTML views, PDF and ePub downloads, according to the available data) and Abstracts Views on Vision4Press platform.
Data correspond to usage on the plateform after 2015. The current usage metrics is available 48-96 hours after online publication and is updated daily on week days.
Initial download of the metrics may take a while.