Fig. 5
Download original image
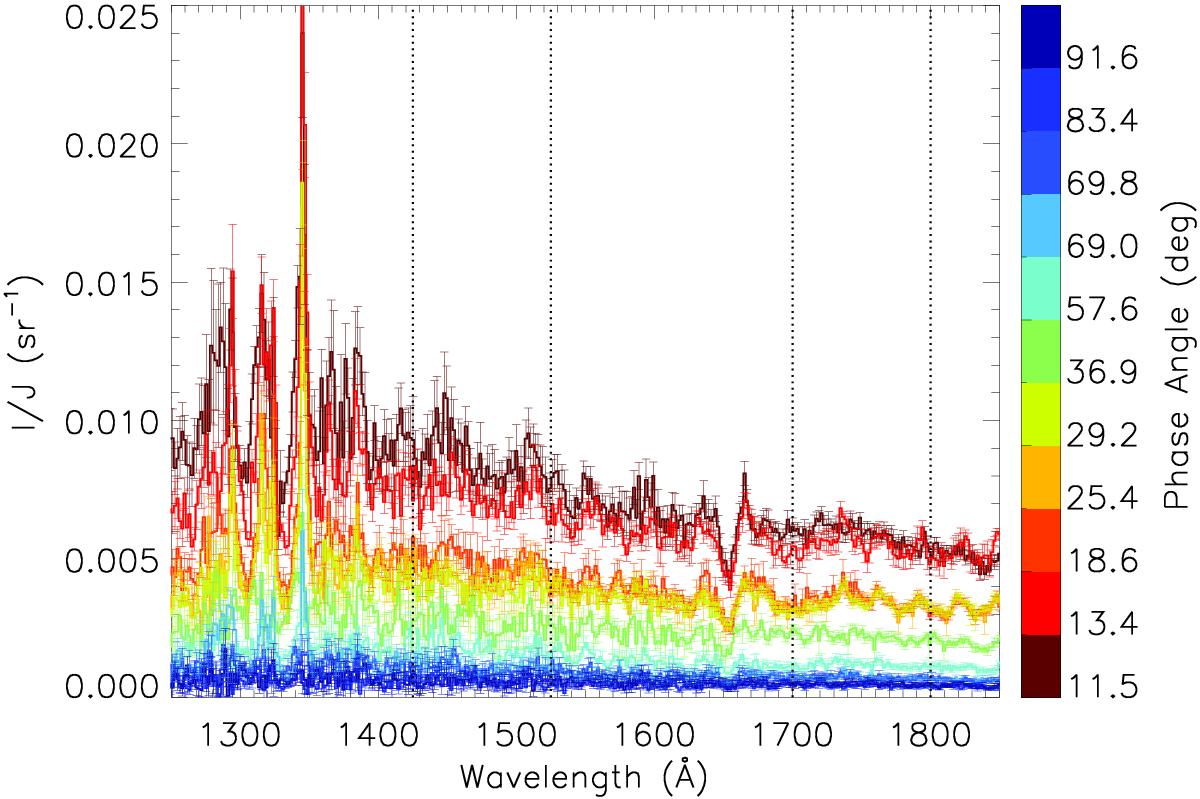
Similar to Fig. 4, but converted to bidirectional reflectance (I/J) as defined in Hapke (1993) rather than reflectance factor. Vertical dotted lines indicate the two regions between 1425−1525 Å and 1700−1800 Å where little to no coma nor strong solar lines contaminate the spectra and are thus used to calculate the broadband flux averages in the phase dependence derivation.
Current usage metrics show cumulative count of Article Views (full-text article views including HTML views, PDF and ePub downloads, according to the available data) and Abstracts Views on Vision4Press platform.
Data correspond to usage on the plateform after 2015. The current usage metrics is available 48-96 hours after online publication and is updated daily on week days.
Initial download of the metrics may take a while.