Fig. 4
Download original image
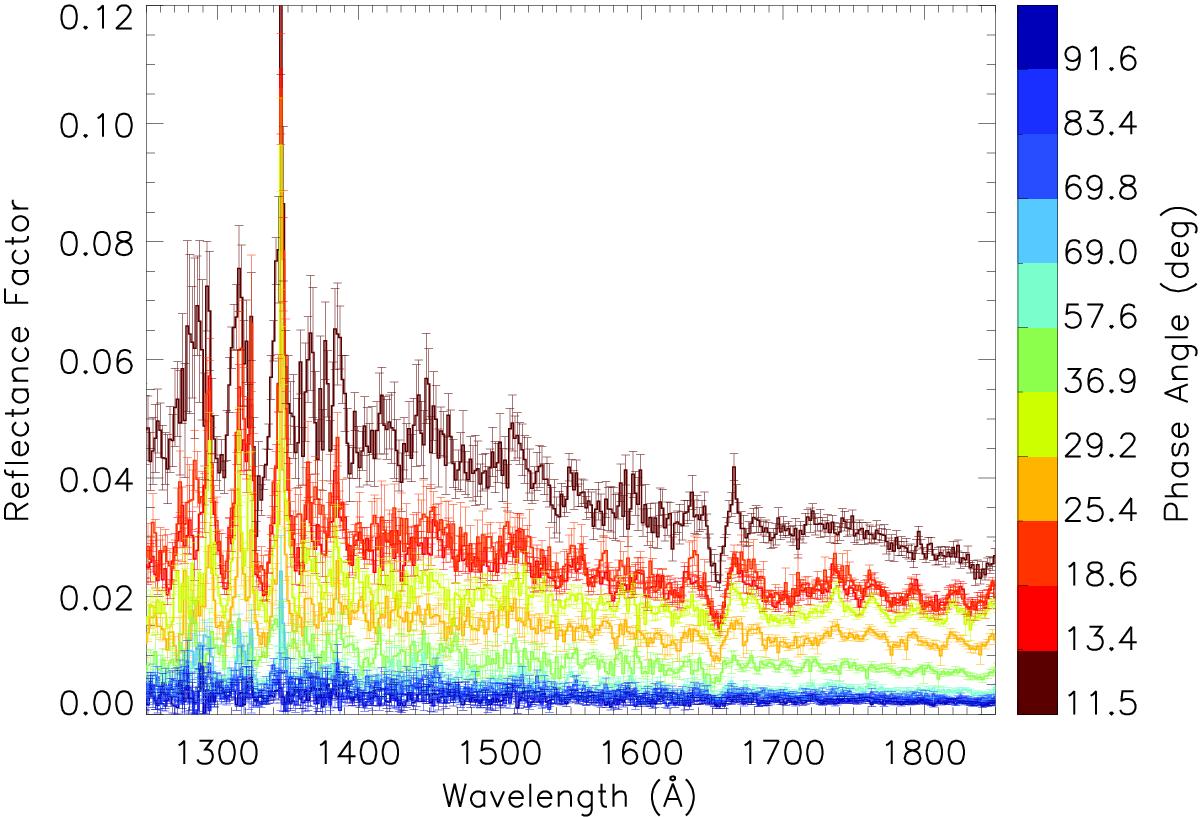
Similar to Fig. 3, but with the Alice flux spectra converted to reflectance factors. The plot range is from 1250−1850 Å rather than the larger wavelength coverage in Fig. 3 in order to focus on the spectral region not contaminated by the strong Hydrogen Lyman series of emissions at shorter wavelengths and to avoid the longer wavelengths where there are no TIMED SEE solar data. Accounting for the solar incidence angle, it is clear that the surface of 67P does not behave like a Lambertian as there still exists a strong dependence on phase. Note that the spectrum corresponding to 11.5° stands out above all the rest of the data due in part to its relatively high solar incidence angle and low phase angle, whereas the spectra corresponding to 25.4° and 29.2° appear to be flipped in the reflectance trend because of their relatively similar phase angles, but much different solar incidence angles.
Current usage metrics show cumulative count of Article Views (full-text article views including HTML views, PDF and ePub downloads, according to the available data) and Abstracts Views on Vision4Press platform.
Data correspond to usage on the plateform after 2015. The current usage metrics is available 48-96 hours after online publication and is updated daily on week days.
Initial download of the metrics may take a while.