Fig. 7
Download original image
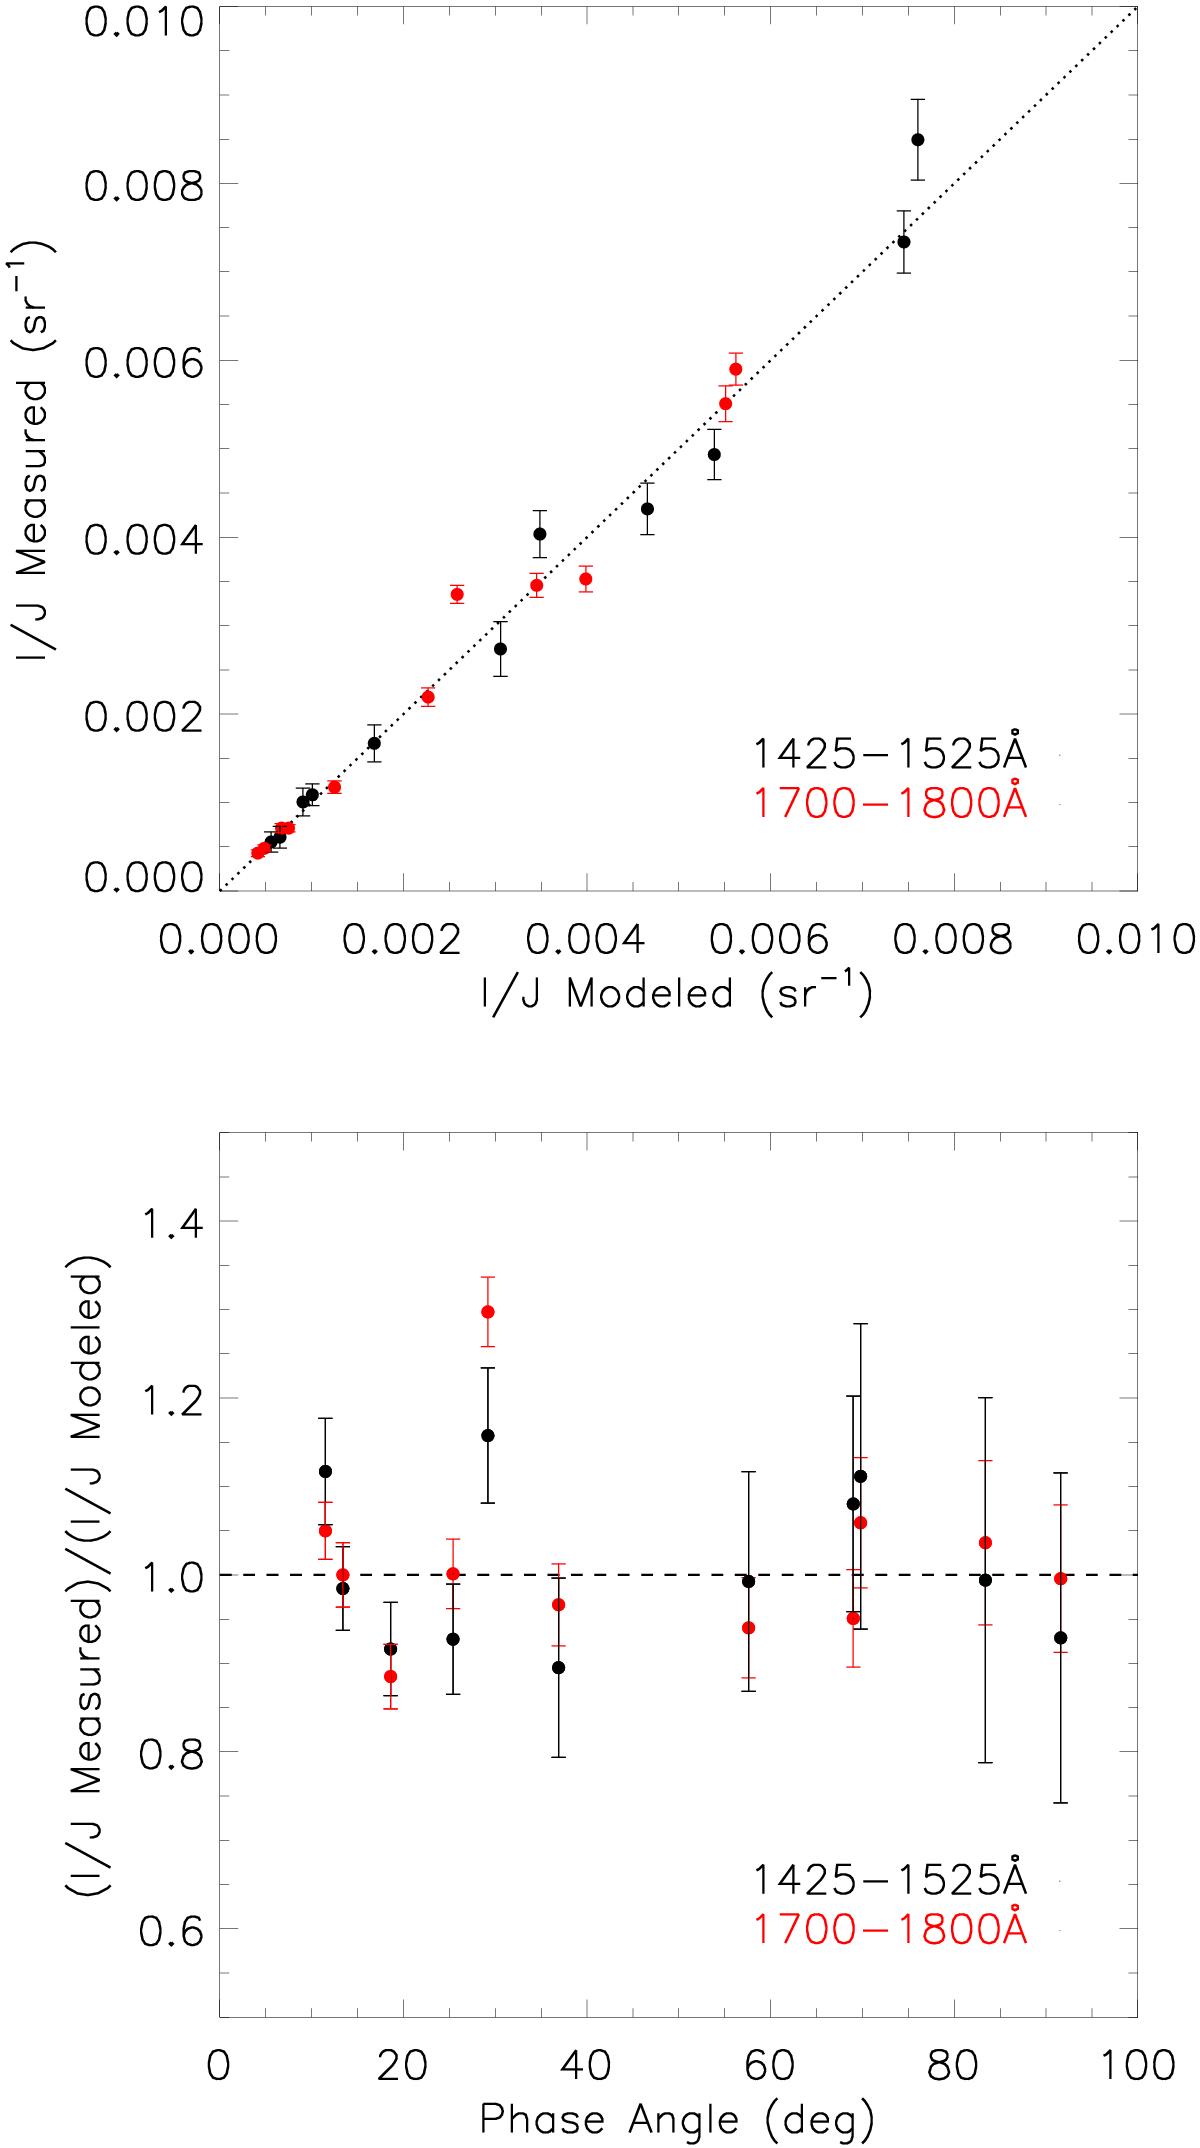
a) Measured broadband averaged I/J values plotted against the best-fit modeled I/J values for all phase angles analyzed. b) Ratio of the measured I/J values to best-fit modeled values plotted against phase angle. In both panels, the error bars correspond to the uncertainties in the measured I/J values, with no error bars plotted for the model.
Current usage metrics show cumulative count of Article Views (full-text article views including HTML views, PDF and ePub downloads, according to the available data) and Abstracts Views on Vision4Press platform.
Data correspond to usage on the plateform after 2015. The current usage metrics is available 48-96 hours after online publication and is updated daily on week days.
Initial download of the metrics may take a while.