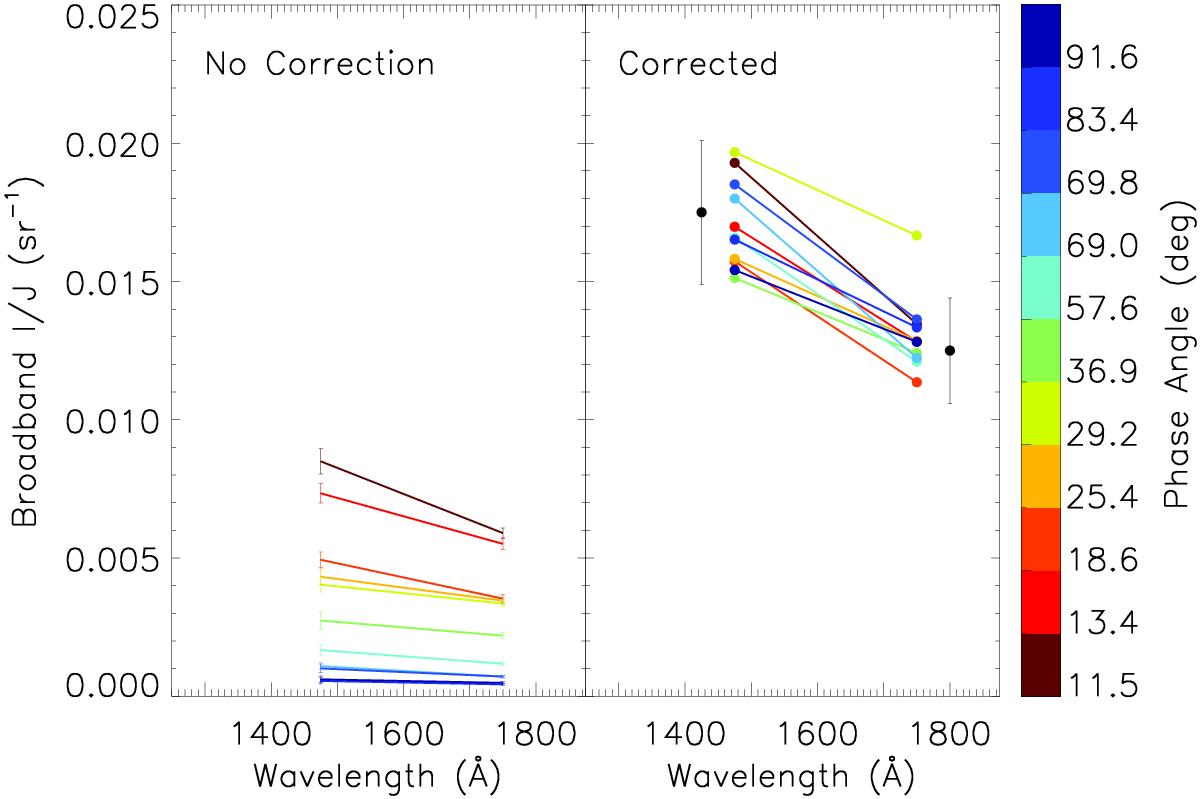
Fig. 8
Download original image
a) Measured broadband averaged I/J values for all data in Table 1 plotted against wavelength are displayed. From red down to blue, the phase angles of the observations increase. Error bars are shown. b) Photometrically corrected broadband averaged I/J values display an overall increase in the absolute flux. The phase dependence (panel a)) is no longer observed. Within the propagated uncertainties, the data at all phase angles are now consistent with each other and show a blue spectral slope. Note that a representative error bar is shown in this panel rather than all the individual uncertainties to reduce plot confusion.
Current usage metrics show cumulative count of Article Views (full-text article views including HTML views, PDF and ePub downloads, according to the available data) and Abstracts Views on Vision4Press platform.
Data correspond to usage on the plateform after 2015. The current usage metrics is available 48-96 hours after online publication and is updated daily on week days.
Initial download of the metrics may take a while.