| Issue |
A&A
Volume 583, November 2015
Rosetta mission results pre-perihelion
|
|
|---|---|---|
| Article Number | A2 | |
| Number of page(s) | 13 | |
| Section | Planets and planetary systems | |
| DOI | https://doi.org/10.1051/0004-6361/201526210 | |
| Published online | 30 October 2015 | |
ROSINA/DFMS and IES observations of 67P: Ion-neutral chemistry in the coma of a weakly outgassing comet
1 Space Science Division, Southwest Research Institute, 6220 Culebra Road, San Antonio, Texas, 78228, USA
e-mail: This email address is being protected from spambots. You need JavaScript enabled to view it.
2 Department of Physics and Astronomy, University of Texas at San Antonio, San Antonio, Texas TX 78249, USA
3 Physikalisches Institut, University of Bern, Sidlerstrasse 5, 3012 Bern, Switzerland
4 LATMOS, 4 avenue de Neptune, 94100 Saint-Maur, France
5 Department of Atmospheric, Oceanic and Space Sciences, University of Michigan, 2455 Hayward, Ann Arbor, MI 48109, USA
6 Laboratoire de Physique et Chimie de l’Environnement et de l’Espace (LPC2E), UMR 6115 CNRS-Université d’Orléans, 45071 Orléans Cedex 2, France
7 Belgian Institute for Space Aeronomy (BIRA-IASB), Ringlaan 3, 1180 Brussels, Belgium
8 Institute of Computer and Network Engineering (IDA), TU Braunschweig, Hans-Sommer-Straße 66, 38106 Braunschweig, Germany
9 Space and Atmospheric Physics Group, Department of Physics, Imperial College London, Prince Consort Road, London, SW7 2AZ, UK
10 Max-Planck-Institut für Sonnensystemforschung, Justus-von-Liebig-Weg 3, 37077 Göttingen, Germany
11 Lockheed Martin Advanced Technology Center, Palo Alto, CA 94304, USA
12 Université de Toulouse, UPS-OMP, IRAP, 31028 Toulouse, France
13 CNRS, IRAP, 9 avenue du colonel Roche, BP 44346, 31028 Toulouse Cedex 4, France
14 Laboratory of Atmospheric and Space Physics, University of Colorado, Boulder, Colorado, CO 80303, USA
15 Swedish Institute of Space Physics, 75121 Uppsala, Sweden
Received: 28 March 2015
Accepted: 7 July 2015
Abstract
Context. The Rosetta encounter with comet 67P/Churyumov-Gerasimenko provides a unique opportunity for an in situ, up-close investigation of ion-neutral chemistry in the coma of a weakly outgassing comet far from the Sun.
Aims. Observations of primary and secondary ions and modeling are used to investigate the role of ion-neutral chemistry within the thin coma.
Methods. Observations from late October through mid-December 2014 show the continuous presence of the solar wind 30 km from the comet nucleus. These and other observations indicate that there is no contact surface and the solar wind has direct access to the nucleus. On several occasions during this time period, the Rosetta/ROSINA/Double Focusing Mass Spectrometer measured the low-energy ion composition in the coma. Organic volatiles and water group ions and their breakup products (masses 14 through 19), CO2+ (masses 28 and 44) and other mass peaks (at masses 26, 27, and possibly 30) were observed. Secondary ions include H3O+ and HCO+ (masses 19 and 29). These secondary ions indicate ion-neutral chemistry in the thin coma of the comet. A relatively simple model is constructed to account for the low H3O+/H2O+ and HCO+/CO+ ratios observed in a water dominated coma. Results from this simple model are compared with results from models that include a more detailed chemical reaction network.
Results. At low outgassing rates, predictions from the simple model agree with observations and with results from more complex models that include much more chemistry. At higher outgassing rates, the ion-neutral chemistry is still limited and high HCO+/CO+ ratios are predicted and observed. However, at higher outgassing rates, the model predicts high H3O+/H2O+ ratios and the observed ratios are often low. These low ratios may be the result of the highly heterogeneous nature of the coma, where CO and CO2 number densities can exceed that of water.
Key words: comets: individual: 67P/Churyumov-Gerasimenko / solar wind / plasmas / molecular processes / methods: data analysis
© ESO, 2015
1. Introduction
Because of their low gravity and high volatile gas content, comets outgas neutrals (primarily H2O, CO, CO2), forming extended comae. Neutrals from the comet are ionized by extreme ultraviolet (EUV) solar photons, charge-exchange with solar wind ions, and are ionized by electron impact ionization from solar wind and suprathermal cometary electrons. Of these processes, photoionization appears to dominate at perihelion distances of ~1 AU (e.g., Ip 2004), but ion charge-exchange also contributes to the total ion density. Energetic electrons in the solar wind (e.g., Rubin et al. 2009) and photoelectrons in high-density coma (e.g., Bhardwaj 2003) produce additional ions by electron impact ionization.
Newly ionized molecules are “picked up” by the solar wind electric field. This pickup process slows and deflects the solar wind and, as more and more ions are picked up, a ring distribution of cometary ions is created around the solar wind magnetic field (e.g., Galeev et al. 1985; Coates et al. 1989). This distribution is also often referred to as a ring-beam distribution (e.g., Ip 2004). This ring distribution is highly agyrotropic and much more beam-like at scale sizes much smaller than a gyroradius of a cometary ion.
If outgassing is weak and the solar wind slows gradually, then the solar wind may or may not deflect around the comet nucleus before it hits the surface. As the outgassing rate increases, a contact surface forms (e.g., Schmidt & Wegmann 1982; Neubauer et al. 1986) and the solar wind plasma and magnetic field no longer have access to the nucleus. Inside the contact surface, cometary neutrals and ions propagate radially away from the nucleus until they arrive at the boundary. Ions are deflected tailward of the comet while neutrals propagate through it into the cometosheath between the bow shock and contact surface. Outside the contact surface, newly created cometary ions from these neutrals are picked up by the shocked solar wind. The interaction near the contact surface is complex (e.g., Ip & Axford 1987). However, the interaction between cometary ions and neutrals inside the contact surface is somewhat simplified because the solar wind is excluded from this region and the ion motion and temperature are governed by collisional interactions with the neutral gas.
There is a rich ion-neutral chemistry in the comae of moderate to highly active comets. This chemistry has been modeled in detail for comets near perihelion and for high outgassing rates, such as comet Halley (e.g., Wegmann et al. 1987; Haider & Bhardwaj 2005; Huebner et al. 1991; Rubin et al. 2009) and moderate outgassing rates, such as 67P (Vigren & Galand 2013). Observations (e.g., Balsiger et al. 1986; Altwegg et al. 1993, 1994; Geiss et al. 1991) and modeling show that, because of extensive ion-neutral chemistry, the abundances of ion species certainly do not reflect neutral abundances in the coma. The extent and characteristics of the chemistry strongly depends on the neutral density and the fact that cometary comae are not in chemical equilibrium. In fact, the transient nature of the cometary atmosphere strongly drives the coma out of equilibrium. Thus, the rates of various reactions are critically important in determining the ion species that are produced and temporarily reside in the coma.
The in situ study of the ion-neutral interactions in the comae of comets has been limited to very active comets near perihelion (near 1 AU) and observations relatively far (from hundreds to tens of thousands of km) from the nucleus. In situ measurements at comets near perihelion were made when outgassing rates were from 1028 molecules/s for comets Giacobini-Zinner and Grigg-Skjellerup (e.g., Fuselier et al. 1986; Benna & Mahaffy 2006) to nearly two orders of magnitude higher for comet Halley (e.g., Balsiger et al. 1986; Altwegg et al. 1993, 1994; Geiss et al. 1991; Huebner et al. 1992; Rubin et al. 2009).
The arrival of the Rosetta spacecraft at 67P/Churyumov-Gerasimenko (67P) provides a unique opportunity for an up-close study of a weakly outgassing comet far from the Sun and far from its perihelion. Rosetta encountered the comet more than 3.5 AU from the Sun and, up to March 2015, the Rosetta orbiter has spent a long time within 50 km of the nucleus. In August, when 67P was about 3.5 AU from the Sun, the water production rate was about 4 × 1025 molecules/s (Gulkis et al. 2015). From October through December 2014, when 67P was between 3.2 and 2.8 AU from the Sun, the lower limit on the water production rate was only marginally higher, about 8 × 1025 molecules/s (Bieler et al. 2015). Diurnal variations in the density at the spacecraft (Hässig et al. 2015; Bieler et al. 2015) are most likely the result of a combination of locations in the coma and changes in the outgassing rate over one cometary rotation. This paper presents preliminary analysis of some representative in situ ion composition observations near comet 67P and discusses the observations in relation to the neutral composition of the coma, the coma-solar wind interaction, and ion-neutral reactions. It demonstrates that the chemistry in the thin coma can be described with a simple model, and where the simple description breaks down, and indicates where both the simple and more complex chemistry models require additional input.
2. Instrumentation
Ion observations in this paper are from the Rosetta Orbiter Spectrometers for Ion and Neutral Analysis (ROSINA)/Double Focusing Mass Spectrometer (DFMS; Balsiger et al. 2007). DFMS is a magnetic ion and neutral mass spectrometer with a mass per charge (u/e) range from 12 u/e to 150 u/e and a mass resolution of 3000 at 1% peak height. The spectrometer has two basic operating modes: a gas (or neutral) mode for measuring cometary neutrals and an ion mode for measuring cometary ions. These modes have two basic mass resolutions: high (3000 at 1% peak height) and low (300 at 1% peak height). High-resolution measurements are about a factor of 10 less sensitive than low-resolution measurements. Most of the time, DFMS is operated in the neutral mode. However, there were several occasions from the end of October through December when the spectrometer was operated continuously in the ion mode for several to many hours at a time.
In the ion mode, the ion source filament (which emits the electrons used to ionize the neutrals in the ion source) is switched off. Cometary ions drift into the entrance aperture, which, for the ion mode is 9° × 6° (Schläppi 2011). For observations in this paper, DFMS accepted ions with an external energy of between 0 and approximately 45 eV. This energy range is dictated by the spacecraft potential (which probably was negative for the time period) and the ΔE/E of the spectrometer.
After energy selection, a permanent magnet is used to separate masses and ions exiting the magnet are directed onto one of three detectors. For the observations in this paper, the microchannel plate (MCP) detector was used. In low-mass resolution, the mass range for one measurement is typically >1 u/e and several integer mass peaks are recorded simultaneously on the MCP detector. In high-mass resolution, the mass range is always <1 u/e and only one integer mass peak (which may be resolved into several masses) is recorded on the detector. For the observations in this paper, one low-mass resolution and one high-mass resolution ion mode was used. Both modes stepped through a range of masses from 13 u/e to either 100 u/e (low-resolution mode) or 150 u/e (high-resolution mode).
In addition to the ion and neutral measurements from DFMS, total neutral number densities in this paper are from the ROSINA/Cometary Pressure Sensors (COPS) nude ion gauge (Balsiger et al. 2007). The COPS nude ion gauge is an extractor-type ionization gauge that measures total gas density at the spacecraft.
Solar wind ion and electron measurements in this paper are from the Rosetta Ion and Electron Sensor (IES; Burch et al. 2007). IES is part of the Rosetta Plasma Consortium (RPC), which includes other plasma and magnetic field sensors. IES was used here to determine whether the solar wind was present at the spacecraft when the ion composition measurements were made.
3. Conditions at the comet from October through December 2014
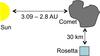 |
Fig. 1 Schematic location of the comet, spacecraft, and Sun at the end of October 2014. The spacecraft was ~30 km from the comet in a bound, terminator orbit. Other ion observations in this paper are from a distance of 30 km. |
Figure 1 shows a schematic representation of the relative Rosetta spacecraft, comet, and Sun positions and distances for 30 October, 2014. The spacecraft was in orbit around the comet at a distance of approximately 30 km and the DFMS field of view was directed nearly continuously at the comet. In late October, the comet and spacecraft were 3.09 AU from the Sun. In November and early December, most of the other ion observations were made at a distance of 30 km from the comet, sometimes in similar bound, terminator orbits. Some observations at 20 km were made that are used here for illustrative purposes, but did not enter into in the calculations of mass ratios.
From the end of October to the end of December, the comet-Sun distance changed from 3.09 AU to 2.8 AU and IES observed the solar wind essentially continuously. Figure 2 shows an example IES angle-energy plot of the solar wind and cometary ion fluxes. The Sun is in the upper left corner and the comet is below in this angle-energy plot. Solar wind H+ and He2+ propagate away from the Sun (and are therefore observed in IES anodes that view the Sun) with a velocity of about 370 km s-1 (0.7 keV/e for protons). IES measures energy per charge without mass discrimination. Therefore, He2+ appears at twice the energy per charge of H+ in Fig. 2. The direction of propagation is deflected somewhat from the Sun direction because of the cometary ion pickup process described in the introduction (see also Broiles et al. 2015; Nilsson et al. 2015). The He+ distribution is produced by charge exchange of solar wind He2+ with cometary neutrals (Shelley et al. 1987; Burch et al. 2015). Low-energy cometary ions are observed in the sectors viewing opposite the comet direction.
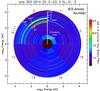 |
Fig. 2 Rosetta IES observations of solar wind ions on 30 October 2014 from 2200 to 2300 UT. This energy-angle plot shows the arrival anode of solar wind and cometary ion fluxes. The directions to the Sun and comet are shown. Solar wind H+ and He2+ are propagating at the same speed of 370 km s-1 (and therefore He2+ appears at twice the H+ energy per charge in the IES electrostatic analyzer). The solar wind is not propagating radially away from the Sun because of cometary ion pickup. The extent and direction of the deflection depend on the comet outgassing rate and the orientation of the solar wind magnetic field. The existence of He+ is further evidence of the interaction with the comet coma. It is created by charge exchange of solar wind He2+ with cometary neutrals. |
The presence of the solar wind 30 km from the comet indicates that there is no contact surface sunward of the spacecraft location. In addition, the weak deflection of the solar wind indicates that it probably has access to the surface of the nucleus.
There is additional evidence of solar wind access to the surface. Sputtering of dust refractory material from the surface of 67P (Wurz et al. 2015) is observed. When Rosetta was 10 km from the comet in mid-October 2014, DFMS observed non-volatile refractory species (Na, K, Si, and Ca) in the coma. Observations (not shown here) of sputtered dust refractory species during the period from 30 October through 15 December 2014 demonstrates that, at very least, there was intermittent sputtering by solar wind impact during the times when the ion measurements in this paper were made.
With no contact surface at the comet, newly ionized cometary molecules are picked up by the solar wind. A velocity space diagram of this pickup process is shown in Fig. 3. The magnetic field is assumed to be in the ecliptic and in a direction consistent with the deflection of the solar wind by cometary ion pickup (see Broiles et al. 2015). Newly created ions are at nearly zero velocity relative to the comet. When fully picked up, these ions will form a ring distribution in velocity space that is centered on the E × B drift velocity and has a bulk flow antiparallel to the magnetic field (V−||) as illustrated in Fig. 3. DFMS accepts a small slice of velocity space near zero velocity (the negative spacecraft potential helps in this case). Therefore, the ion flux measured by DFMS strongly depends on the magnetic field orientation, the direction to the comet, and the amount of deflection and energization that the ions experience in the pickup process before their arrival at the spacecraft. Nilsson et al. (2015) described observational evidence at 67P of this energization in the initial phase of the pickup process. Broiles et al. (2015) demonstrated that the deflection of the solar wind is a consequence of this initial pickup process. To understand the conditions in the partially ionized coma, it is important to understand how the ion pickup timescale is related to the propagation time from the comet to the spacecraft. The timescale for pickup, propagation time, and an estimate of the mean free path of ions in the coma are presented in Table 1.
Estimates of pickup ion parameters in the coma and assumptions that are used to derive these parameters.
As Table 1 demonstrates, the propagation time from the comet to the spacecraft is short compared to the gyroperiod of a water ion that is created near the comet surface. Thus, DFMS observes ions created all along the path from the comet surface to the spacecraft. An ion created at the comet experiences the solar wind convective electric field as it propagates to the spacecraft. Assuming a maximum convective electric field, Table 1 shows that an ion created at the comet will gain 11 eV of energy by the time it is 30 km from the comet. This small amount of energy gained keeps the newly created ion within the energy window of DFMS. Ions created far sunward of the spacecraft that are picked up by the solar wind and convected back to the spacecraft will have too high an energy (and will be deflected away from the comet) and will not be observed by DFMS.
The mean free path for ions created near the comet is somewhat longer than the distance between the spacecraft and the comet. The mean free path in Table 1 assumes a constant neutral density from the comet to the spacecraft. In reality, the density is about an order of magnitude higher within 10 km of the comet, which reduces the mean free path from 100 km to about 30 km in that region. Therefore, newly created cometary ions are likely to suffer at most one collision with the neutrals in the coma as they propagate from the comet to the spacecraft. Since collisions are necessary for coma ion-neutral chemistry, these conditions indicate that the chemical interactions in the coma are limited.
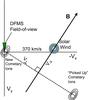 |
Fig. 3 Schematic representation of cometary ion pickup. The ecliptic plane is shown and the magnetic field is assumed to be located in that plane. Cometary ions are created at rest with respect to the solar wind. These ions respond to the solar wind electric field by gyrating around the solar wind magnetic field. When fully picked up, the cometary ions form a ring distribution. The intersection of this ring with the plane that contains the magnetic field and the solar wind is shown. In response, the solar wind is deflected. The relatively small deflection shown in this schematic is consistent with the deflection in Fig. 2. DFMS has a very narrow field of view (shown by the green wedge) and detects low-energy ions from the comet. It does not detect the entire cometary ion distribution because pickup ions move in a direction and have an energy that is outside of the field of view and energy window of DFMS. |
4. Ion composition observations in the coma
Figure 4 shows two days of neutral and ion measurements of mass 18. Background (primarily neutral background from the spacecraft) was not subtracted from these measurements, but the neutral background is orders of magnitude lower than the neutral signal and the ion background is considerably lower than the ion signal. This time period was selected because it contains a short period of ion observations that is bracketed by sustained neutral observations. The COPS total density (green dots) shows variations at a period of approximately six hours. These diurnal variations are associated with times when the “neck” region of the comet is in view (Hässig et al. 2015; Bieler et al. 2015). The ion-neutral chemistry in the coma will have time variations at the same period. Also shown in Fig. 4 is the DFMS mass 18 signal (in arbitrary units) for neutrals and for ions for two periods of ion measurements. The neutral measurements of mass 18 (mostly neutral H2O) show the same diurnal variations as those in the COPS total neutral density. The similarities in the two measurements are consistent with a water-dominated neutral coma, at least for this time period. In the ion mode, the mass 18 signal is almost four orders of magnitude lower than the neutral signal. The diurnal variations are no longer evident even though the spectrometer still measures water (ions) and the COPS total neutral density still exhibits diurnal variations. The statistical uncertainties are of about the symbol size for all DFMS measurements in Fig. 4; therefore, counting statistics cannot explain the lack of diurnal variations in the ion measurements. This lack of variation in the ion time series probably is the result of the differences between the ion and neutral coma and the effects of the pickup ion process discussed in the introduction.
Two competing effects complicate the direct comparison of ion and neutral signals in Fig. 4 and the determination of the ion density in the coma from DFMS measurements. The first effect is the difference of the ion and neutral detection efficiencies for DFMS. The second effect is that DFMS most likely samples the entire neutral population in the coma, but only samples a small part of the ion population. Of these, the second effect is probably more significant.
As illustrated in Fig. 3, only a small part of the ion flux is detected by the relatively narrow field of view of the spectrometer. Very low energy ions are detected because the spacecraft potential is negative. However, the flux and direction of arrival of these ions are a complicated function of the shape of the spacecraft potential, which is not well known. Furthermore, ion pickup deflects ions beyond the field of view and shifts them out of the energy range of the spectrometer.
Using the deflection of the solar wind near the comet (similar to the deflection seen in Fig. 2), Broiles et al. (2015) estimated the coma ion density to be between 0.4 and 3 cm-3 for two intervals in October 2014 and January 2015. Because ions must be picked up in order to deflect the solar wind, this density estimate is probably representative of ion densities somewhat farther sunward of the spacecraft. The densities at the spacecraft may be higher. Thus, it is reasonable to conclude that DFMS, with its very small sample of velocity space, may be detecting much less than 1 percent of the total ion flux.
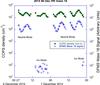 |
Fig. 4 Two days of neutral and ion measurements from ROSINA/COPS and DFMS. The measurements were taken 20 km from the comet, span all longitudes, and the latitude range from 0 to -46°. COPS measurements of the total neutral density at the spacecraft (green dots) show diurnal variations of up to a factor of 5 (ranging from ~1 × 107 cm-3 to 5 × 107 cm-3) with a six-hour period. DFMS observations of neutral H2O (mass 18, with the intensity in arbitrary units) show the same diurnal variations. Ion measurements from 12 to 24 UT on 6 December 2014 and from 23 to 24 UT on 7 December 2014 are almost four orders of magnitude lower than the neutral signal. Accounting for differences in the efficiencies for detecting ions and neutrals, the ion density measured by DFMS is about 0.1 cm-3. |
Because DFMS misses a large portion of the ion distribution, absolute fluxes of the ion species are not very meaningful. However, the ratios of individual species are excellent representations of the ion neutral chemistry in the coma. Figure 5 shows a low-resolution ion spectrum taken on 4 November 2014. The spectrum, ranging from mass per charge = 13.5 to 19.5 u/e, is a combination of four individual mass spectra. It was taken 30 km from the comet at a longitude of –31° and a latitude of 19°. In the mass range from 13.5 to 19.5 u/e, there may be a peak at mass 14, and there are certainly peaks at masses 15 through 19. Peaks at masses 14.4 u/e and 17.4 u/e are probably not real. They represent the variable offset signal across the MCP detector that forms an apparent peak when the end of one spectrum is sequenced onto the beginning of the next spectrum. Strong candidates for the masses that are clearly observed include water group and organic products. From high to low mass these candidates include, H3O+ (mass 19), H2O+ (mass 18), OH+ (mass 17), O+ and CH4+ (mass 16), CH3+ (mass 15), and possibly CH2+ (mass 14). Nitrogen-bearing molecules are probably at much lower number densities because of the paucity of nitrogen in the coma (Rubin et al. 2015; Le Roy et al. 2015). The exception might be products of NH3 (such as NH3+ at mass 17) because NH3+ can be a few percent in the ionized comae (Allen et al. 1987; Haider et al. 1993). At a few percent of the water ion density, this molecule plays an important role in ion-neutral chemistry when the total ion density is high (Allen et al. 1987; Geiss et al. 1991; Altwegg et al. 1993; Vigren & Galand 2013).
High-resolution mass spectra (not shown here) distinguish carbon-, nitrogen-, and oxygen-based molecules and confirm the major mass peaks and some of the minor ones. The mass peaks and the predominant ions that are confirmed by these high-resolution spectra are shown in Table 2.
Ion mass peaks observed by DFMS and the predominant ion in the peak, determined from high-resolution mass spectra.
Ions in the mass range from 14 to 18 u/e are composed of water and its products and products of carbon-hydrogen molecules. Since O+ dominates at mass 16, the origin of CH3+ and CH2+ probably is a mixture of parent (neutral) molecules that includes CH4 but may have significant contributions from higher mass molecules such as C2H6. The contributions of higher mass molecules such as C2H6 to masses 14 and 15 are important for the overall understanding of the ions that make up masses 27 through 29. The origin of H3O+ in Table 2 is discussed below.
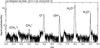 |
Fig. 5 Low-resolution ion spectrum from mass 13.5 to 19.5 u/e. There may be a peak at mass 14 (probably CH |


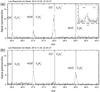 |
Fig. 6 Low-resolution ion spectra from mass 26 to 30 u/e for two different time periods. The mass resolution is insufficient to resolve CN+ from C2H |

Figure 6 shows low-resolution ion spectra for two different time periods. The spectra, which span the mass range from mass 26 to 30 u/e are a combination of two individual mass spectra. These spectra from the two time periods illustrate the range of variations in the mass peaks for the mass range around mass 28. Spectrum (a) was taken 30 km from the comet at a longitude of –161° and a (southern hemisphere) latitude of –42°. Spectrum (b) was taken 30 km from the comet at a longitude of 64° and a (northern hemisphere) latitude of 44°. Spectrum (a) shows mass peaks at mass 26, 27, 28, and 29 but no mass peak at mass 30. At low-resolution, CN+ cannot be distinguished from C2H2+ or HCN+ from C2H3+. However, the mass separation is sufficient to conclude that the mass peaks at mass 28 and 29 are dominated by CO+ and HCO+, respectively. The dominance of CO+ at mass 28 is confirmed using high-resolution mass spectra from other times (not shown).
Spectrum (b) in Fig. 6 shows a very different spectrum from spectrum (a). In this spectrum, there are peaks at mass 27 and 29 and possibly weak peaks at mass 28 and 30. As in spectrum (a), the mass resolution is not sufficient to distinguish HCN+ from C2H3+. However, unlike spectrum (a), there is very little CO+ and, although HCO+ still dominates mass 29, there probably is a contribution from C2H5+. The weak peak at mass 30 may be C2H6+. The makeup of the mass 29 peak is discussed in detail in Sect. 5.
In addition to the mass peaks shown in Figs. 5 and 6, CO2+ (mass 44, not shown) is regularly observed in the coma. Other mass peaks from 30 to 50 u/e are observed very rarely or not observed at all above the DFMS background. In particular, there is no signal observed at mass 32 (S+?). S+ was observed in the coma of comet Halley (Balsiger et al. 1986). Higher mass water cluster ions (H2O)n-H2O+ (i.e., multiples of 18 or 19) were not observed either. These water clusters have been observed in the water-ice plume at Enceladus (Hill et al. 2012) and are predicted for 67P near perihelion (Vigren & Galand 2013).
In Fig. 5, the H2O+ (mass 18) intensity was greater than that for H3O+ (mass 19). In Fig. 6, the CO+ (mass 28) dominates over mass 29 (HCO+) in spectrum (a) and is much lower than mass 29 (HCO+, C2H5+?) in spectrum (b). H3O+ and HCO+ are good indicators of the level of ion-neutral chemistry in the coma. They are formed by interaction of a newly created H2O+ ion with H2O and CO molecules in the coma through the ion-molecule reactions: 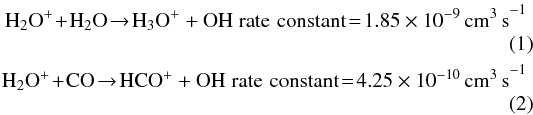 where the rate constants in Eqs. (1) and (2) were used in a coma model by Rubin et al. (2009) and are tabulated in Anicich (1993).
The H3O+/H2O+ ratio increases with increasing neutral density in the coma. For example, at Halley near perihelion, the ratio was ~3−5 at distances in excess of 4000 km from the nucleus (Allen et al. 1987). With its much lower coma density, the H3O+/H2O+ ratio at 67P might be much lower than that at Halley, even at much smaller distances. Figure 7 shows the mass 19 (H3O+)/mass 18 (H2O+) ratio (top panel) and the mass 29 (HCO+, C2H5+?)/mass 28 (CO+) ratio (bottom panel) as a function of the total neutral density at the Rosetta spacecraft. All ion measurements were used starting 30 October and extending through 15 December 2014 when the spacecraft was 30 km from the comet. Table 3 shows the dates, times, and locations for the observations in Fig. 7. High-resolution ion measurements were used for the mass 19 to mass 18 ratio because the low-resolution mode (used, for example, to create Fig. 5) places the mass 19 peak near the very edge of the MCP detector. At the edge of the detector, offset subtraction is more difficult and the relative gain at that location is not as well defined because of edge effects on the detector. The high-resolution mode places the mass 19 and the mass 18 peaks in the center of the detector in sequential mass spectra. At this location on the detector, offset subtraction and relative gain on the detector are better defined. Furthermore, the subtraction and gain correction are the same for the two mass peaks, resulting in a ratio where the accuracy is determined by the counting statistics. Low-resolution ion measurements were used for the mass 29 to mass 28 ratio because count rates for mass 29 ions were substantially lower than those for mass 19 and mass 18 ions. For example, Fig. 6 spectrum (a) shows that the count rate for mass 29 was almost an order of magnitude lower than that for mass 19 in Fig. 5. Because of the variable pixel gain (due to progressive MCP degradation that is more pronounced in the center of the detector than at the edges) and the overall lower signal on mass 29 and 28, the uncertainties in the mass 29 to mass 28 ratios are substantially larger than the uncertainties for the mass 19 to mass 18 ratios.
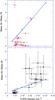 |
Fig. 7 Top panel: ion mass 19/mass 18 (H3O+/H2O+) and bottom panel: ion mass 29/mass 28 ((HCO+ and possibly C2H |
Because different modes were used to determine the mass 19 to mass 18 ratio and the mass 29 to mass 28 ratio, the measurements were taken on different days when either high- or low-resolution ion measurements were conducted. For this reason, there is no one-to-one correspondence between the observations in the top and bottom panels in Fig. 7 and, for example, there are only a few high-resolution measurements when the total pressure was greater than 2 × 107 cm-3.
The mass 19 to mass 18 ratio rarely exceeds 1. For most total neutral densities in a limited range from (1 to 3) × 107 cm-3, the ratio is approximately 0.5. In contrast, the mass 29 to mass 28 ratios have two different ranges. When the total neutral density is about 1 × 107 cm-3, the mass 29 to mass 28 ratio is about 0.2. However, when the total neutral density is greater than 2 × 107 cm-3, the mass 29 to mass 28 ratio is larger than 1. The ratios for neutral density greater than 2 × 107 cm-3 have relatively large uncertainties due to counting statistics, especially for mass 29. The solid and dashed blue lines are discussed in the next section.
5. Modeling the ion-neutral chemistry of H3O+ and HCO+
The mass 19 to mass 18 and mass 29 to mass 28 ratios provide a measure of the extent of ion-neutral chemistry in the coma. H3O+ and HCO+ are created from ion-neutral collisions, primarily the two ion-neutral reactions with H2O and CO in Eqs. (1) and (2). As pointed out in the introduction, ions are created in the coma by photoionization, charge-exchange with solar wind ions, and electron impact ionization with solar wind and cometary electrons. Of these ionization processes, photoionization is dominant, providing 75% of the ions in the coma (Vigren & Galand 2013). For H2O+ and CO+, the dominant reactions are:  Thus, H2O+ and CO+ are created primarily by the photoionization processes in Eqs. (3) and (4). CO2 is photoionized into O and CO+, but at a rate 10 times lower than the one in Eq. (4). Because the photoionization rates in Eqs. (3) and (4) are nearly the same, H2O+ and CO+ are created in the same proportion as their neutral densities. Ion-neutral reactions change this proportion because H2O+ is converted into H3O+ and HCO+ primarily by the ion-neutral reactions in Eqs. (1) and (2). CO+ is converted into H2O+ and HCO+ primarily by the reactions
  There are a host of other ion-molecule reactions with other ion and neutral constituents in the coma that also modify the H2O+, H3O+, CO+, and HCO+ number densities by producing ions at masses 18, 19, 28, and 29 (e.g. Rubin et al. 2009; Vigren & Galand 2013). However, in the coma of a weakly outgassing comet like 67P far from perihelion, the long mean free path for ion-neutral collisions limits the number of reactions an ion will undergo as it propagates from where it is created in the coma to the Rosetta spacecraft only 30 km from the nucleus.
Here, the limited number of collisions in the coma is used as a basic constraint to create a simple coma chemistry model that predicts the maximum H3O+/ H2O+ and HCO+/CO+ ratios as a function of outgassing rate from the comet. In the model, neutral H2O and CO propagate away from the comet with velocities of 0.7 km s-1 (Gulkis et al. 2015) and with a neutral density that is highest at the comet and decreases as 1/r2, where r is the radial distance from the comet. These neutrals are ionized by solar photons at rates given in Eqs. (3) and (4). The coma is not in photo-chemical equilibrium. If there were no ion-neutral chemistry, then the density profile of H2O+ and CO+ as a function of distance from the comet would be determined by a competition between the 1/r2 density decrease and the density increase through additional ionization of neutrals in the coma.
H3O+ and HCO+ are produced through interaction of H2O+ with H2O and CO in the coma. Production of these ions and removal of H2O+ occurs at rates in Eqs. (1) and (2). Similarly, H2O+ and HCO+ are produced through interaction of CO+ with H2O in the coma. Production of these ions and removal of CO+ occurs at rates in Eqs. (5) and (6). Ions produced by the reactions in Eqs. (1), (2), (5), and (6) should continue to react with water in the coma, modifying the number densities of the four ions of interest, (i.e., H3O+, H2O+, HCO+, and CO+). However, in this simplified model of the ionized coma, only one ion-neutral collision occurs between the initial ionization near the comet and the arrival at the spacecraft 30 km away. Thus, secondary ion-neutral reactions are artificially eliminated from the model, as are reactions that create C2H5+ (mass 29) and C2H4+ (mass 28) from organic molecules such as C2H6. In this simple model, all of the mass 29 and 28 come from HCO+ and CO+, respectively.
By not allowing secondary ion-neutral reactions, loss processes for mass 19 and mass 29 are eliminated and loss processes for mass 18 and mass 28 are included. With this preferential selection, the ratios of mass 19/ mass 18 and mass 29/ mass 28 are maximized (at least to the extent that HCO+ dominates mass 29 and CO+ dominates mass 28).
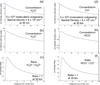 |
Fig. 8 Results from the simplified coma model for a water-dominated coma and low outgassing rate. All ion number densities decrease with increasing distance from the comet because of competing factors of the 1/r2 density decrease and the increases and decreases due to ionization and ion-neutral chemistry. Whereas the chemical equations that govern the H3O+ and HCO+ number densities have no loss terms in this simple model, the equations that govern the H2O+ and CO+ number densities do have loss terms. Therefore, the H3O+ and HCO+ number densities decrease more slowly than those for H2O+ and CO+. At 30 km from the comet, the H3O+/H2O+ and HCO+/CO+ ratios are both lower than 1, indicating weak ion-neutral chemistry for this low outgassing case. |
The coupled rate Eqs. (1) through (6) were solved numerically for a family of outgassing rates from 5 × 1025 molecules/s (corresponding to a density of 6 × 106 cm-3 at 30 km from the comet, assuming a density that depends on 1/r2) to 2.5 × 1026 molecules/s (corresponding to a density of 3.2 × 107 cm-3 at 30 km from the comet). In the model, the change in the outgassing rate is used to match the observed neutral density at the spacecraft. The neutral coma was assumed to be 80% water and 20% CO. The results of this numerical solution are shown in Figs. 8 and 9. Panels a through f in these figures are (a) and (b), the number densities of H2O+ and H3O+, (c) the ratio of H3O+/H2O+, (d) and (e), the number densities of CO+ and HCO+, and (f) the ratio of HCO+/CO+.
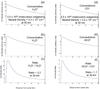 |
Fig. 9 Results from the simplified coma model for a water-dominated coma and high outgassing rate. Unlike the low outgassing case in Fig. 8, the H3O+/H2O+ ratio is significantly greater than 1, indicating stronger ion-neutral chemistry for this high outgassing case. Even though there is stronger ion-neutral chemistry, the HCO+/CO+ ratio is only slightly greater than 1. |
The number densities of all ions in Figs. 8 and 9 have maxima very near the comet and decrease at a rate that is slower than 1/r2 farther away from the comet (thus the outgassing rate is not simply related to the density at 30 km from the comet by 1/r2). Most of the ions and the ion-neutral reactions occur near the comet where the neutral density is highest. As the ions and neutrals propagate away from the nucleus, the H3O+ and HCO+ number densities decrease more slowly than those of H2O+ and CO+ because the protonated molecules are preferentially created from the parent molecules in the coma.
The solid and dashed lines in Fig. 7 show the predicted mass 19 to mass 18 and the mass 29 to mass 28 ratios at 30 km from the comet as a function of density (the dashed lines are linear extrapolations of the predictions from the model). Comparing the predictions and observations in Fig. 7, it is clear that the observed and predicted mass ratios agree reasonably well, but the observed ratios are consistently lower than the predicted ratios for low coma densities (below ~2 × 107 cm-3). The predicted ratios are expected to be higher than the observed ones because there are no loss terms in the model for mass 19 or mass 29, when in reality, there are several paths that may reduce the densities at these masses.
The predicted mass 29 to mass 28 ratios in Fig. 7 agree reasonably well with the observed ratios over the full range of neutral densities. Both show an increasing ratio with increasing density. The observations at higher density (solid symbols in the bottom panel in Fig. 7) were obtained over two days from 29−30 November 2014 and are all from high northern latitudes. In contrast, the observations at lower density were from moderate northern and high southern latitudes. The location of these observations has implications on the modeling that is discussed in the next section, where the possible contamination of mass 29 by C2H5+ is considered.
The results from this simple model were compared with three special runs of the full chemical model from Vigren & Galand (2013). The full chemical model used the same input parameters as the simple model, included only photoionization, but added CO2 (4%).
For 6.4 × 106 cm-3 at 30 km from the comet, the H3O+/H2O+ ratio was 0.8 and the HCO+/CO+ ratio was 0.3. Both of these ratios agree well with the ratios from the simple model and from the observations (see Fig. 7). For 3.2 × 107 cm-3 at 30 km from the comet, the H3O+/H2O+ ratio was 3.1 and the HCO+/CO+ ratio was 0.5. The H3O+/H2O+ ratio agrees well with the ratios from the simple model and from the observations (see Fig. 7). However, the HCO+/CO+ ratio from the full chemical model is significantly lower than the ratios from the simple model and from the observations. The primary reason why the HCO+/CO+ ratio is so much lower in the full chemical model is that the reaction:  (7)greatly reduces the HCO+ concentration and slightly increases the H3O+ concentration. If this reaction is excluded from the full chemical model, then the H3O+/H2O+ ratio becomes 2.8 and the HCO+/CO+ ratio becomes 2.5. These ratios are in much better agreement with the ratios from the simple model and from the observations. The implications for these comparisons between models and observations are discussed in the next section.
6. Discussion and conclusions
The Rosetta encounter with comet 67P represents a unique opportunity for an up-close investigation of the neutral and ionized coma of a weakly outgassing comet that is far from perihelion. The outgassing rate at 3 AU is ~3 orders of magnitude lower than the lowest rates observed by other spacecraft fly-bys of comets near their perihelion.
At such low outgassing rates, the solar wind, while deflected because of pickup of cometary ions, has access to the nucleus. The non-volatile neutrals in the coma (see, Wurz et al. 2015) are evidence of solar wind sputtering of these neutrals from the comet surface. Since the solar wind threads the entire neutral coma (see Fig. 2), any ion created by photoionization or charge exchange is picked up in the solar wind flow and leaves the coma. DFMS only observes newly created ions propagating radially away from the comet, before these ions are picked up. Ions created far sunward of the spacecraft and comet are picked up by the solar wind. Their energy and arrival direction are beyond the energy range and field of view of DFMS.
Rosetta DFMS observes ions in the water group with likely contributions from higher mass carbon molecules and their breakup products as well as ions at mass 26 through 29 and mass 44. These are likely CN+, C2H2+, C2H3+, HCN+, CO+, C2H5+, HCO+, and CO2+. The low-resolution mass spectra are insufficient to distinguish CN+ from C2H2+ and C2H3+ from HCN+. Other ions are not observed (except for C2H6+ at mass 30), in large part because DFMS samples a very small region of velocity space Fig. 3. Water ion clusters were not observed by DFMS in this thin coma. Water ion clusters indicate the extent of ion-neutral interactions and are predicted in the coma of comet 67P when it is near perihelion and the outgassing rate is much higher (Vigren & Galand 2009). In addition, there may be evidence of sporadic, very heavy water clusters or ice crystals in the IES observations (Burch et al. 2015; Gombosi et al. 1991).
Another indication of the extent of the ion-neutral chemistry is the formation of protonated molecules such as H3O+ and HCO+. The mass 19 to mass 18 and mass 29 to mass 28 ratios in Fig. 7 show that protonation is weak in the coma when the density at the spacecraft and outgassing rates are low (6 × 106 cm-3, corresponding to ~ 5 × 1025 molecules/s). Significantly more protonation occurs when the outgassing rate is about three times higher (3.2 × 107 cm-3, corresponding to ~ 2.5 × 1026 molecules/s).
A simple model that used a limited set of reactions of H2O and CO was constructed to predict the maximum mass 19 to mass 18 and mass 29 to mass 28 ratios in a water-dominated neutral coma of a weakly outgassing comet. Figure 7 compares the predictions from this simple model to the observations. The model predicts mass 19 to mass 18 and mass 29 to mass 28 ratios that are lower than one when the outgassing is low. However, the production of H3O+ rapidly rises as the outgassing rate increases and the production of HCO+ rises less rapidly. At higher outgassing rates, the simple model is not consistent with observations for the mass 19/mass 18 ratio, but is more consistent with the observation for the mass 29/mass 28 ratio. The simple model compares well with results from special runs of a full chemical model except for mass 29/mass 28 at high outgassing rates. This favorable comparison indicates that, at least at low outgassing rates, the chemical composition is well described by this simple model. At higher outgassing rates, the full chemical model includes a significant loss term for HCO+ (Eq. (7)). This reaction is responsible for a significant reduction in the mass 29/mass 28 ratio that is not seen in the observations. In this high outgassing case, the simple model, without this loss term, agrees better with the observations. The reason may be due to a different neutral composition or a different neutral temperature (as the reaction rate in Eq. (7) is dependent neutral temperature). However, there are other factors that may also affect the mass 29/mass 28 ratio (see below). Obviously, a more detailed investigation with the full model is needed to determine why there are small mass 19/mass 18 ratios when the outgassing is somewhat higher than the low outgassing rate of 5 × 1025 molecules/s in a water-dominated neutral coma. In a full chemical model, NH3 may become important and help explain the conversion of H3O+ into H2O and the growth of NH4+ in the coma (Allen et al. 1987; Geiss et al. 1991; Altwegg et al. 1993; Haider et al. 1993; Vigren & Galand, 2013). However, the similar mass 19/mass 18 ratios from the comparison of the simple and full chemical models demonstrates that, at low outgassing, NH3 does not play a significant role. Densities above about 3 × 107 cm-3 at 30 km (equivalent to an outgassing rate of about 2.5 × 1026 molecules/s) probably requires a full chemical model with additional ionization by charge exchange, a realistic electron environment (Clark et al. 2015), and a correct treatment of NH3.
One possible explanation for the high mass 29 to mass 28 ratios in Fig. 6 may be that there is a significant contribution to mass 29 from C2H5+. The origin of C2H5+ is unclear because it could have C2H6+, C2H4+, or some higher order Carbon molecule as its parent. The low-resolution ion measurements in Fig. 6 show that, at times, there could be a contribution from C2H5+ to mass 29. Thus, there are indirect suggestions that C2H5+ may be a contributor to mass 29, but a more detailed analysis is warranted.
It is interesting that spectrum (b) in Fig. 6 was obtained when the mass 29/mass 28 ratio was high and the spacecraft was at high northern latitudes. This spectrum is representative of all observations from November 2014 at high densities in the mass 29/mass 28 panel in Fig. 7. In November 2014, the northern hemisphere was in summer, the outgassing was dominated by H2O (neutral measurements indicate that the CO/H2O density ratio was approximately 10%). In contrast, the observations from moderate northern and high southern latitudes (see Table 3 were obtained when the outgassing was low and the CO/H2O and CO2/H2O density ratios were much higher (Hässig et al., 2015). When the CO and CO2 densities become high, there is more chemistry, even for a simple model that predicts the mass 19/mass 18 ratio and the mass 29/mass 28 ratio at higher outgassing rates. In particular, the reactions in Eqs. 8 and 9 compete with the reactions in Eqs. (5) and (6) to modify the HCO+ and CO+ number densities. 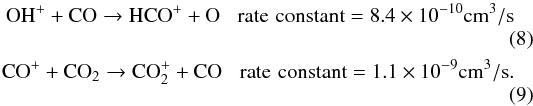 Combining additional observations with time-dependent, full chemical models that take into account a variable CO/H2O density ratio in the coma may help explain the differences in the observed and predicted mass ratios and the variable contribution of C2H5+ to mass 29.
Acknowledgments
The Rosetta/ROSINA and IES teams consist of many individuals who worked over a period of more than 20 years to achieve the spectacular successes from the Rosetta mission encounter with comet 67P. The authors are deeply indebted to these individuals. Research at Southwest Research Institute was conducted under subcontract Number 1496541 from the Jet Propulsion Laboratory. Work at the Belgian Institute for Space Aeronomy is supported by the Belgian Science Policy Office through Prodex/ROSINA PEA 90020. Work at Imperial College London is supported by the consolidated grant from the Science and Technology Facilities Council (STFC) to the college. Work at LATMOS and IRAP is supported by funding from CNES. Work at the Swedish Institute of Space Physics is supported by the Swedish National Space Board.
References
- Allen, M., Delitsky, M., Huntress, W., Yung, Y., & Ip, W.-H. 1987, A&A, 187, 502 [NASA ADS] [Google Scholar]
- Altwegg, K., Balsiger, H., Geiss, J., et al. 1993, A&A, 279, 260 [NASA ADS] [Google Scholar]
- Altwegg, K., Balsiger, H., & Geiss, J. 1994, A&A, 290, 318 [NASA ADS] [Google Scholar]
- Anicich, V. G. 1993, J. Phys. Chem. Ref. Data, 22, 6 [Google Scholar]
- Balsiger, H., Altwegg, K., Buhler, F., et al. 1986, Nature, 321, 330 [Google Scholar]
- Balsiger, H., Altwegg, K., Bochsler, P., et al. 2007, Space Sci. Rev., 128, 745 [NASA ADS] [CrossRef] [Google Scholar]
- Benna, M., & Mahaffy, P. R. 2006, Geophys. Res. Lett., 33, L10103 [NASA ADS] [CrossRef] [Google Scholar]
- Bhardwaj, A. 2003, Geophys. Res. Lett., 30, 24, PLA2-1 [Google Scholar]
- Bieler, A., Altwegg, K., Balsiger, H., et al. 2015, A&A, 583, A7 [NASA ADS] [CrossRef] [EDP Sciences] [Google Scholar]
- Broiles, T. W., Burch, J. L., Clark, G., et al. 2015, A&A, 583, A21 [NASA ADS] [CrossRef] [EDP Sciences] [Google Scholar]
- Burch, J. L., Goldstein, R., Cravens, T. E., et al. 2007, Space Sci Rev., 128, 697 [NASA ADS] [CrossRef] [Google Scholar]
- Burch, J. L., Cravens, T. E., Llera, K., et al. 2015, Geophys. Res. Lett., 42, 5125 [NASA ADS] [CrossRef] [Google Scholar]
- Clark, G., Broiles, T. W., Burch, J. L., et al. 2015, A&A, 583, A24 [NASA ADS] [CrossRef] [EDP Sciences] [Google Scholar]
- Coates, A. J., Johnstone, A. D., Wilken, B., Jochers, K., & Glassmeier, K.-H. 1989, J. Geophys. Res., 94, 9983 [NASA ADS] [CrossRef] [Google Scholar]
- Fuselier, S. A., Feldman, W. C., Bame, S. J., Smith, E. J., & Scarf, F. L. 1986, Geophys. Res. Lett., 13, 247 [NASA ADS] [CrossRef] [Google Scholar]
- Galeev, A. A., Cravens, T. E., & Gombosi, T. I. 1985, ApJ, 289, 807 [NASA ADS] [CrossRef] [Google Scholar]
- Geiss, J., Altwegg, K., Anders, E., et al. 1991, A&A, 247, 226 [NASA ADS] [Google Scholar]
- Gombosi, T. I., Burch, J. L., & Horányi, M. 2015, A&A, 583, A23 [NASA ADS] [CrossRef] [EDP Sciences] [Google Scholar]
- Gulkis, S., Allen, M., von Allmen, P., et al. 2015, Science, 347, 0709 [Google Scholar]
- Haider, S. A., & Bhardwaj, A. 2005, Icarus, 177, 196 [NASA ADS] [CrossRef] [Google Scholar]
- Haider, S. A., Bhardwaj, A., & Singhal, R. P. 1993, Icarus, 101, 234 [NASA ADS] [CrossRef] [Google Scholar]
- Hässig, M., Altwegg, K., Balsiger, H., et al. 2015, Science, 347, 0276 [CrossRef] [Google Scholar]
- Hill, T. W., Thomsen, M. F., Tokar, R. L., et al. 2012, J. Geophys. Res., 117, A5 [Google Scholar]
- Huebner, W. F., D. C., Boice, H. U., Schmidt, & Wegmann, R. 1991, Structure of the coma: chemistry and solar wind interaction, in Comets in the Post-Halley Era, eds. R. L. Newburn et al. (The Netherlands: Kluwer Academic Publishers), 2, 907 [Google Scholar]
- Huebner, W. F., Keady, J. J., & Lyon, S. P. 1992, Astrophys. Space Sci., 195, 1 [Google Scholar]
- Ip, W. H. 2004, Global solar wind interaction and ionospheric dynamics, in Comets II, eds. M. Festou et al. (Arizona, USA: University of Arizona Press), 605 [Google Scholar]
- Ip, W. H., & Axford, I. 1987, Nature, 325, 418 [NASA ADS] [CrossRef] [Google Scholar]
- Neubauer, F. M., Glassmeier, K. H., Pohl, M., et al. 1986, Nature, 321, 352 [NASA ADS] [CrossRef] [Google Scholar]
- Nilsson, H., Stenberg Wieser, G., Behar, Et., et al. 2015, Science, 347, 0571 [NASA ADS] [CrossRef] [Google Scholar]
- Rubin, M., Hansen, K. C., Gombosi, T. A., et al. 2009, Icarus, 199, 505 [NASA ADS] [CrossRef] [Google Scholar]
- Rubin, M., Altwegg, K., Balsiger, H., et al. 2015, Science, 348, 232 [NASA ADS] [CrossRef] [Google Scholar]
- Schläppi, B. 2011, Ph.D. Thesis, University of Bern [Google Scholar]
- Schmidt, H. U., & Wegmann, R. 1982, Plasma flow and magnetic fields in comets, ed. L. L. Wilkening (University of Arizona Press), 538 [Google Scholar]
- Shelley, E. G., Fuselier, S. A., Balsiger, H., et al. 1987, A&A, 187, 304 [NASA ADS] [Google Scholar]
- Vigren, E., & Galand, M. 2013, ApJ., 772 [Google Scholar]
- Wegmann, R., Schmidt, H. U., Huebner, W. F., & Boice, D. C. 1987, A&A 187, 339 [NASA ADS] [Google Scholar]
- Wurz, P., Rubin, M., Altwegg, K., et al. 2015, A&A, 583, A22 [NASA ADS] [CrossRef] [EDP Sciences] [Google Scholar]
All Tables
Estimates of pickup ion parameters in the coma and assumptions that are used to derive these parameters.
Ion mass peaks observed by DFMS and the predominant ion in the peak, determined from high-resolution mass spectra.
All Figures
|
Fig. 1 Schematic location of the comet, spacecraft, and Sun at the end of October 2014. The spacecraft was ~30 km from the comet in a bound, terminator orbit. Other ion observations in this paper are from a distance of 30 km. |
| In the text | |
|
Fig. 2 Rosetta IES observations of solar wind ions on 30 October 2014 from 2200 to 2300 UT. This energy-angle plot shows the arrival anode of solar wind and cometary ion fluxes. The directions to the Sun and comet are shown. Solar wind H+ and He2+ are propagating at the same speed of 370 km s-1 (and therefore He2+ appears at twice the H+ energy per charge in the IES electrostatic analyzer). The solar wind is not propagating radially away from the Sun because of cometary ion pickup. The extent and direction of the deflection depend on the comet outgassing rate and the orientation of the solar wind magnetic field. The existence of He+ is further evidence of the interaction with the comet coma. It is created by charge exchange of solar wind He2+ with cometary neutrals. |
| In the text | |
|
Fig. 3 Schematic representation of cometary ion pickup. The ecliptic plane is shown and the magnetic field is assumed to be located in that plane. Cometary ions are created at rest with respect to the solar wind. These ions respond to the solar wind electric field by gyrating around the solar wind magnetic field. When fully picked up, the cometary ions form a ring distribution. The intersection of this ring with the plane that contains the magnetic field and the solar wind is shown. In response, the solar wind is deflected. The relatively small deflection shown in this schematic is consistent with the deflection in Fig. 2. DFMS has a very narrow field of view (shown by the green wedge) and detects low-energy ions from the comet. It does not detect the entire cometary ion distribution because pickup ions move in a direction and have an energy that is outside of the field of view and energy window of DFMS. |
| In the text | |
|
Fig. 4 Two days of neutral and ion measurements from ROSINA/COPS and DFMS. The measurements were taken 20 km from the comet, span all longitudes, and the latitude range from 0 to -46°. COPS measurements of the total neutral density at the spacecraft (green dots) show diurnal variations of up to a factor of 5 (ranging from ~1 × 107 cm-3 to 5 × 107 cm-3) with a six-hour period. DFMS observations of neutral H2O (mass 18, with the intensity in arbitrary units) show the same diurnal variations. Ion measurements from 12 to 24 UT on 6 December 2014 and from 23 to 24 UT on 7 December 2014 are almost four orders of magnitude lower than the neutral signal. Accounting for differences in the efficiencies for detecting ions and neutrals, the ion density measured by DFMS is about 0.1 cm-3. |
| In the text | |
|
Fig. 5 Low-resolution ion spectrum from mass 13.5 to 19.5 u/e. There may be a peak at mass 14 (probably CH |
| In the text | |
|
Fig. 6 Low-resolution ion spectra from mass 26 to 30 u/e for two different time periods. The mass resolution is insufficient to resolve CN+ from C2H |
| In the text | |
|
Fig. 7 Top panel: ion mass 19/mass 18 (H3O+/H2O+) and bottom panel: ion mass 29/mass 28 ((HCO+ and possibly C2H |
| In the text | |
|
Fig. 8 Results from the simplified coma model for a water-dominated coma and low outgassing rate. All ion number densities decrease with increasing distance from the comet because of competing factors of the 1/r2 density decrease and the increases and decreases due to ionization and ion-neutral chemistry. Whereas the chemical equations that govern the H3O+ and HCO+ number densities have no loss terms in this simple model, the equations that govern the H2O+ and CO+ number densities do have loss terms. Therefore, the H3O+ and HCO+ number densities decrease more slowly than those for H2O+ and CO+. At 30 km from the comet, the H3O+/H2O+ and HCO+/CO+ ratios are both lower than 1, indicating weak ion-neutral chemistry for this low outgassing case. |
| In the text | |
|
Fig. 9 Results from the simplified coma model for a water-dominated coma and high outgassing rate. Unlike the low outgassing case in Fig. 8, the H3O+/H2O+ ratio is significantly greater than 1, indicating stronger ion-neutral chemistry for this high outgassing case. Even though there is stronger ion-neutral chemistry, the HCO+/CO+ ratio is only slightly greater than 1. |
| In the text | |
Current usage metrics show cumulative count of Article Views (full-text article views including HTML views, PDF and ePub downloads, according to the available data) and Abstracts Views on Vision4Press platform.
Data correspond to usage on the plateform after 2015. The current usage metrics is available 48-96 hours after online publication and is updated daily on week days.
Initial download of the metrics may take a while.