Fig. 5
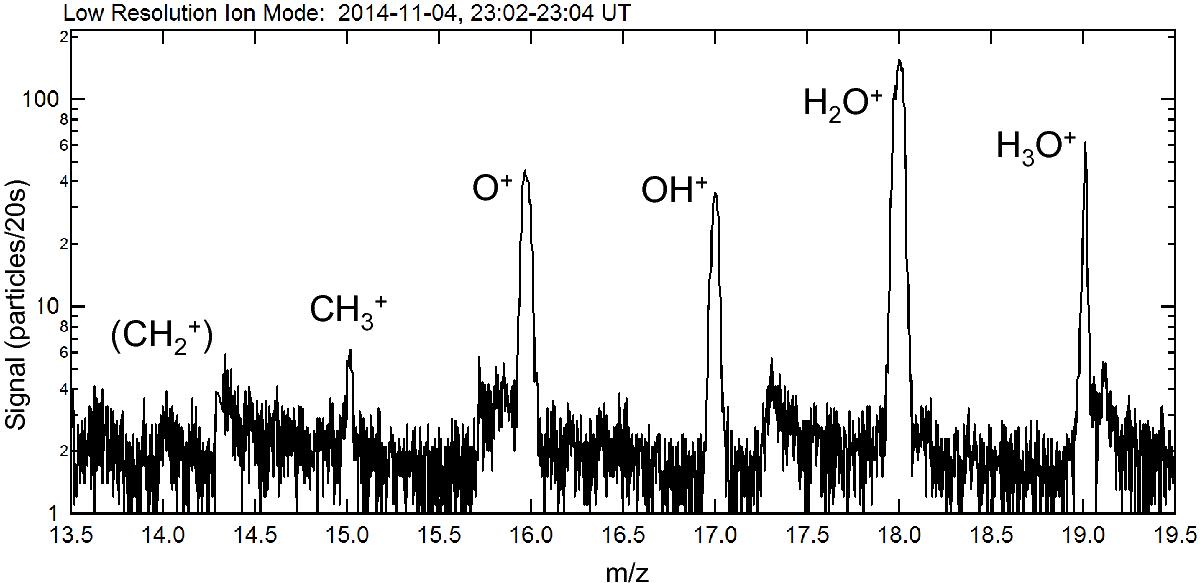
Low-resolution ion spectrum from mass 13.5 to 19.5 u/e. There may be a peak at mass 14 (probably CH![]() ) and there are certainly peaks at mass 15 through mass 19 (primarily water group ions, with H3O+ at mass 19, and O+, CH
) and there are certainly peaks at mass 15 through mass 19 (primarily water group ions, with H3O+ at mass 19, and O+, CH![]() , at mass 16 and 15, respectively). Apparent peaks at masses 13.6, 14.4, and 17.4 are not real. They are the result of a combination of mass spectra with a gradient in the offset across the DFMS detector.
, at mass 16 and 15, respectively). Apparent peaks at masses 13.6, 14.4, and 17.4 are not real. They are the result of a combination of mass spectra with a gradient in the offset across the DFMS detector.
Current usage metrics show cumulative count of Article Views (full-text article views including HTML views, PDF and ePub downloads, according to the available data) and Abstracts Views on Vision4Press platform.
Data correspond to usage on the plateform after 2015. The current usage metrics is available 48-96 hours after online publication and is updated daily on week days.
Initial download of the metrics may take a while.