Fig. 6
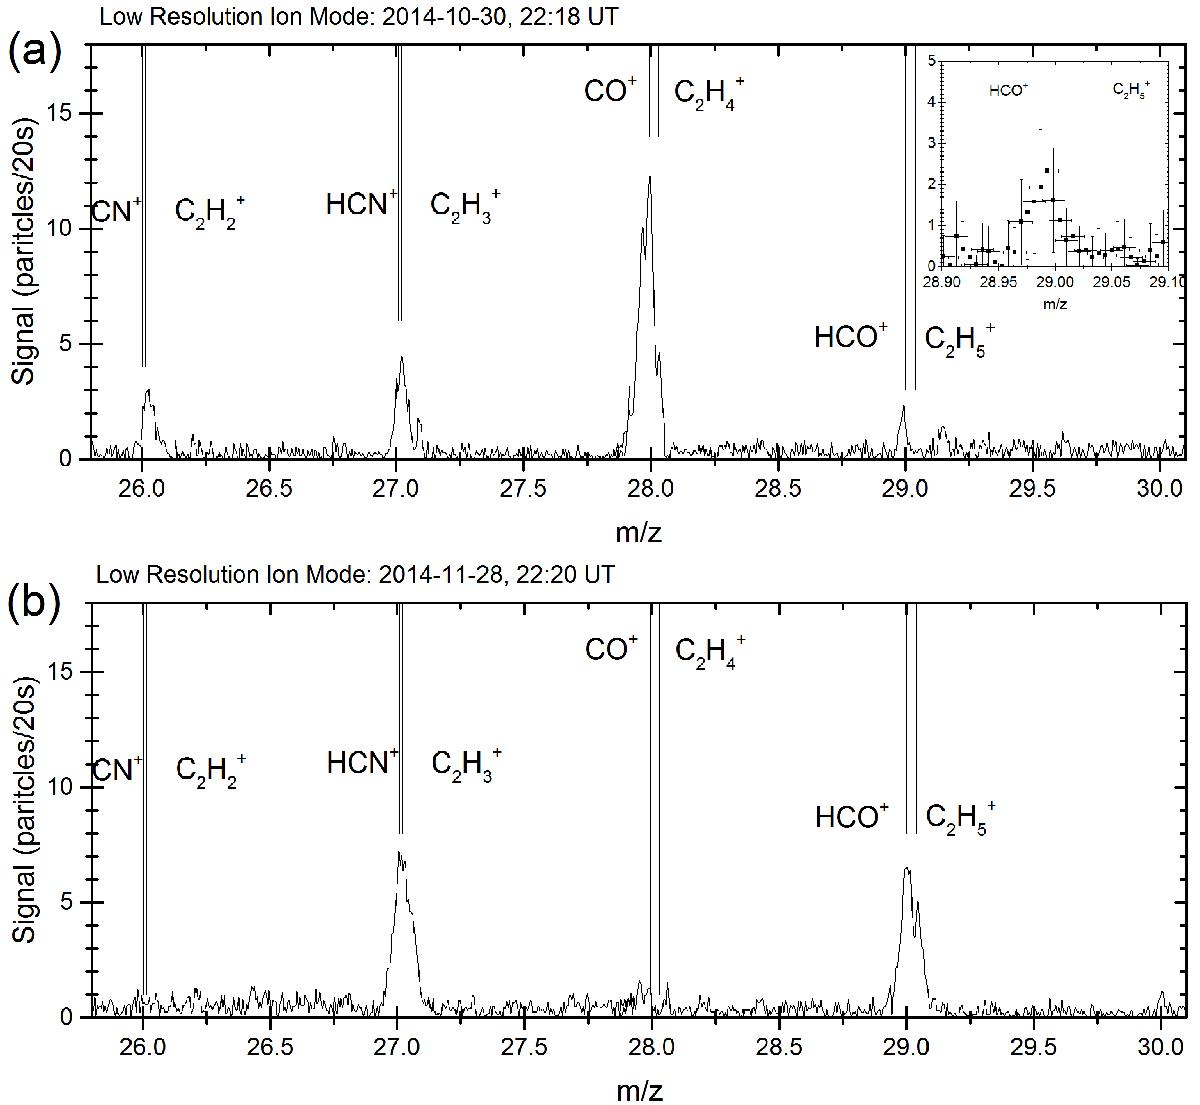
Low-resolution ion spectra from mass 26 to 30 u/e for two different time periods. The mass resolution is insufficient to resolve CN+ from C2H![]() or HCN+ from C2H
or HCN+ from C2H![]() at masses 26 and 27, respectively. In the top panel, clear evidence is shown that CO+ dominates mass 28 and HCO+ dominates mass 29. The inset shows a zoom-in for mass 29, the smallest peak. The error bars in the inset are dominated by the ion statistical uncertainties in the signal and uncertainties in the mass calibration are given as horizontal error bars. The bottom panel shows very little CO+ and there may be a contribution from C2H
at masses 26 and 27, respectively. In the top panel, clear evidence is shown that CO+ dominates mass 28 and HCO+ dominates mass 29. The inset shows a zoom-in for mass 29, the smallest peak. The error bars in the inset are dominated by the ion statistical uncertainties in the signal and uncertainties in the mass calibration are given as horizontal error bars. The bottom panel shows very little CO+ and there may be a contribution from C2H![]() to mass 29. The bottom panel also shows a possible peak at mass 30.
to mass 29. The bottom panel also shows a possible peak at mass 30.
Current usage metrics show cumulative count of Article Views (full-text article views including HTML views, PDF and ePub downloads, according to the available data) and Abstracts Views on Vision4Press platform.
Data correspond to usage on the plateform after 2015. The current usage metrics is available 48-96 hours after online publication and is updated daily on week days.
Initial download of the metrics may take a while.