| Issue |
A&A
Volume 581, September 2015
|
|
|---|---|---|
| Article Number | A73 | |
| Number of page(s) | 11 | |
| Section | Stellar structure and evolution | |
| DOI | https://doi.org/10.1051/0004-6361/201424933 | |
| Published online | 07 September 2015 | |
VLT X-Shooter spectroscopy of the nearest brown dwarf binary⋆,⋆⋆
1 Instituto de Astrofísica de Canarias (IAC), Calle Vía Láctea s/n, 38200 La Laguna, Tenerife, Spain
e-mail: This email address is being protected from spambots. You need JavaScript enabled to view it.
; This email address is being protected from spambots. You need JavaScript enabled to view it.
; This email address is being protected from spambots. You need JavaScript enabled to view it.
2 Departamento de Astrofísica, Universidad de La Laguna (ULL), 38205 La Laguna, Tenerife, Spain
3 Centro de Astrobiología (CSIC-INTA), Ctra. Ajalvir km 4, 28850 Torrejón de Ardoz, Madrid, Spain
e-mail: This email address is being protected from spambots. You need JavaScript enabled to view it.
4 Consejo Superior de Investigaciones Científicas, CSIC, Spain
5 Main Astronomical Observatory of the National Academy of Sciences of Ukraine, Ukraine
6 Center for Astrophysics Research, University of Hertfordshire, College Lane, Hatfield, Hertfordshire AL10 9AB, UK
7 Universidad Politécnica de Cartagena, Campus Muralla del Mar, Cartagena, 30202 Murcia, Spain
Received: 5 September 2014
Accepted: 30 June 2015
Abstract
Aims. The aim of the project is to characterise the two components of the brown dwarf system nearest to the Sun, WISE J104915.57−531906.1 (also called Luhman 16AB) at optical and near-infrared wavelengths.
Methods. We obtained high signal-to-noise intermediate-resolution (R ~ 6000−11 000) optical (600−1000 nm) and near-infrared (1000−2480 nm) spectra of each component of Luhman 16AB with the X-Shooter instrument on the Very Large Telescope.
Results. We classify the primary and secondary of the Luhman 16 system as L6−L7.5 and T0±1, respectively, in agreement with previous measurements published in the literature. We present measurements of the lithium pseudo-equivalent widths, which appear of similar strength in both components (8.2 ± 1.0 Å for the L and 8.4 ± 1.5 Å for the T component). The presence of lithium (7Li) in both components implies masses lower than 0.06 M⊙, while the comparison with models suggests lower limits of 0.04 M⊙. The detection of lithium in the T component is the first of its kind. Similarly, we assess the strength of other alkali lines (e.g. pseudo-equivalent widths of 6−7 Å for RbI and 4−7 Å for CsI) present in the optical and near-infrared regions and compare with estimates for L and T dwarfs. We also derive effective temperatures and luminosities of each component of the binary: −4.66 ± 0.08 dex and 1305+180-135 K for the L dwarf and −4.68 ± 0.13 dex and 1320+185-135 K for the T dwarf. According to our radial velocity determinations, the binary does not appear to belong to any of the well-known moving group. Our preliminary theoretical analysis of the optical and J-band spectra indicates that the L- and T-type spectra can be reproduced with a single temperature and gravity but different relative chemical abundances, which strongly affects the spectral energy distribution of L/T transition objects.
Key words: techniques: spectroscopic / brown dwarfs / binaries: general / stars: fundamental parameters
Based on observations collected at the European Southern Observatory, Chile, under DDT programme 290.C-5200(B) (PI Lodieu).
FITS files of the reduced spectra are only available at the CDS via anonymous ftp to cdsarc.u-strasbg.fr (130.79.128.5) or via http://cdsarc.u-strasbg.fr/viz-bin/qcat?J/A+A/581/A73
© ESO, 2015
1. Introduction
Since the discovery of the first brown dwarfs in 1995 (Nakajima et al. 1995; Rebolo et al. 1995), the field of substellar research has made enormous progress with the discovery of more than 1000 nearby ultracool dwarfs, defined as objects with spectral types later than M7, which include L (~1300−2200 K; Martín et al. 1999; Kirkpatrick et al. 2000; Basri et al. 2000; Leggett et al. 2000) and T dwarfs (~1300−600 K; Burgasser et al. 2006). The coolest brown dwarfs ever found to date, originally nicknamed Y dwarfs (Kirkpatrick et al. 1999), have been announced by the team of the Wide Infrared Survey Explorer (WISE; Wright et al. 2010) (Cushing et al. 2011; Kirkpatrick et al. 2012; Tinney et al. 2012). The Y dwarfs have estimated temperatures of 500−300 K and masses lower than 0.01 M⊙, according to most recent models (Cushing et al. 2011).
Observing logs of the VLT X-Shooter observations and information on the wavelength range, resolution, and properties of the three arms of the X-Shooter spectrograph.
During the past decade, ϵ Indi B was the closest brown dwarf binary to the Sun, located at 3.626 ± 0.009 pc from the Sun (Scholz et al. 2003; McCaughrean et al. 2004). It has a mean projected physical separation of 2.65 au (0.75 arcsec) and is located at ~1500 au from ϵ Indi A (Torres et al. 2006; van Leeuwen 2007). It is the best-studied pair of brown dwarfs with the highest quality dataset to date (King et al. 2010). In March 2013, Luhman (2013) announced the discovery of a nearby brown dwarf with an optical spectral type of L8 at a distance of 2.00 ± 0.15 pc, WISE J104915.57−531906.1A, which was resolved as a close binary (physical separation of 3 au) in the i band. Mamajek (2013) proposed to call this new nearby brown dwarf binary Luhman 16AB because of its proximity to the Sun. The detection of the lithium in absorption at 6708 Å in the optical spectrum of the primary Luhman (2013) and later in both components unambiguously places the system in the substellar regime (Faherty et al. 2014). It is brighter than ϵ Indi B by 1.5 mag in J and 2 mag in I. It is the third closest system to the Sun, after the Centauri system and Barnard’s star. Thus, it represents the best substellar system available for detailed characterisation of its spectral energy distribution and a unique target for understanding the chemical processes at play at low temperatures and accross the L/T transition (Burgasser et al. 2014). This system also provides a rare opportunity to obtain high-resolution and high signal-to-noise spectroscopy at optical and infrared wavelengths to test the mass-luminosity-age relation predicted by current models as well as the chemistry, vertical mixing, abundances of the various species present in substellar atmospheres, the role of clouds (Crossfield et al. 2014), variability (Gillon et al. 2013), and search for planets (Boffin et al. 2014).
In this paper we present medium-resolution optical and near-infrared spectra for each component of the brown dwarf binary nearest to the Sun, Luhman 16AB (originally known as WISE J104915.57−531906.1; Luhman 2013). Kniazev et al. (2013) presented resolved optical spectroscopy covering the 670−900 nm range, while Burgasser et al. (2013) published low-resolution (120−300) near-infrared (700−2500 nm) spectra for each component. Faherty et al. (2014) presented medium-resolution optical (R ~ 4000) and near-infrared (R ~ 8000) of each component of the system during the writing of this manuscript. In Sect. 2, we describe the observations conducted in service mode with X-Shooter on the European Southern Observatory (ESO) Very Large Telescope (VLT) and the associated data reduction. In Sect. 3, we assign spectral types to each component of the system and discuss the strength of the various alkali lines, including lithium. In Sect. 4, we derive physical parameters such as temperature and luminosity for each component of the binary. In Sect. 5, we derive the radial velocity of the system and discuss its membership to nearby moving groups. Synthetical spectra of the alkalis are computed and compared to the X-Shooter data in Sect. 6.
2. Optical to infrared spectroscopy
We carried out spectroscopy from the UV- to the K band with the X-Shooter cross-dispersed echelle spectrograph (D’Odorico et al. 2006; Vernet et al. 2011) mounted on the Cassegrain focus of the VLT Unit 2. Observations were carried out in service mode on 11 June 2013 under clear skies and a seeing between 0.6 and 0.85 arcsec to ensure that both components of the binary system were resolved over the full wavelength range covered by X-Shooter. More details on the properties of the X-Shooter spectrograph and the logs of the observations are provided in Table 1.
The acquisition of the target was made through an optical CCD with the Sloan z-band filter, which is not problematic considering the brightness of the source. We set the individual on-source integration times to one exposure of 360 s, one of 330 s, and six of 52 s in the UVB, VIS, and NIR arms, respectively, repeated five times with a maximum nod-throw of 5′′ to correct for the sky contribution (mainly) in the near-infrared. The field of view and the slit were rotated by a position angle of −47 degrees to place both components in the slit. Hence, the observations were not conducted with the slit orientated along the parallactic angle. We caution about using the optical spectrum of each component of the binary for accurate spectral classification because of the effect of differential refraction particularly at high air masses. However, the relative fluxes between components remain unaffected because the two sources are separated by about 1.̋5 and have similar spectral types, hence, they are probably affected in the same way.
Data reduction was performed separately for the VIS and NIR arms. We discarded the UVB arm because no obvious signal is registered from any of the components. We applied standard procedures for optical and visible wavelengths, which include sky subtraction and flat-field correction. All steps were carried out with routines within the Image Reduction and Analysis Facility (IRAF1) environment (Tody 1986, 1993). Spectra were optimally extracted with the APALL command of the ECHELLE package in IRAF. Each pair member was extracted separately using the same aperture size to define the extraction and background regions on the detectors. A third-order polynomial was employed per echelle order to trace the spectra across the detectors. Wavelength calibration was performed to a typical accuracy of ±0.05 Å using ThAr (VIS) and ArKrXeNe (NIR) arcs taken with the same instrumental configuration as our targets. The spectra of the B9V star HIP 56470 observed immediately after Luhman 16AB with an air mass within ±0.1 were used for division into the corresponding VIS and NIR science spectra. We previously removed the hydrogen lines intrinsic to this hot star. Finally, we multiplied the science spectra by a blackbody of temperature 10 700 K corresponding to B9V. Individual echelle orders were merged by matching the counts in common wavelength ranges from one order to the next. We observe a peak and a dip around 2.08–2.09 microns in the spectra of the components of the system not seen in other T dwarfs, as a potential artefact in our X-Shooter data. Although we could not remove it, it does not affect our scientific interpretation as a potential artefact. The other regions of the spectra are not affected by any other strong artefact(s). The final optical and near-infrared one-dimensional spectra are displayed in Figs. 1 and 2. The latter also includes known L and T dwarf templates from the literature (Knapp et al. 2004; Golimowski et al. 2004a; Burgasser et al. 2004; Chiu et al. 2006; Looper et al. 2007).
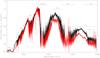 |
Fig. 1 Comparison of the X-Shooter optical and near-infrared spectra of the L (black line) and T (red line) components of the Luhman 16AB brown dwarf binary. Both spectra are normalised to unity at 1300 nm to highlight the differences in spectroscopic features of the two components. Both spectra are also corrected for telluric contribution. The main spectral features present in L and T dwarfs are highlighted. |
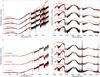 |
Fig. 2 Top panels: VLT X-Shooter optical (left) and near-infrared (right) spectra corrected for telluric lines for the L dwarf component of Luhman 16AB. Bottom panels: same but for the T component of Luhman 16AB. Overplotted as red lines are spectral standards downloaded from the SpeX archive and Sandy Leggett’s webpage: 2MASS J15074769−162738.6 (L5–L5.5; Reid et al. 2000; Dahn et al. 2002; Kirkpatrick et al. 2000; Knapp et al. 2004), 2MASSs J0850359+105716 (L6; Kirkpatrick et al. 1999), 2MASSI J0103320+193536 (L7; Kirkpatrick et al. 2000), 2MASS J16322911+1904407 (L7.5; Leggett et al. 2002; Geballe et al. 2002), 2MASS J03105986+1648155 (L9; Kirkpatrick et al. 2000; Burgasser et al. 2006; Reid et al. 2001; Leggett et al. 2002; Geballe et al. 2002), SDSS J04234857−0414035 (T0; Leggett et al. 2000; Geballe et al. 2002; Cruz et al. 2003; Burgasser et al. 2006), SDSS J08371721−0000180 (T1; Leggett et al. 2000, 2002; Burgasser et al. 2006; Kirkpatrick et al. 2008), and SDSSp J125453.90-012247.4 (T2; Leggett et al. 2000; Burgasser et al. 2004). All optical and near-infrared spectra are normalised at ~840−860 nm and 1300 nm to ease the comparison. |
3. Spectroscopic properties of each component
3.1. Spectral types
In Fig. 1, we compare the full spectra (660−2500 nm), normalised at ~1300 nm, of the L and T components (Luhman 16A and Luhman 16B). The L component is relatively brighter than the T component bluewards of 1000 nm. The overall fluxes are very similar in the J band while the L component dominates in the H and K bands. We confirm that Luhman 16A is of earlier type than Luhman 16B.
We assigned spectral types to each component of the binary, using direct comparison with known L and T spectral templates both at optical and near-infrared wavelengths available at the SpeX archive2 and Sandy Leggett’s homepage3 (Chiu et al. 2006; Golimowski et al. 2004a; Knapp et al. 2004). We classified each component separately in the optical and the near-infrared. The optical spectrum of the T component is best fit by the L9 template 2MASS J03105986+1648155 (Kirkpatrick et al. 2000; Burgasser et al. 2006; Reid et al. 2001; Leggett et al. 2002; Geballe et al. 2002), while its near-infrared spectrum is best reproduced by the T0 template SDSS J04234857−0414035 (T0; Leggett et al. 2000; Geballe et al. 2002; Cruz et al. 2003; Burgasser et al. 2006) with an uncertainty of one subtype (Fig. 2). The L component is not well reproduced by any of the L dwarf spectral templates over the full spectral energy range.
Our final spectral classifications, T0 ± 1 for Luhman 16B and L6–L7.5 to Luhman 16A (Fig. 2), agree with previous studies, such as Burgasser et al. (2013, L7.5 ± 0.5 and T0.5 ± 0.5 and Kniazev et al. (2013, L8 ± 1 and T1 ± 2.
3.2. Molecules
In the optical spectra of both components, we observe a wide pressure-broadened potassium doublet around 760 nm. We can also see the FeH, CrH, and H2O absorption bands at ~860 nm, ~870 nm, and ~930 nm, respectively, pointing towards cool temperatures and late spectral types (Kirkpatrick et al. 1999, 2000; Reid et al. 2000).
In the near-infrared, we observe a stronger methane absorption band at around 1.1−1.2 microns in the T component, indicating a potentially cooler temperature. By comparison, the shape of the spectra in the H band appear very similar, pointing towards a small difference in spectral type. We detect the onset of methane (CH4) absorption at 2.12 μm in Luhman 16B, which clearly indicates a T spectral type. Additionally, we find CO in absorption at 2.3 μm in both L and T components. The co-existence of CH4 and CO hints at a peculiar carbon chemistry.
3.3. Lithium 7 ( Li)
Li)
The presence of lithium in the atmospheres of fully convective dwarfs cooler than M6 has been widely used as a solid criterion for substellarity (Rebolo et al. 1992; Basri et al. 2000; Kirkpatrick et al. 2008, and references therein). We detect the lithium resonance doublet at 670.782 nm in both components, thus confirming their brown dwarf nature and masses ≤0.060 M⊙ independently of the age of the binary. This is the first detection of Li i absorption in a T dwarf (also pointed out by Faherty et al. 2014). We measured the equivalent width of the spectral feature (note that the doublet is not resolved) with respect to the objects’ relative continuum or pseudo-continuum modulated by the strong absorptions due to Na i to the blue and K i to the red. We therefore refer to pseudo-equivalent widths (pEWs). The integration of the line profile was always performed over the range 669.45−672.25 nm. Our measurements and their associated uncertainties (determined as the scatter of the measurements obtained by placing the pseudo-continuum up and down within the photon noise of the observed spectra) are provided in Table 2.
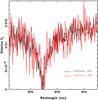 |
Fig. 3 Spectral profiles of the Li i resonance doublet at 670.782 nm seen in absorption. The lines of the two objects are similar in strength. The relative fluxes of both pair members are normalised to the mean pseudo-continuum around the Li i signature for a proper comparison. The data are free of telluric contribution. No smoothing has been applied. |
Interestingly, we find that both the primary and the secondary have similar lithium absorption intensities of pEW ≈ 8−9 Å within the error bars despite their differing spectral types. Figure 3 illustrates the Li i profiles of Luhman 16A and Luhman 16B. This contrasts with the Li i pEWs reported by Faherty et al. (2014). These authors used spectra of resolution R ~ 4000 at I-band taken 1.5 months earlier than our X-Shooter data and derived that the T-type component showed a lithium spectral signature smaller (pEW = 3.8 ± 0.4 Å) than that of the L-type component (pEW = 8.0 ± 0.4 Å). While our pEW measurement agrees with result of Faherty et al. (2014) at the 1σ level for the L dwarf, there is a discrepancy by a factor of ~2 for the T component. We repeated our procedure on the optical spectra kindly provided by Jackie Faherty and measured similar pEWs in Luhman 16A and Luhman 16B of the order of 7−8 Å, in excellent agreement with our X-Shooter pEWs. Thus, the different pEWs determinations are most likely due to distinct measurement techniques and not to variability.
Pseudo-equivalent widths (in Å) of atomic features.
Our Li i pEWs and those of Faherty et al. (2014) are depicted as a function of spectral type in Fig. 4. To consider our values in context, we also include pEWs of field late-M, L, and T dwarfs given by Tinney (1998), Kirkpatrick et al. (1999, 2000, 2008), Pavlenko et al. (2007a), Cruz et al. (2009), and Zapatero Osorio et al. (2014). As shown in Fig. 4, the measurement of Luhman 16A is consistent with the pEWs of L7–L8 dwarfs with lithium detections. There is a large scatter in Li i pEWs of L dwarfs that might be due to the uncertainties associated with the measurements and spectral types, the unequal spectral resolutions and ways of deriving pEWs by the various groups, distinct states of lithium depletion, variability, and/or diverse metallicity. However, Kirkpatrick et al. (2000, 2008) discussed that the strength of the Li i 670.782 nm line increases with later spectral type, peaks at L5–L6, and declines toward cooler types. As predicted by the theory of stellar and substellar chemistry (e.g. Burrows & Sharp 1999; Lodders & Fegley 2006), lithium is in atomic form above ~1500−1700 K at 1 bar pressure but is converted into molecules (LiOH, LiCl, LiH, etc.) at lower temperatures. The resulting effect on the observed spectral energy distribution is the depletion of the atomic lithium abundance and the decreasing intensity of the Li i absorption at 670.782 nm towards very low temperatures and late spectral types. Nevertheless, this feature is still present and remains detectable with relatively high strengths in early-Ts, as demonstrated by our observations of Luhman 16B and in agreement with the predictions made by Pavlenko et al. (2000), Allard et al. (2001), and Burrows et al. (2002a). Furthermore, the pEW = 8.4 ± 1.5 Å of Luhman 16B is compatible with the computed intensity of the Li i resonance doublet for Teff = 1000 − 1200 K, full lithium preservation, and moderate dust opacity given in Table 5 of Pavlenko et al. (2000).
The Li i subordinate line at 812.64 nm would be more easily detectable because there is more flux (better signal-to-noise data) in our targets than at 610.36 nm. The detection of one of these lines would provide direct evidence of the full preservation of lithium in the dwarf atmospheres, since the formation of the subordinate lines is extremely sensitive to the atomic abundance. Unfortunately, the detection of these lines in absorption also depends on the presence of dust opacity, which considerably reduces the line strength. We can impose an upper limit of 30 m Å on the Li i λ812.64 nm pEW for both components. A detailed spectral analysis of the binary data would be required to confirm whether lithium is fully preserved or depleted in the two components.
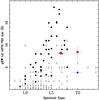 |
Fig. 4 Li i pseudo-equivalent widths (pEWs) of late-M, L, and T dwarfs. Data taken from Tinney (1998), Kirkpatrick et al. (1999, 2000, 2008), Pavlenko et al. (2007a), Cruz et al. (2009), and Zapatero Osorio et al. (2014) are shown with black dots (detections) and arrows (upper limits). Our pEWs of Luhman 16A (L6.75) and Luhman 16B (T0) are indicated with red dots, and the measurements of Faherty et al. (2014) are plotted as blue solid triangles. Values from Faherty et al. (2014) for Luhman 16A are slightly shifted in spectral type and pEW by +0.1 subtype and +0.1 Å, respectively, for clarity. |
3.4. Lithium 6 (6Li)
Altough the high superficial gravity in brown dwarfs produces a large broadening of the alkali lines, in particular of the 7Li resonance doublet, it is worth to study the potential presence of the more fragile 6Li isotope in low-mass brown dwarfs. According to theoretical computations (e.g. Nelson et al. 1993), 6Li, which is burnt at lower temperatures than 7Li, would be fully preserved in brown dwarfs of mass lower than 40 MJup. Given the potential masses and the brightness of the Luhman 16AB binary, these brown dwarfs offer the interesting opportunity for investigating the presence of 6Li. The isotopic shift between the doublets of 7Li and 6Li is only of 0.16 Å and therefore requires a fine spectral resolution and high signal-to-noise.
A detection of 6Li would clearly indicate a mass below 40 MJup. The lithium isotopic ratio in meteorites is 7Li/6Li ~ 12, and estimates in the interstellar medium give similar values (Lemoine et al. 1993), therefore the 6Li isotope is expected to introduce a weak asymmetry in the red wing of the lithium doublet. We investigated if there is any evidence for such an asymmetry in the spectrum of Luhman 16A (which has a better signal-to-noise ratio than Luhman 16B) by subtracting a Voigt and a Gaussian function from the observed profile. We found flat subtractions with no significant deviation (particularly in the red wing of the absorption) at the level of 1/8 of the Li relative flux (1σ) that could be attributed to 6Li. Higher spectral resolution and improved signal-to-noise ratio spectroscopy of the lithium feature is required to impose significant constraints on the presence of the lightest lithium isotope and in turn on the masses of these brown dwarfs.
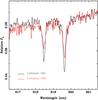 |
Fig. 5 Spectral profiles of Na i λ818.326 and λ819.482 nm subordinate lines. The relative fluxes of the two objects have been normalised to the mean pseudo-continuum redwards of λ819.482 nm. Spectra are telluric corrected and no smoothing is applied. |
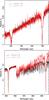 |
Fig. 6 Spectral profiles of Rb i (top) and Cs i (bottom) atomic lines of Luhman 16AB. The relative fluxes of the two objects have been normalised to the mean pseudo-continuum around Rb i and the Cs iλ852.11 nm lines for a proper comparison. These data are corrected for telluric contribution. The effect of the different Teff between the components becomes apparent in the slope of the pseudo-continua in the bottom panel. The Cs i λ894.35 nm line is blended with the absorption due to CrH and FeH. |
3.5. Other alkali lines
Rb i at 780.023 and 794.760 nm and Cs i at 852.115 and 894.348 nm are clearly seen in the X-Shooter optical spectra with pEWs given in Table 2. We measured these pEWs and their error bars in the same manner as for lithium. Figure 6 displays an enlargement of the X-Shooter spectra around the Rb i and Cs i lines; we did not smooth the data for this comparison. The intensity of the Rb i atomic signatures is quite similar within the error bars for both the L and T components (see top panel of Fig. 6), but Cs i appears to be slightly stronger in the T dwarf (bottom panel of Fig. 6), which may be an indication of its cooler temperature.
In contrast to the Li i resonance line (Sect. 3.3), our pEWs of Rb i and Cs i agree with the equivalent widths published by Faherty et al. (2014) within 1σ the uncertainty. The measured pEWs are also consistent with the values found for late-Ls and early-Ts in the literature (Kirkpatrick et al. 2000; Burgasser et al. 2003), as is illustrated in Fig. 7, where the strength of Cs i λ852.115 nm is shown as a function of spectral type. We chose this Cs i feature because it is located far redward of the strong K i absorption in the optical and it is not blended with other atomic or molecular absorptions. To complete the displayed data, we measured pEWs over optical spectra of field L6–T6 dwarfs available to us that were published by Kirkpatrick et al. (1999, 2000), Burgasser et al. (2000), Reid et al. (2001), and Cruz et al. (2003). These measurements are plotted as open circles in Fig. 7. Similarly to what is observed for lithium, the intensity of the cesium line rapidly increases towards later spectral type and reaches a maximum between T0 and T5, this is at temperatures cooler than the lithium case. The marked intensity decrease at ≥T5 is very likely due to the conversion of atomic Cs i into molecules as a natural result of the cool atmospheres’ chemistry. This property agrees well with the theory, which predicts that rubidium and cesium disappear in monatomic form at sufficiently low temperatures that are 200−300 K lower than the one for lithium (e.g. Burrows & Sharp 1999; Lodders & Fegley 2006).
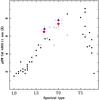 |
Fig. 7 Cs iλ852.115 nm pseudo-equivalent widths (pEWs) of L and T dwarfs. Our pEWs of Luhman 16A (L7.5) and Luhman 16B (T0) are indicated with red dots, and the measurements of Faherty et al. (2014) are plotted as blue solid triangles. Data taken from Kirkpatrick et al. (2000) and Burgasser et al. (2003) are depicted with black solid circles, and our measurements over optical spectra available in the literature are plotted as open circles. |
We detect Na i λ818.326 and λ819.482 nm subordinate lines in the spectra of Luhman 16A and Luhman 16B. The detection is highlighted in Fig. 5. We report their pEWs in Table 2. Both components have Na i pEWs greater than 0.5 Å, which contrasts with the claim by Faherty et al. (2014). These authors imposed an upper limit on the strength of Na i absorption of <0.5 Å. This discrepancy can be explained by the different spectral resolution of the data and the fact that the spectra used by Faherty et al. (2014) were not corrected for fringing and telluric contribution (important at these wavelengths), as acknowledged by the authors. Additionally, the optical spectra of Kniazev et al. (2013) are not free of telluric absorption; therefore, these authors were unable to detect this feature despite the good quality of their data. The L component shows stronger Na i lines than the T member of the pair, probably because the pseudo-continuum of the latter object is more depressed because of the lower temperature and more vigorous red wing of the K i doublet centred on 768.2 nm. Interestingly, Na i at 1138.145 and 1140.378 nm in the near-infrared is not obvious in either pair member, in agreement with Faherty et al. (2014). Other early-T dwarfs, such as ϵ Indi Ba, do not show these lines in their high-quality spectra (King et al. 2010). Thus, we do not confirm the near-infrared detection of Na i reported by Burgasser et al. (2013). If any, only the reddest line of the two (1140.378 nm) might be said to display a marginally resolved signature with pEWs = 1.3 Å (L) and 1.5 Å (T), and no trace of the blue line. We note that this region is severely affected by H2O absorption.
Potassium is detected at optical and near-infrared wavelengths. The resonance doublet at 766.4911 and 769.8974 nm extends several 1000 Å (typical of late-L and T dwarfs) and imprints the overall shape of the visible spectra. We report the pEWs of the near-infrared K i lines in Table 2. The strength of the optical and near-infrared K i lines (766.4911 and 769.8974 nm, 1.169, 1.173, 1.243, and 1252 μm) is systematically greater in Luhman 16B than in the L dwarf, which may suggest a higher potassium abundance, a lower temperature, depletion of potassium in condensates, and/or a pseudo-continuum affected by less opacity at near-infrared wavelengths. The properties of the near-infrared K i lines are widely discussed in comparison with the spectra of other field L and T dwarfs by Faherty et al. (2014).
It is known that the alkali lines have a profound correlation with gravity (atmospheric pressure) and metallicity at the low temperatures of the binary: the higher the gravity and the atomic abundance, the stronger the spectral features. With the only exception of lithium, the similarity of the strength of the alkali lines between Luhman 16A and B and field ultra-cool dwarfs of related spectral types indicates that the components do not deviate significantly in age and metallicity with respect to the field, in agreement with the age derivations by Burgasser et al. (2013) and Faherty et al. (2014).
Masses, radii, and effective temperatures (Teff) for each component of Luhman 16 for different ages along with the error bars from the interpolation of the models.
4. Effective temperatures and luminosities
We determined the luminosity of the L and T components using J-, H-, and K-band bolometric corrections (Golimowski et al. 2004b; Nakajima et al. 2004; Vrba et al. 2004) valid for field dwarfs and the spectral intervals L6–L8 (Luhman 16A) and L9–T1 (Luhman 16B), which accounts for the spectral types of the pair members and their associated uncertainties. Note that the H-band bolometric correction (BC) shows the smallest dispersion among the three bands. We also used a solar bolometric luminosity of 4.73 mag and the trigonometric distance of 2.02 ± 0.02 pc determined for the system by Boffin et al. (2014). The near-infrared magnitudes of each pair member provided by Burgasser et al. (2013) and Kniazev et al. (2013) were averaged. We derived the following values: log L/L⊙ = −4.68 ± 0.08 (L component) and −4.66 ± 0.08 dex (T component). The luminosity error bars consider the uncertainties in the photometry (typically ±0.03 mag), the distance modulus (±0.02 mag), and the corresponding BCs (typically ±0.15 mag for J and K, and ±0.08 for H). Our determination for the L component broadly agrees with Faherty et al. (2014), who found log L/L⊙ = −4.67 ± 0.04 dex after the integration over their optical (0.6−0.9 μm) and near-infrared (0.8−2.5 μm) spectra supplemented with synthetic spectra for wavelengths longer than 2.5 μm. This supports the reliability of the BCs for these spectral types. Our luminosity determination for the T component is consistent with that of Faherty et al. (2014, −4.71 ± 0.10 at the 1σ level, although our measurement suggests a slightly brighter luminosity. In a similar manner as described in Faherty et al. (2014), we also integrated our X-Shooter spectra and found that the L and T dwarfs have nearly identical luminosity, with the T object being 0.01 dex more luminous than the L dwarf, in agreement with the luminosities inferred from the BCs. The T component has been reported to show stronger variability than the L source at optical and near-infrared wavelengths with peak-to-peak amplitudes of 11−13.5% in continuous observations and strong night-to-night evolution according to Gillon et al. (2013), Biller et al. (2013), and Burgasser et al. (2014). This might affect the luminosity determination for this particular dwarf. To account for the observed variability amplitude, an uncertainty of ±0.05 dex should be added to the error bar in the luminosity derivation of the T pair member, thus yielding log L/L⊙ = −4.66 ± 0.13 dex. One striking result is that, despite the differing spectral classifications, both objects, Luhman 16A and B, have consistent L/L⊙ values at the 1σ level.
There are several methods for determining the effective temperatures (Teff) of Luhman 16A and B. One is fitting observed spectra using theoretical model atmospheres, as was done by Faherty et al. (2014).
These authors found a wide range of possible temperatures (900−1800 K) for the two components and reported that diverse models yield temperatures that can differ by 500 K for the same source and observed data. Another way is to use Teff calibrations as a function of spectral type or colour available in the literature (e.g. Vrba et al. 2004; Stephens et al. 2009). Using these two calibrations valid for field dwarfs, we inferred Teff = 1460 ± 100 K for the L component, and 1335 ± 100 K for the T component. The uncertainties stand for the dispersion of the calibrations as indicated by the authors. A third method consists of applying the astrophysical equation  (1)where Teff, ⊙ = 5777 K and R/R⊙ indicates the object’s radius in solar units. This way has the advantage that substellar objects of ages greater than ~0.5 Gyr change little in size according to the theory of substellar evolution (see review by Chabrier & Baraffe 2000). Particularly, for ages ≥1 Gyr and brown dwarfs with masses ≥0.02 M⊙, models predict R/R⊙ to be in the range 0.076−0.102. Considering a mean size of 0.09 R⊙ and the bolometric luminosities given above, we determined
  K for the L component and
  K for the T component. The generous error bars include the uncertainty in luminosity and all possible radii between 0.076 and 0.102 R⊙. These error bars would decrease by about 100 K if we were to only consider the uncertainties in size. The determination of the relative luminosity from the integration of the spectra has a relative error estimated at +/−0.04 dex, which translates into a relative error on the Teff of ±2.3% or ±30 K at 1300 K. Hence, both objects have similar luminosity within +/−0.04 dex and similar Teff within 30 K (1σ). We do not expect different masses or sizes from the theory if the two objects are coeval, which we assumed here. We list in Table 3 the masses, radii, and Teff for each component of the Luhman 16 system, assuming four different ages (0.5,1,2, and 5 Gyr) along with the error bars from the interpolations of models for each age. We note that the oldest age yields a mass that is incompatible with lithium preservation as already discussed by Burgasser et al. (2014). Equation (1)and the literature Teff-spectral type calibrations provide similar temperatures for Luhman 16B, while Eq. (1)yields a cooler temperature for Luhman 16A, which may imply a later spectral classification (e.g. L8) than the one quoted in Luhman (2013) and Kniazev et al. (2013). Independently of the method used, we found that the two pair members have consistent temperatures and luminosities, which indicates similar masses and radii.
We show the diagram of bolometric luminosity versus Teff for the two components in Fig. 8. The temperatures derived using Eq. (1)are employed. We overplot several isochrones (lines in colours) from the COND models of Baraffe et al. (2003), ranging from 10 Myr up to 10 Gyr. We also plot isomasses for 0.020 and 0.060 M⊙. As seen from the figure, the binary appears to be older than 120 Myr with a likely age close to 1 Gyr and a mass of ~0.040 M⊙ for each pair member. These determinations fully agree with the presence of lithium in the objects’ atmospheres (see Sect. 3.3), and with the age and mass ranges determined by Burgasser et al. (2013) and Faherty et al. (2014).
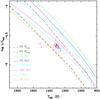 |
Fig. 8 Diagram of the luminosity versus effective temperature for the two components of the Luhman 16AB pair (red open circles). Isochrones are plotted as solid lines, and the tracks of 0.020 and 0.060 M⊙ are displayed with dot-dashed and dashed lines. The models by Baraffe et al. (2003) are used. Blue triangles stand for the determinations of Faherty et al. (2014). |
5. System velocities and relative radial velocity
We measured the central wavelengths of the various atomic lines indicated in Table 2 to estimate the radial velocity of each component. The values of the observed central wavelengths of Rb i, Na i, Cs i, and near-infrared K i lines were compared to their nominal air wavelengths4. The average wavelength shift lies in the 0.10−0.15 nm range, implying a mean observed velocity of about 46 km s-1 with a most probable range of 36−56 km s-1. The measurements for the two components agree within 10%. We also cross-correlated the X-Shooter spectra of the L and T members against the 1400-K BT-Settl model spectrum computed for solar metallicity and surface gravity of log g = 4.5 (cm s-2) by Allard et al. (2012). We used the wavelength interval 775–1350 nm, which excludes regions of strong telluric absorption and poor signal-to-noise ratio and includes atomic and molecular absorption features due to Rb i, Na i, Cs i, K i, H2O, CrH, and FeH. The resulting observed velocities are 40.9 ± 7.6 and 35.1 ± 7.2 km s-1 for the L and T components, respectively. We applied a correction of −15.8 km s-1 corresponding to the diurnal, lunar, and annual velocities during the observations on 11 June 2013 at UT = 00h38m to obtain the following heliocentric radial velocities: vh = 25.1 ± 7.6 and 19.3 ± 7.2 km s-1 for Luhman 16A and Luhman16B. Our measurements and the heliocentric velocities (23.1 and 19.5 km s-1) reported by Kniazev et al. (2013) agree within 1σ the uncertainty.
Using our heliocentric radial velocities (mean value of 22.2 ± 7.5 km s-1 for the system), the recent determinations of parallax and proper motion by Boffin et al. (2014), and the equations of Johnson & Soderblom (1987), we derive the following Galactic space velocities: U = −18.3 ± 2.0, V = −28.7 ± 7.2, and W = −6.8 ± 0.7 km s-1. The uncertainties associated with all three Galactic velocities come from the proper motion, parallax, and radial velocity errors. The space velocities of Luhman 16AB are statistically consistent with the Galaxy young disk kinematics according to the classification made by Eggen (1990) and Leggett (1992); this agrees with the age estimate made by Burgasser et al. (2013) and Faherty et al. (2014) and the value reported in the previous section. The UVW velocities do not overlap with any close (≤100 pc), young (≤600 Myr) stellar moving group listed in the catalogues of Zuckerman & Song (2004) and Torres et al. (2008), which supports the conclusions made by Kniazev et al. (2013).
We also measured the relative velocity of the T component versus the L component by means of the cross-correlation technique. We cross-correlated the spectra with and without the telluric contribution. The regions dominated by telluric absorption were used to establish the velocity shift corrections to be applied for bringing the data of the two components to the same system of reference and obtaining an accurate relative radial velocity. We derived relative velocities of −1.06 ± 0.50 and −1.42 ± 0.70 km s-1 from the optical and near-infrared parts of the X-Shooter spectra, respectively. The associated error bars are smaller than those of the heliocentric radial velocities as expected for relative velocities. The measured mean relative velocity is consistent with the difference between the heliocentric velocities given above at the 1σ level. Our value is also compatible with that (−2.5 ± 1.9 km s-1) of Kniazev et al. (2013) obtained from data that were acquired 90 days before the X-Shooter spectra. The non-zero relative velocity on two different occasions indicates that the binary orbit is very likely tilted with respect to the line of sight. Precise radial velocity monitoring of the system is required to search for unresolved companions (including planets) around any component (Boffin et al. 2014), to characterize the binary orbit (with an estimated orbital period greater than 15 years), and to determine dynamical masses of the components, which in turn will become useful for comparison with substellar models.
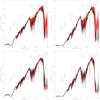 |
Fig. 9 Top: comparison of the X-Shooter optical and near-infrared spectra (black line) of the L (left) and T (right) components of Luhman 16AB and the BT-Settl model atmosphere with 1400/5.0 (red line) and normalised around 800 nm to match the potassium wings. Bottom: same X-Shooter spectra (black line) compared to synthetic spectra generated combining the WITA chemical code with the BT-Settl model atmosphere for a temperature of 1400 K, a gravity of log (g) of 5.0−5.5, and different relative abundances of Na, K, and other refractory elements (smoothed for visualisation purposes). |
6. Comparison with theoretical models
We compared the observed spectrum of each component of the Luhman 16AB system with the BT-Settl synthetic models (Allard et al. 2012). We were unable to simultaneously reproduce the X-Shooter data of the two objects with the same temperature, gravity and metallicity (see also Faherty et al. 2014). In Fig. 9, the BT-Settl spectrum computed for solar abundance, log g = 5.0 and Teff = 1400 K (close to the values derived/discussed in previous sections) is shown in comparison with the X-Shooter of Luhman 16A and B. However, according to Faherty et al. (2014), the BT-Settl models can reproduce each component of Luhman 16 using different temperatures and surface gravities (i.e. ages), which is an unlikely hypothesis for a nearby co-moving, lithium-bearing, low-mass binary system. According to the results obtained with our code (see next), the fitting of the X-Shooter spectra yields Teff = 1500 K and log g = 5.0 dex for the L component and 1200−1300 K and 4.0 dex for the T component. These are differing temperatures and gravities, which agrees with the results of Faherty et al. (2014). As previously discussed, given the similar luminosities of the two pair members and assuming coevality, the Teff of the two objects cannot differ by more than ~60 K (at the 2σ level). In the following, we intend to investigate whether one single temperature and gravity can provide reasonable fits to the observed data.
The observed differences between the X-Shooter and computed BT-Settl spectra show our general lack of understanding of the physics of L and T dwarf atmospheres. To improve the fits with special attention to the simultaneous fit of the sodium and potassium subordinate and resonance lines, we computed synthetic spectra of L and T dwarfs following the procedure by Pavlenko et al. (2007a), as summarised below. We took advantage of the versatility of the WITA code to modify the relative abundances and number densities of species shaping the spectral energy distributions of L and T dwarfs. We computed the chemical equilibrium for a mix of approximately 100 molecular species and adopted the conventional approach of Pavlenko (2013) to treat the depletion of atomic alkalis into molecular species. Then, we computed partial pressures of some molecules and atoms that exceeded the pressures of the gas-dust phase transitions and decreased their gas phase abundances to the corresponding equilibrium values (see Pavlenko 1998). We computed the profiles of the NaI and KI resonance doublets in the framework of a quasi-static approach described in Pavlenko et al. (2007b) with an upgraded approach from Burrows et al. (2003). We computed the CrH and FeH line lists from the work of Burrows et al. (2002b) and Dulick et al. (2003), respectively, while the water vapour line list was taken from Tennyson et al. (2007). We considered the spectroscopic data for atomic absorption of the Vienna Atomic Line Database (VALD; Kupka et al. 1999)5. We plot the overall spectral energy distribution produced by WITA after modifying the number densities of NaI, KI, CrH, FeH, and water vapour for the L and T component in the bottom plots in Fig. 9, assuming an effective temperature of 1400 K and a gravity of log (g) of 5.0−5.5. In that way we used rather phenomenological approach to fit our theoretical spectra to the observed spectral energy distributions. The detailed analysis of these abundances deserves a more dedicated study which is beyond the scope of this paper. Nonetheless, it is clear that the spectral properties of L/T transition objects are not only determined by effective temperature and gravity but also depend on the depletion of potassium and sodium atoms into condensates and dust species, as previously suggested by Marley et al. (2010).
7. Summary
We presented high-quality optical and near-infrared of the Luhman 16AB obtained with VLT/X-Shooter. We classified each component of this nearby brown dwarf binary as L6–L7.5 and T0±1, respectively. We focussed our analysis primarily on the strength of alkali lines, which can be summarised as follows:
-
We measured similar pEWs for the lithium absorption line in eachcomponent, placing both objects in the substellar regime. ThepEW measurement of the L component is consistent with thevalues of other late-L field dwarfs. Lithium is detected for the firsttime in a T dwarf (see also Fahertyet al. 2014) with a pEW of 8.4 ± 1.5 Å.
-
We set an upper limit of 30 mÅ on the lithium subordinate line at 812.64 nm.
-
The pEWs of the rubidium lines are similar for the L and T components of the binary, while the cesium lines appear stronger in the T dwarf.
-
We detected the sodium subordinate lines in the red optical spectra of the L and T components. The L-type member exhibits stronger sodium lines than the T component.
-
The pEWs of lithium and cesium decrease for spectral types later than ~L6 and T0–T5, respectively, which probably corresponds to the condensation of these species into molecules in the atmospheres of cool brown dwarfs. Our comparison with other L and T dwarfs shows that the condensation of cesium occurs at temperatures about 300 K cooler than the one of lithium, as predicted by models.
We derived effective temperatures of  K and K and luminosities of −4.68 ± 0.08 dex and −4.66 ± 0.13 dex for the L and T component of the binary, respectively, which agrees with the literature. Moreover, we measured heliocentric radial velocities of 25.1 and 19.3 km s-1 for each component, yielding Galactic space velocities that do not indicate membership to any of the known nearby young moving groups. Finally, we fit synthetic spectra to the observed spectra of each component of the binary by combining the BT-Settl models and the WITA chemical abundance code. We satisfactorily reproduced the spectral energy distributions of the L and T dwarfs with a single set of temperature and gravity, but different relative atmospheric abundances of some elements like K, Na, and Cr, which may be related to varying levels of dust condensation.
IRAF is distributed by National Optical Astronomy Observatories, which is operated by the Association of Universities for Research in Astronomy, Inc., under contract with the National Science Foundation.
Acknowledgments
N.L. was funded by the Ramón y Cajal fellowship number 08-303-01-02. This research has been supported by the Spanish Ministry of Economics and Competitiveness under the projects AYA2010-19136, AYA2010-21308-C3-02, AYA2010-21308-C03-03, AYA2010-20535, and AYA2011-30147-C03-03.. This work is based on observations collected with X-Shooter on the VLT at the European Southern Observatory, Chile, under DDT programme 290.C-5200(B) whose PI was Lodieu. We thank Jackie Faherty for sending us the optical and near-infrared spectra of Luhman 16AB published in her paper (Faherty et al. 2014). This research has made use of the Simbad and Vizier databases, operated at the Centre de Données Astronomiques de Strasbourg (CDS), and of NASA’s Astrophysics Data System Bibliographic Services (ADS). This research has benefitted from the M, L, T, and Y dwarf compendium housed at DwarfArchives.org and the SpeX Prism Spectral Libraries, maintained by Adam Burgasser at http://pono.ucsd.edu/~adam/browndwarfs/spexprism
References
- Allard, F., Hauschildt, P. H., Alexander, D. R., Tamanai, A., & Schweitzer, A. 2001, ApJ, 556, 357 [NASA ADS] [CrossRef] [Google Scholar]
- Allard, F., Homeier, D., & Freytag, B. 2012, Roy. Soc. London Phil. Trans. Ser. A, 370, 2765 [Google Scholar]
- Baraffe, I., Chabrier, G., Barman, T. S., Allard, F., & Hauschildt, P. H. 2003, A&A, 402, 701 [NASA ADS] [CrossRef] [EDP Sciences] [Google Scholar]
- Basri, G., Mohanty, S., Allard, F., et al. 2000, ApJ, 538, 363 [NASA ADS] [CrossRef] [Google Scholar]
- Biller, B. A., Crossfield, I. J. M., Mancini, L., et al. 2013, ApJ, 778, L10 [NASA ADS] [CrossRef] [Google Scholar]
- Boffin, H. M. J., Pourbaix, D., Mužić, K., et al. 2014, A&A, 561, L4 [NASA ADS] [CrossRef] [EDP Sciences] [Google Scholar]
- Burgasser, A. J., Wilson, J. C., Kirkpatrick, J. D., et al. 2000, AJ, 120, 1100 [NASA ADS] [CrossRef] [Google Scholar]
- Burgasser, A. J., Kirkpatrick, J. D., Liebert, J., & Burrows, A. 2003, ApJ, 594, 510 [NASA ADS] [CrossRef] [Google Scholar]
- Burgasser, A. J., McElwain, M. W., Kirkpatrick, J. D., et al. 2004, AJ, 127, 2856 [NASA ADS] [CrossRef] [Google Scholar]
- Burgasser, A. J., Geballe, T. R., Leggett, S. K., Kirkpatrick, J. D., & Golimowski, D. A. 2006, ApJ, 637, 1067 [NASA ADS] [CrossRef] [Google Scholar]
- Burgasser, A. J., Sheppard, S. S., & Luhman, K. L. 2013, ApJ, 772, 129 [NASA ADS] [CrossRef] [Google Scholar]
- Burgasser, A. J., Gillon, M., Faherty, J. K., et al. 2014, ApJ, 785, 48 [NASA ADS] [CrossRef] [Google Scholar]
- Burrows, A., & Sharp, C. M. 1999, ApJ, 512, 843 [NASA ADS] [CrossRef] [Google Scholar]
- Burrows, A., Burgasser, A. J., Kirkpatrick, J. D., et al. 2002a, ApJ, 573, 394 [NASA ADS] [CrossRef] [Google Scholar]
- Burrows, A., Ram, R. S., Bernath, P., Sharp, C. M., & Milsom, J. A. 2002b, ApJ, 577, 986 [NASA ADS] [CrossRef] [Google Scholar]
- Burrows, A., Sudarsky, D., & Lunine, J. I. 2003, ApJ, 596, 587 [NASA ADS] [CrossRef] [Google Scholar]
- Chabrier, G., & Baraffe, I. 2000, ARA&A, 38, 337 [NASA ADS] [CrossRef] [Google Scholar]
- Chiu, K., Fan, X., Leggett, S. K., et al. 2006, AJ, 131, 2722 [NASA ADS] [CrossRef] [Google Scholar]
- Crossfield, I. J. M., Biller, B., Schlieder, J. E., et al. 2014, Nature, 505, 654 [NASA ADS] [CrossRef] [Google Scholar]
- Cruz, K. L., Reid, I. N., Liebert, J., Kirkpatrick, J. D., & Lowrance, P. J. 2003, AJ, 126, 2421 [NASA ADS] [CrossRef] [Google Scholar]
- Cruz, K. L., Kirkpatrick, J. D., & Burgasser, A. J. 2009, AJ, 137, 3345 [NASA ADS] [CrossRef] [Google Scholar]
- Cushing, M. C., Kirkpatrick, J. D., Gelino, C. R., et al. 2011, ApJ, 743, 50 [NASA ADS] [CrossRef] [Google Scholar]
- Dahn, C. C., Harris, H. C., Vrba, F. J., et al. 2002, AJ, 124, 1170 [NASA ADS] [CrossRef] [Google Scholar]
- D’Odorico, S., Dekker, H., Mazzoleni, R., et al. 2006, in SPIE Conf. Ser., 6269, 626933 [Google Scholar]
- Dulick, M., Bauschlicher, Jr., C. W., Burrows, A., et al. 2003, ApJ, 594, 651 [NASA ADS] [CrossRef] [Google Scholar]
- Eggen, O. J. 1990, AJ, 100, 1159 [NASA ADS] [CrossRef] [Google Scholar]
- Faherty, J. K., Beletsky, Y., Burgasser, A. J., et al. 2014, ApJ, 790, 90 [NASA ADS] [CrossRef] [Google Scholar]
- Geballe, T. R., Knapp, G. R., Leggett, S. K., et al. 2002, ApJ, 564, 466 [NASA ADS] [CrossRef] [Google Scholar]
- Gillon, M., Triaud, A. H. M. J., Jehin, E., et al. 2013, A&A, 555, L5 [NASA ADS] [CrossRef] [EDP Sciences] [Google Scholar]
- Golimowski, D. A., Henry, T. J., Krist, J. E., et al. 2004a, AJ, 128, 1733 [NASA ADS] [CrossRef] [Google Scholar]
- Golimowski, D. A., Leggett, S. K., Marley, M. S., et al. 2004b, AJ, 127, 3516 [NASA ADS] [CrossRef] [Google Scholar]
- Johnson, D. R. H., & Soderblom, D. R. 1987, AJ, 93, 864 [NASA ADS] [CrossRef] [Google Scholar]
- King, R. R., McCaughrean, M. J., Homeier, D., et al. 2010, A&A, 510, A99 [NASA ADS] [CrossRef] [EDP Sciences] [Google Scholar]
- Kirkpatrick, J. D., Reid, I. N., Liebert, J., et al. 1999, ApJ, 519, 802 [NASA ADS] [CrossRef] [Google Scholar]
- Kirkpatrick, J. D., Reid, I. N., Liebert, J., et al. 2000, AJ, 120, 447 [NASA ADS] [CrossRef] [Google Scholar]
- Kirkpatrick, J. D., Cruz, K. L., Barman, T. S., et al. 2008, ApJ, 689, 1295 [NASA ADS] [CrossRef] [Google Scholar]
- Kirkpatrick, J. D., Gelino, C. R., Cushing, M. C., et al. 2012, ApJ, 753, 156 [NASA ADS] [CrossRef] [Google Scholar]
- Knapp, G. R., Leggett, S. K., Fan, X., et al. 2004, AJ, 127, 3553 [NASA ADS] [CrossRef] [Google Scholar]
- Kniazev, A. Y., Vaisanen, P., Mužić, K., et al. 2013, ApJ, 770, 124 [NASA ADS] [CrossRef] [Google Scholar]
- Kupka, F., Piskunov, N., Ryabchikova, T. A., Stempels, H. C., & Weiss, W. W. 1999, A&AS, 138, 119 [NASA ADS] [CrossRef] [EDP Sciences] [MathSciNet] [PubMed] [Google Scholar]
- Leggett, S. K. 1992, ApJS, 82, 351 [NASA ADS] [CrossRef] [Google Scholar]
- Leggett, S. K., Geballe, T. R., Fan, X., et al. 2000, ApJ, 536, L35 [NASA ADS] [CrossRef] [PubMed] [Google Scholar]
- Leggett, S. K., Golimowski, D. A., Fan, X., et al. 2002, ApJ, 564, 452 [NASA ADS] [CrossRef] [Google Scholar]
- Lemoine, M., Ferlet, R., Vidal-Madjar, A., Emerich, C., & Bertin, P. 1993, A&A, 269, 469 [NASA ADS] [Google Scholar]
- Lodders, K., & Fegley, Jr., B. 2006, in Astrophysics Update 2, Springer Praxis Books, ed. J. W. Mason, 1 [Google Scholar]
- Looper, D. L., Kirkpatrick, J. D., & Burgasser, A. J. 2007, AJ, 134, 1162 [NASA ADS] [CrossRef] [Google Scholar]
- Luhman, K. L. 2013, ApJ, 767, L1 [NASA ADS] [CrossRef] [Google Scholar]
- Mamajek, E. E. 2013, ArXiv e-prints [arXiv:1303.5345] [Google Scholar]
- Marley, M. S., Saumon, D., & Goldblatt, C. 2010, ApJ, 723, L117 [NASA ADS] [CrossRef] [Google Scholar]
- Martín, E. L., Delfosse, X., Basri, G., et al. 1999, AJ, 118, 2466 [NASA ADS] [CrossRef] [Google Scholar]
- McCaughrean, M. J., Close, L. M., Scholz, R.-D., et al. 2004, A&A, 413, 1029 [NASA ADS] [CrossRef] [EDP Sciences] [Google Scholar]
- Nakajima, T., Oppenheimer, B. R., Kulkarni, S. R., et al. 1995, Nature, 378, 463 [NASA ADS] [CrossRef] [Google Scholar]
- Nakajima, T., Tsuji, T., & Yanagisawa, K. 2004, ApJ, 607, 499 [NASA ADS] [CrossRef] [Google Scholar]
- Nelson, L. A., Rappaport, S., & Chiang, E. 1993, ApJ, 413, 364 [NASA ADS] [CrossRef] [Google Scholar]
- Pavlenko, Y., Zapatero Osorio, M. R., & Rebolo, R. 2000, A&A, 355, 245 [NASA ADS] [Google Scholar]
- Pavlenko, Y. V. 1998, Astron. Rep., 42, 787 [NASA ADS] [Google Scholar]
- Pavlenko, Y. V. 2013, 84, 1062 [Google Scholar]
- Pavlenko, Y. V., Jones, H. R. A., Martín, E. L., et al. 2007a, MNRAS, 380, 1285 [NASA ADS] [CrossRef] [Google Scholar]
- Pavlenko, Y. V., Zhukovska, S. V., & Volobuev, M. 2007b, Astron. Rep., 51, 282 [NASA ADS] [CrossRef] [Google Scholar]
- Rebolo, R., Martín, E. L., & Magazzù, A. 1992, ApJ, 389, L83 [NASA ADS] [CrossRef] [Google Scholar]
- Rebolo, R., Zapatero-Osorio, M. R., & Martín, E. L. 1995, Nature, 377, 129 [NASA ADS] [CrossRef] [Google Scholar]
- Reid, I. N., Kirkpatrick, J. D., Gizis, J. E., et al. 2000, AJ, 119, 369 [NASA ADS] [CrossRef] [Google Scholar]
- Reid, I. N., Burgasser, A. J., Cruz, K. L., Kirkpatrick, J. D., & Gizis, J. E. 2001, AJ, 121, 1710 [NASA ADS] [CrossRef] [Google Scholar]
- Scholz, R.-D., McCaughrean, M. J., Lodieu, N., & Kuhlbrodt, B. 2003, A&A, 398, L29 [NASA ADS] [CrossRef] [EDP Sciences] [Google Scholar]
- Stephens, D. C., Leggett, S. K., Cushing, M. C., et al. 2009, ApJ, 702, 154 [NASA ADS] [CrossRef] [Google Scholar]
- Tennyson, J., Harris, G. J., Barber, R. J., et al. 2007, Mol. Phys., 105, 701 [NASA ADS] [CrossRef] [Google Scholar]
- Tinney, C. G. 1998, MNRAS, 296, L42 [NASA ADS] [CrossRef] [Google Scholar]
- Tinney, C. G., Faherty, J. K., Kirkpatrick, J. D., et al. 2012, ApJ, 759, 60 [NASA ADS] [CrossRef] [Google Scholar]
- Tody, D. 1986, in SPIE Conf. Ser., 627, ed. D. L. Crawford, 733 [Google Scholar]
- Tody, D. 1993, in Astronomical Data Analysis Software and Systems II, eds. R. J. Hanisch, R. J. V. Brissenden, & J. Barnes, ASP Conf. Ser., 52, 173 [Google Scholar]
- Torres, C. A. O., Quast, G. R., da Silva, L., et al. 2006, A&A, 460, 695 [NASA ADS] [CrossRef] [EDP Sciences] [Google Scholar]
- Torres, C. A. O., Quast, G. R., Melo, C. H. F., & Sterzik, M. F. 2008, in Handbook of Star Forming Regions II: The Southern Sky, ASP Monograph Publ. 5, ed. B. Reipurth, 757 [Google Scholar]
- van Leeuwen, F. 2007, A&A, 474, 653 [NASA ADS] [CrossRef] [EDP Sciences] [Google Scholar]
- Vernet, J., Dekker, H., D’Odorico, S., et al. 2011, A&A, 536, A105 [NASA ADS] [CrossRef] [EDP Sciences] [Google Scholar]
- Vrba, F. J., Henden, A. A., Luginbuhl, C. B., et al. 2004, AJ, 127, 2948 [NASA ADS] [CrossRef] [Google Scholar]
- Wright, E. L., Eisenhardt, P. R. M., Mainzer, A. K., et al. 2010, AJ, 140, 1868 [NASA ADS] [CrossRef] [Google Scholar]
- Zapatero Osorio, M. R., Béjar, V. J. S., Miles-Páez, P. A., et al. 2014, A&A, 568, A6 [NASA ADS] [CrossRef] [EDP Sciences] [Google Scholar]
- Zuckerman, B., & Song, I. 2004, ARA&A, 42, 685 [NASA ADS] [CrossRef] [MathSciNet] [Google Scholar]
All Tables
Observing logs of the VLT X-Shooter observations and information on the wavelength range, resolution, and properties of the three arms of the X-Shooter spectrograph.
Masses, radii, and effective temperatures (Teff) for each component of Luhman 16 for different ages along with the error bars from the interpolation of the models.
All Figures
|
Fig. 1 Comparison of the X-Shooter optical and near-infrared spectra of the L (black line) and T (red line) components of the Luhman 16AB brown dwarf binary. Both spectra are normalised to unity at 1300 nm to highlight the differences in spectroscopic features of the two components. Both spectra are also corrected for telluric contribution. The main spectral features present in L and T dwarfs are highlighted. |
| In the text | |
|
Fig. 2 Top panels: VLT X-Shooter optical (left) and near-infrared (right) spectra corrected for telluric lines for the L dwarf component of Luhman 16AB. Bottom panels: same but for the T component of Luhman 16AB. Overplotted as red lines are spectral standards downloaded from the SpeX archive and Sandy Leggett’s webpage: 2MASS J15074769−162738.6 (L5–L5.5; Reid et al. 2000; Dahn et al. 2002; Kirkpatrick et al. 2000; Knapp et al. 2004), 2MASSs J0850359+105716 (L6; Kirkpatrick et al. 1999), 2MASSI J0103320+193536 (L7; Kirkpatrick et al. 2000), 2MASS J16322911+1904407 (L7.5; Leggett et al. 2002; Geballe et al. 2002), 2MASS J03105986+1648155 (L9; Kirkpatrick et al. 2000; Burgasser et al. 2006; Reid et al. 2001; Leggett et al. 2002; Geballe et al. 2002), SDSS J04234857−0414035 (T0; Leggett et al. 2000; Geballe et al. 2002; Cruz et al. 2003; Burgasser et al. 2006), SDSS J08371721−0000180 (T1; Leggett et al. 2000, 2002; Burgasser et al. 2006; Kirkpatrick et al. 2008), and SDSSp J125453.90-012247.4 (T2; Leggett et al. 2000; Burgasser et al. 2004). All optical and near-infrared spectra are normalised at ~840−860 nm and 1300 nm to ease the comparison. |
| In the text | |
|
Fig. 3 Spectral profiles of the Li i resonance doublet at 670.782 nm seen in absorption. The lines of the two objects are similar in strength. The relative fluxes of both pair members are normalised to the mean pseudo-continuum around the Li i signature for a proper comparison. The data are free of telluric contribution. No smoothing has been applied. |
| In the text | |
|
Fig. 4 Li i pseudo-equivalent widths (pEWs) of late-M, L, and T dwarfs. Data taken from Tinney (1998), Kirkpatrick et al. (1999, 2000, 2008), Pavlenko et al. (2007a), Cruz et al. (2009), and Zapatero Osorio et al. (2014) are shown with black dots (detections) and arrows (upper limits). Our pEWs of Luhman 16A (L6.75) and Luhman 16B (T0) are indicated with red dots, and the measurements of Faherty et al. (2014) are plotted as blue solid triangles. Values from Faherty et al. (2014) for Luhman 16A are slightly shifted in spectral type and pEW by +0.1 subtype and +0.1 Å, respectively, for clarity. |
| In the text | |
|
Fig. 5 Spectral profiles of Na i λ818.326 and λ819.482 nm subordinate lines. The relative fluxes of the two objects have been normalised to the mean pseudo-continuum redwards of λ819.482 nm. Spectra are telluric corrected and no smoothing is applied. |
| In the text | |
|
Fig. 6 Spectral profiles of Rb i (top) and Cs i (bottom) atomic lines of Luhman 16AB. The relative fluxes of the two objects have been normalised to the mean pseudo-continuum around Rb i and the Cs iλ852.11 nm lines for a proper comparison. These data are corrected for telluric contribution. The effect of the different Teff between the components becomes apparent in the slope of the pseudo-continua in the bottom panel. The Cs i λ894.35 nm line is blended with the absorption due to CrH and FeH. |
| In the text | |
|
Fig. 7 Cs iλ852.115 nm pseudo-equivalent widths (pEWs) of L and T dwarfs. Our pEWs of Luhman 16A (L7.5) and Luhman 16B (T0) are indicated with red dots, and the measurements of Faherty et al. (2014) are plotted as blue solid triangles. Data taken from Kirkpatrick et al. (2000) and Burgasser et al. (2003) are depicted with black solid circles, and our measurements over optical spectra available in the literature are plotted as open circles. |
| In the text | |
|
Fig. 8 Diagram of the luminosity versus effective temperature for the two components of the Luhman 16AB pair (red open circles). Isochrones are plotted as solid lines, and the tracks of 0.020 and 0.060 M⊙ are displayed with dot-dashed and dashed lines. The models by Baraffe et al. (2003) are used. Blue triangles stand for the determinations of Faherty et al. (2014). |
| In the text | |
|
Fig. 9 Top: comparison of the X-Shooter optical and near-infrared spectra (black line) of the L (left) and T (right) components of Luhman 16AB and the BT-Settl model atmosphere with 1400/5.0 (red line) and normalised around 800 nm to match the potassium wings. Bottom: same X-Shooter spectra (black line) compared to synthetic spectra generated combining the WITA chemical code with the BT-Settl model atmosphere for a temperature of 1400 K, a gravity of log (g) of 5.0−5.5, and different relative abundances of Na, K, and other refractory elements (smoothed for visualisation purposes). |
| In the text | |
Current usage metrics show cumulative count of Article Views (full-text article views including HTML views, PDF and ePub downloads, according to the available data) and Abstracts Views on Vision4Press platform.
Data correspond to usage on the plateform after 2015. The current usage metrics is available 48-96 hours after online publication and is updated daily on week days.
Initial download of the metrics may take a while.