Fig. 6
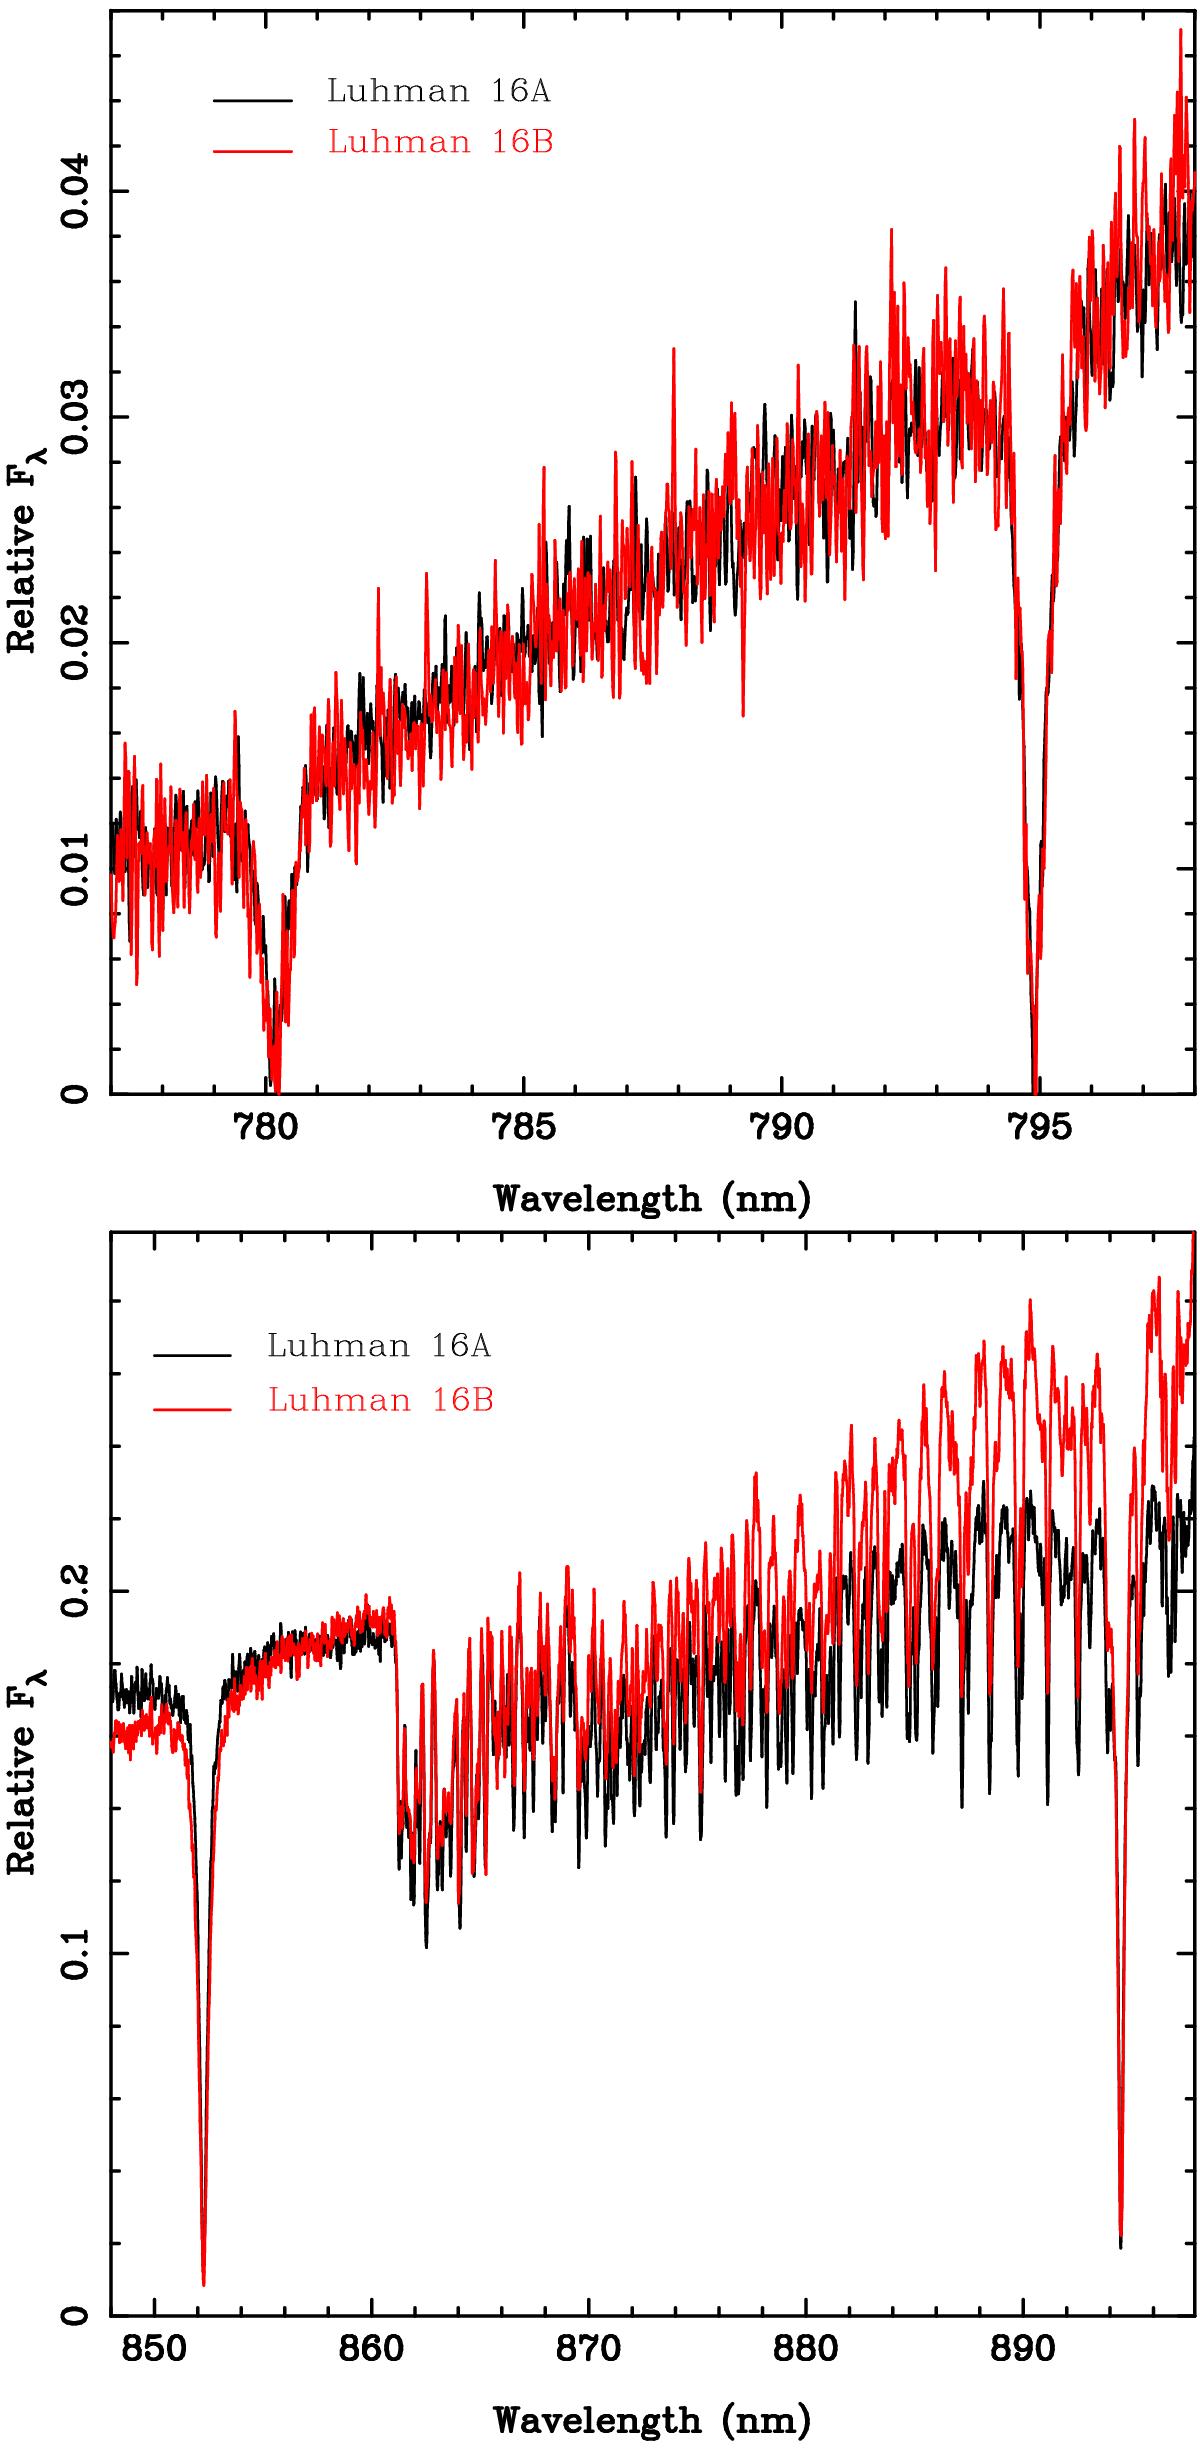
Spectral profiles of Rb i (top) and Cs i (bottom) atomic lines of Luhman 16AB. The relative fluxes of the two objects have been normalised to the mean pseudo-continuum around Rb i and the Cs iλ852.11 nm lines for a proper comparison. These data are corrected for telluric contribution. The effect of the different Teff between the components becomes apparent in the slope of the pseudo-continua in the bottom panel. The Cs i λ894.35 nm line is blended with the absorption due to CrH and FeH.
Current usage metrics show cumulative count of Article Views (full-text article views including HTML views, PDF and ePub downloads, according to the available data) and Abstracts Views on Vision4Press platform.
Data correspond to usage on the plateform after 2015. The current usage metrics is available 48-96 hours after online publication and is updated daily on week days.
Initial download of the metrics may take a while.