Fig. 8
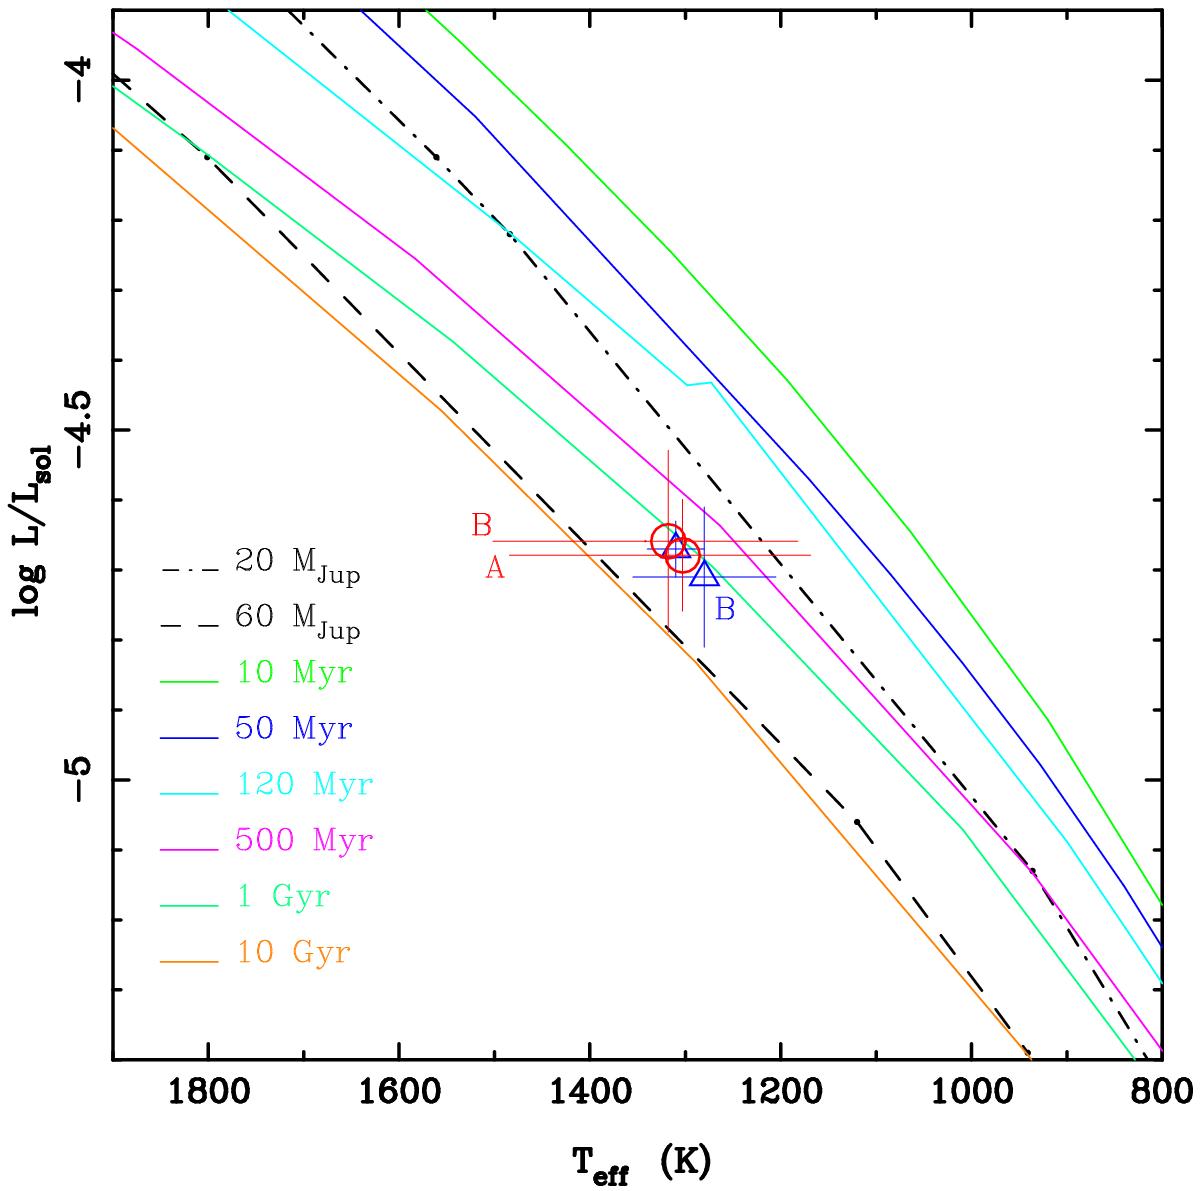
Diagram of the luminosity versus effective temperature for the two components of the Luhman 16AB pair (red open circles). Isochrones are plotted as solid lines, and the tracks of 0.020 and 0.060 M⊙ are displayed with dot-dashed and dashed lines. The models by Baraffe et al. (2003) are used. Blue triangles stand for the determinations of Faherty et al. (2014).
Current usage metrics show cumulative count of Article Views (full-text article views including HTML views, PDF and ePub downloads, according to the available data) and Abstracts Views on Vision4Press platform.
Data correspond to usage on the plateform after 2015. The current usage metrics is available 48-96 hours after online publication and is updated daily on week days.
Initial download of the metrics may take a while.