| Issue |
A&A
Volume 580, August 2015
|
|
|---|---|---|
| Article Number | A3 | |
| Number of page(s) | 5 | |
| Section | Planets and planetary systems | |
| DOI | https://doi.org/10.1051/0004-6361/201526173 | |
| Published online | 20 July 2015 | |
Research Note
High-resolution spectra of comet C/2013 R1 (Lovejoy) ⋆
1 University of Franche-Comté, Observatoire des Sciences de l’Univers THETA, Institut UTINAM – UMR CNRS 6213, BP 1615, 25010 Besançon Cedex, France
e-mail: This email address is being protected from spambots. You need JavaScript enabled to view it.
2 LESIA, Observatoire de Paris, CNRS, UPMC, Université Paris-Diderot, 5 place Jules Janssen, 92195 Meudon, France
3 Main Astronomical Observatory of NAS of Ukraine, 27 Akademika Zabolotnoho Street, 03680 Kyiv, Ukraine
4 Département d’Astrophysique, de Géophysique et d’Océanographie, Université de Liège, Allée du Six Août, 4000 Liège, Belgium
Received: 24 March 2015
Accepted: 29 May 2015
Abstract
Context. High-resolution spectra of comets permit deriving the physical properties of the coma. In the optical range, relative production rates can be computed, and information about isotopic ratios and the origin of oxygen atoms can be obtained.
Aims. The main objective of the work presented here was to obtain information about the chemical composition of comet C/2013 R1 (Lovejoy), a bright and long-period comet that passed perihelion (0.81 au) on 22 December 2013.
Methods. We used the HARPS-North echelle spectrograph at the 3.5 m telescope TNG to obtain high-resolution spectra of comet C/2013 R1 (Lovejoy) in the optical range immediately after its perihelion passage during four consecutive nights in the period December 23 to 26, 2013.
Results. Our results demonstrate the ability of HARPS-North to efficiently obtain cometary spectra. Very faint emission lines, such as those of 15NH2, have been detected, leading to a rough estimate of the 14N/15N ratio in NH2. The 12C/13C ratio was measured in the C2 lines and is equal to 80 ± 30. The oxygen lines were studied as well (green to red line intensity ratios and widths), confirming that H2O is the main parent molecule that photodissociates to produce oxygen atoms. This suggests that this comet has a high CO2 abundance. Relative production rates for C2 and NH2 were computed, but we found no significant deviation from a typical NH2/C2 ratio.
Key words: comets: general / comets: individual: C/2013 R1
Based on observations made with the Italian Telescopio Nazionale Galileo (TNG) operated on the island of La Palma by the Fundación Galileo Galilei of the INAF (Istituto Nazionale di Astrofisica) at the Spanish Observatorio del Roque de los Muchachos of the Instituto de Astrofisica de Canarias.
© ESO, 2015
1. Introduction
Comet C/2013 R1 (Lovejoy, hereafter R1 Lovejoy) is a long-period comet discovered on 7 September 2013 by Terry Lovejoy with a 0.2 m telescope (Guido et al. 2013). The comet passed perihelion on 22 December 2013 at 0.812 au from the Sun. It is a high-inclination (inclination = 64°) long-period comet originating from the Oort Cloud. It was a bright comet that was visible with the naked eye. This brightness offered the possibility to investigate its composition with a high-resolution spectrograph and a four-meter-class telescope.
These observations constituted both a study of the chemical composition of comet R1 Lovejoy and a test for this instrument because our observations were the first successful cometary observations performed with this spectrograph.
Observational data are presented in Sect. 2 below, the data analysis follows in the next sections. We have investigated the C2 and NH2 production rates, the oxygen emission lines, and the 12C/13C and 14N/15N isotopic ratios.
2. Observational data
The observations were performed with the 3.5 m telescope Telescopio Nazionale Galileo (TNG) located in the Roque de los Muchachos observatory (Canary islands, Spain) and the High Accuracy Radial velocity Planet Searcher in North hemisphere (HARPS-N), an echelle spectrograph similar to HARPS at the ESO 3.6 m telescope. It is designed to measure stellar radial velocities with the aim of detecting extrasolar planets. It covers a spectral range of 383 to 693 nm, with a spectral resolution R = λ/δ(λ) = 115 000, and uses the light provided by a circular aperture of 1.5 arcsec in diameter (Cosentino et al. 2012). The observational settings of this instrument cannot be changed to optimize its scientific output for the detection of extrasolar planets. The data are automatically preprocessed by a pipeline-reduction software located at Trieste (Italy), and they are available online for the observer a few hours after observations.
Table 1 provides the observing log. We observed R1 Lovejoy immediately after its perihelion during four successive nights, from 23 to 26 December. At that time, the comet was very low above the horizon and had to be observed in the morning astronomical twilight. During the observing run, the Doppler shift was high enough to allow studying the OI lines.
Observing circumstances.
From the preprocessed data provided by the reduction pipeline (1D spectra wavelength calibrated), we computed spectra calibrated in relative flux and removed the dust-scattered solar light. This processing was made by using spectrophotometric standard stellar spectra obtained at different airmasses during the observing run and a solar spectrum degraded to the same spectral resolution. The wavelengths were also corrected for heliocentric and topocentric velocities. Because of the low blue sensitivity and the high airmasses, the spectra were not scientifically useful below about 390 nm, which prevented us from using the CN(0, 0) band, which is located at 388 nm, to measure the 12C/13C isotopic ratio.
3. Relative production rates
In a first step, we estimated the relative flux for the main species appearing in our spectra. Uncertainty in the calibration curve prevented us from investigating all features appearing in the cometary spectrum, therefore we decided to focus on the radicals with emission lines redward of 4500 Å. Two main species can be studied in this range: C2 (sequence Δv = 0 in the range of 5100–5170 Å) and NH2 ((0, 10, 0)–(0, 0, 0) band in the range of 5675–5775 Å).
The relative emission fluxes were computed taking into account the solar dust continuum derived from the regions of the spectra that were free of molecular emission features. To calculate the relative production rates, we used an approach similar to that presented by Langland-Shula & Smith (2011). The gas production rates were derived using the Haser model (Haser 1957). Comparing the absolute values of the column densities calculated with the Haser model to those derived from the observed fluxes, we determined the gas production rates. The g-factors and scale lengths for parent and daughter molecules are listed in Table 2. We also adopted an outflow velocity relationship of 1.0r-0.5 km s-1, where r represents the heliocentric distance (au).
Parameters used to determine the gas production rates (for r = 1 au) and their dependence on the heliocentric distance r (Langland-Shula & Smith 2011).
Table 3 presents our results, computed for each observation night (by averaging the three different spectra obtained during each night). The average Q(NH2)/Q(C2) ratio for the four nights is 0.71. This ratio can be compared to similar measurements in comets. Fink (2009) computed an average value of 0.86 for a set of 35 comets typical in C2, CN, and NH2 composition (see data from their Table 4) or 0.90 for a set of 21 long-period comets (see data from their Table 5). According to our data, comet R1 Lovejoy appears to have a typical NH2 production rate relative to C2.
I(C2) and I(NH2): relative intensities (ADUs) for C2 and NH2 emission lines.
This relative production is similar to the one given by Naka et al. (2014), who found Q(C2)/Q(H2O)= 0.26% and Q(NH2)/Q(H2O)= 0.27% (i.e., Q(NH2)/Q(C2) = 1.04). We point out, however, that a small field of view like the one of HARPS-N is not suited for accurate determination of gas production rates, as explained by A’Hearn et al. (1995), because observations with a small field of view are more sensitive to the parameters used in the Haser model.
4. [OI] lines
Oxygen atoms are produced in cometary coma by photodissociation that is a result of the solar radiation of one or several parent molecules coming from the sublimation of cometary ices. These atoms have been studied through the three forbidden oxygen lines [OI] observed in emission in the optical range (5577.339 Å for the green line and 6300.304 Å and 6363.776 Å for the red doublet lines) in all the spectra of comet R1 Lovejoy. The green line is due to the electronic transition of the oxygen atoms from the 1S to the 1D state, and the red lines come from the 1D state. The velocity width as well as the flux ratios I6300/I6364 and G/R = I5577/ (I6300 + I6364) were measured. The latter permits determining the parent species of oxygen atoms by comparing our results with the theoretical production rates provided by Raghuram & Bhardwaj (2013). However, an accurate measurement of the green line requires decontaminating this line from two C2 lines that are blended with it at 5577.331 Å and 5577.401 Å. This decontamination was made by substracting a C2 synthetic spectrum fitted on another C2 cometary line that appears to be close to the [OI] green line (at 5577.541 Å). More details about the creation of the C2 synthetic spectrum and its subtraction are given in Rousselot et al. (2012) and Decock et al. (2015). Figure 1 presents a spectrum of the 5577.339 Å cometary oxygen line region.
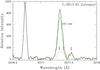 |
Fig. 1 5577.339 Å oxygen line and subtraction of C2 lines from the spectra of comet R1 Lovejoy. The black spectrum corresponds to the data not corrected for C2, the green spectrum shows the data after decontamination by the C2 lines. The red dotted line represents the C2 synthetic spectrum. The positions of the C2 lines at 5577.331 Å, 5577.401 Å and 5577.541 Å are indicated with small vertical tick marks. The bright line that appears at ~5576.7 Å is the telluric oxygen line Doppler-shifted by the geocentric velocity (all the wavelengths were shifted so that the cometary emission lines were in a common rest frame). This is the last spectrum obtained on 24 December; it corresponds to a geocentric velocity of 33.41 km s-1. |
Using the software IRAF, we measured the intensities and widths of the three [OI] lines by making a Gaussian fit. From the line fluxes, the corresponding red doublet ratio and the G/R ratio were evaluated for each spectrum. The results are provided in Table 4.
The average values over the whole sample are 3.01 ± 0.06 and 0.10 ± 0.01 for the ratio of the red doublet and that of G/R, respectively. The errors correspond to the standard deviation of the 12 spectra. Considering the theoretical production rates of Raghuram & Bhardwaj (2013; see Table 1 of Decock et al. (2015), the 1S/1D ratio corresponding to the G/R ratio), these results confirm that H2O is the main parent molecule that photodissociates to produce oxygen atoms when the comet is observed at a heliocentric distance of r ~ 1 au. This agrees with previous analyses reported for other comets (Cochran 1984, 2008; Capria et al. 2010; Decock et al. 2013, and references therein).
The intrinsic line widths corrected for the instrumental broadening were obtained from the measured observed FWHM using Eqs. (7) and (9) of Decock et al. (2013). The results for each spectrum are listed in Table 4 and are plotted in Fig. 3. The average value of the two red lines are equal within the errors (2.06 ± 0.03 km s-1 for the 6300.304 Å and 2.06 ± 0.02 km s-1 for the 6363.776 Å). The oxygen green line (2.91 ± 0.06 km s-1) is wider than the red lines, although the C2 lines have been removed. This was shown in Decock et al. (2015) and was explained by a contribution of the photodissociation of CO2 in addition to H2O in the production of oxygen atoms in the 1S state, leading to formation of the green line (and, indirectly, to the 1D state). In Fig. 3, the red line widths are highly dispersed from ~1.2 km s-1 to ~2.6 km s-1. This dispersion might depend on the CO2 relative abundance in the comet. Indeed, the higher the CO2 relative abundance, the more numerous are the oxygen atoms in the 1S and 1D states that can be produced by the photodissociation of CO2 and the greater the green and red lines widths. Consequently, our data seems to indicate that comet R1 Lovejoy had a relatively high CO2 production rate at the time of our observations. This hypothesis is, nevertheless, difficult to confirm because of the small number of comets with known CO2 abundance in our previous dataset that were analyzed in a similar manner.
Intensities (ADU), measured I6300/I6364 and G/R ratios, measured observed FWHM, (Å), and intrinsic velocity widths (km s-1) for the three forbidden oxygen lines.
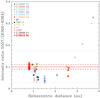 |
Fig. 2 G/R intensity ratio as a function of the heliocentric distance (au). Results for 12 other comets obtained from the UVES spectrograph and analyzed by Decock et al. (2013) are also plotted for comparison. The solid line represents the average value for the R1 Lovejoy spectra, and the corresponding standard deviation (σ) range is denoted with horizontal dashed lines. |
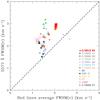 |
Fig. 3 5577.339 Å FWHM(v) against the red line average FWHM(v). Results for 12 other comets obtained from UVES spectrograph and analyzed by Decock et al. (2013) are also plotted for comparison. |
5. 12C/13C ratio
Because of the high-resolution of our spectra, it has been possible to search for 12C13C emission lines. These lines are blended with bright C2 emission lines and, as shown in Rousselot et al. (2012), only two bandheads can be used. They correspond to the (2, 1) and (1, 0) bands (d3Π → a3Π transition), located around 4723 and 4745 Å. Unfortunately, a strong solar Fraunhofer line, which is difficult to remove completely, prevents using the (1, 0) bandhead (also blended with NH2 emission lines). For this reason, it has been possible to search only for the (2, 1) bandhead, which has been clearly detected in our spectra.
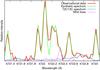 |
Fig. 4 C2 and 12C13C emission lines corresponding to the (2,1) bandhead. Some NH2 emission lines also appear in this region. They have been fitted with ad hoc intensities. The 12C13C fit corresponds to a 12C/13C ratio of 80. To improve the signal-to-noise ratio, the intensities have been averaged on 0.03 Å spectral bins. The (2,1) 12C13C bandhead appears clearly at 4722.8 Å. |
From this bandhead we computed the 12C/13C ratio. We followed the method described by Rousselot et al. (2012). In a first step we estimated the best parameters to fit the C2 emission bands with a mix of two different Boltzmann distributions. We found that a mix of 85% of C2 radicals with Trot = 4000 K and 15% with Trot = 800 K correctly described the observed C2 spectrum (in the Δv = + 1 band sequence). In a second step we applied these parameters with different 12C/13C ratio to search for the best fit with the observational data.
At the end we estimated the 12C/13C ratio to be 80 ± 30. Figure 4 presents the resulting fit with this ratio. This ratio is compatible, within the error bars, with the ratios obtained either from the C2 or from the CN emission lines for other comets (see Rousselot et al. 2012 and Wyckoff et al. 2000 for C2 and Manfroid et al. 2009 for CN). It is also compatible with the terrestrial value of 89 and the value detected in other solar system objects, such as the Sun, Venus, the Moon, Mars, Jupiter, Saturn, Titan, Neptune, meteorites, or interplanetary dust particles (Woods & Willacy 2009). This means that comet R1 Lovejoy does not seem to present any significant difference in its 12C/13C ratio compared to other comets.
6. Search for 15NH2 emission lines
The 15NH2 emission lines are weak and were only recently detected for the first time thanks to new laboratory data (Rousselot et al. 2014). The lines allow measuring the 14N/15N isotopic ratio by comparing their intensity to the 14NH2 counterpart emission lines. It was interesting to find out whether cometary spectra obtained with a four-meter-class telescope could reveal these faint emission lines. After combining the spectra to obtain a single spectrum with the best signal-to-noise ratio and computing average intensities in 0.03 Å spectral bins, we were able to detect four different 15NH2 emission lines, located at 5710.959, 5711.275, 5762.995, and 5763.076 Å (these last two lines are blended). Figure 5 presents the lines detected at 5710.959 and 5711.275 Å.
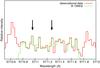 |
Fig. 5 15NH2 emission lines that were detected with our observational data at 5710.959 and 5711.275 Å ((0, 10, 0)–(0, 0, 0) band). The intensities have been averaged on 0.03 Å spectral bins, and we fitted the lines ad hoc with the 15NH2 lines located at the above-mentioned wavelengths. |
The signal-to-noise ratio obtained for the 15NH2 emission lines is poor (~3), but we tried, nevertheless, to compute an average ratio of the 15NH2 emission line intensities with their equivalent 14NH2 counterpart (as was done by Rousselot et al. 2014). We found I(14NH2)/I(15NH2) = 100 ± 50. This ratio is compatible with the 14N/15N ratio that was previously mesured either from the NH2 (Rousselot et al. 2014) or from the CN (Manfroid et al. 2009). We point out, however, that, in view of the lack of a complete fluorescence model with known 15NH2 transition probabilities, it is not necessarily really representative of the 14NH2/15NH2 ratio (because we cannot exclude a significant influence of Fraunhofer absorption lines in the intensity ratio, the heliocentric velocity being nearly constant for our four observation nights).
7. Conclusion
Comet R1 Lovejoy was among the brightest comets visible in the last few years, which offered a good opportunity to perform high-resolution spectroscopic observations with a four-meter-class telescope to obtain information about its physical composition. Our observations, performed with an advanced instrument designed to obtain stellar radial velocities, demonstrate that it can be used efficiently to perform cometary observations and obtain physical data from them.
Our main results can be summarized as follows.
-
The ratio Q(NH2)/Q(C2) for R1 Lovejoy does not deviate significantly from that of typical comets.
-
For the oxygen emission lines the study of the G/R ratio confirms that H2O is the main carrier of oxygen atoms in comet R1 Lovejoy. The width of the green and red lines seems to indicate that comet R1 Lovejoy had a relatively high CO2 production rate at the time of observation.
-
12C/13C = 80 ± 30 for C2 radical, which is similar to other measurements performed so far in other comets. Comet R1 Lovejoy does not seem to present any specific depletion or enrichement in 13C.
-
Four different 15NH2 emission lines can be detected in our spectra (two of them are blended). The signal-to-noise ratio is poor, and it is not possible to derive an accurate 14N/15N isotopic ratio in ammonia. A simple computation of the intensity ratio of these lines, with their 14NH2 counterpart, leads to 14NH2/15NH2 = 100 ± 50, which is compatible with the 14N/15N ratio derived so far both from the CN and NH2 radicals.
Acknowledgments
The research leading to these results has received funding from the European Community’s Seventh Framework Programme (FP7/2013–2016) under grant agreement number 312430 (OPTICON). E. Jehin is FNRS Research Associate, Jean Manfroid is Honorary Research Director of the FNRS, D. Hutsemékers is FNRS Senior Research Associate.
References
- A’Hearn, M. F., Millis, R. C., Schleicher, D. O., Osip, D. J., & Birch, P. V. 1995, Icarus, 118, 223 [NASA ADS] [CrossRef] [Google Scholar]
- Capria, M. T., Cremonese, G., & de Sanctis, M. C. 2010, A&A, 522, A82 [NASA ADS] [CrossRef] [EDP Sciences] [Google Scholar]
- Cochran, A. L. 2008, Icarus, 198, 181 [NASA ADS] [CrossRef] [Google Scholar]
- Cochran, W. D. 1984, Icarus, 58, 440 [NASA ADS] [CrossRef] [Google Scholar]
- Cosentino, R., Lovis, C., Pepe, F., et al. 2012, in SPIE Conf. Ser., 8446, 1 [Google Scholar]
- Decock, A., Jehin, E., Hutsemékers, D., & Manfroid, J. 2013, A&A, 555, A34 [NASA ADS] [CrossRef] [EDP Sciences] [Google Scholar]
- Decock, A., Jehin, E., Rousselot, P., et al. 2015, A&A, 573, A1 [NASA ADS] [CrossRef] [EDP Sciences] [Google Scholar]
- Fink, U. 2009, Icarus, 201, 311 [Google Scholar]
- Guido, E., Howes, N., Sato, H., et al. 2013, Central Bureau Electronic Telegrams, 3649, 1 [NASA ADS] [Google Scholar]
- Haser, L. 1957, Bull. Soc. Roy. Sci. Liège, 43, 740 [Google Scholar]
- Langland-Shula, L. E., & Smith, G. H. 2011, Icarus, 213, 280 [CrossRef] [Google Scholar]
- Manfroid, J., Jehin, E., Hutsemékers, D., et al. 2009, A&A, 503, 613 [NASA ADS] [CrossRef] [EDP Sciences] [Google Scholar]
- Naka, C., Ogawa, S., Shinnaka, Y., et al. 2014, in Asteroids, Comets, Meteors, eds. K. Muinonen, A. Penttilä, M. Granvik, et al., 382 [Google Scholar]
- Raghuram, S., & Bhardwaj, A. 2013, Icarus, 223, 91 [NASA ADS] [CrossRef] [Google Scholar]
- Rousselot, P., Jehin, E., Manfroid, J., & Hutsemékers, D. 2012, A&A, 545, A24 [NASA ADS] [CrossRef] [EDP Sciences] [Google Scholar]
- Rousselot, P., Pirali, O., Jehin, E., et al. 2014, ApJ, 780, L17 [NASA ADS] [CrossRef] [EDP Sciences] [Google Scholar]
- Woods, P. M., & Willacy, K. 2009, ApJ, 693, 1360 [NASA ADS] [CrossRef] [Google Scholar]
- Wyckoff, S., Kleine, M., Peterson, B. A., Wehinger, P. A., & Ziurys, L. M. 2000, ApJ, 535, 991 [NASA ADS] [CrossRef] [Google Scholar]
All Tables
Parameters used to determine the gas production rates (for r = 1 au) and their dependence on the heliocentric distance r (Langland-Shula & Smith 2011).
Intensities (ADU), measured I6300/I6364 and G/R ratios, measured observed FWHM, (Å), and intrinsic velocity widths (km s-1) for the three forbidden oxygen lines.
All Figures
|
Fig. 1 5577.339 Å oxygen line and subtraction of C2 lines from the spectra of comet R1 Lovejoy. The black spectrum corresponds to the data not corrected for C2, the green spectrum shows the data after decontamination by the C2 lines. The red dotted line represents the C2 synthetic spectrum. The positions of the C2 lines at 5577.331 Å, 5577.401 Å and 5577.541 Å are indicated with small vertical tick marks. The bright line that appears at ~5576.7 Å is the telluric oxygen line Doppler-shifted by the geocentric velocity (all the wavelengths were shifted so that the cometary emission lines were in a common rest frame). This is the last spectrum obtained on 24 December; it corresponds to a geocentric velocity of 33.41 km s-1. |
| In the text | |
|
Fig. 2 G/R intensity ratio as a function of the heliocentric distance (au). Results for 12 other comets obtained from the UVES spectrograph and analyzed by Decock et al. (2013) are also plotted for comparison. The solid line represents the average value for the R1 Lovejoy spectra, and the corresponding standard deviation (σ) range is denoted with horizontal dashed lines. |
| In the text | |
|
Fig. 3 5577.339 Å FWHM(v) against the red line average FWHM(v). Results for 12 other comets obtained from UVES spectrograph and analyzed by Decock et al. (2013) are also plotted for comparison. |
| In the text | |
|
Fig. 4 C2 and 12C13C emission lines corresponding to the (2,1) bandhead. Some NH2 emission lines also appear in this region. They have been fitted with ad hoc intensities. The 12C13C fit corresponds to a 12C/13C ratio of 80. To improve the signal-to-noise ratio, the intensities have been averaged on 0.03 Å spectral bins. The (2,1) 12C13C bandhead appears clearly at 4722.8 Å. |
| In the text | |
|
Fig. 5 15NH2 emission lines that were detected with our observational data at 5710.959 and 5711.275 Å ((0, 10, 0)–(0, 0, 0) band). The intensities have been averaged on 0.03 Å spectral bins, and we fitted the lines ad hoc with the 15NH2 lines located at the above-mentioned wavelengths. |
| In the text | |
Current usage metrics show cumulative count of Article Views (full-text article views including HTML views, PDF and ePub downloads, according to the available data) and Abstracts Views on Vision4Press platform.
Data correspond to usage on the plateform after 2015. The current usage metrics is available 48-96 hours after online publication and is updated daily on week days.
Initial download of the metrics may take a while.