Fig. 4
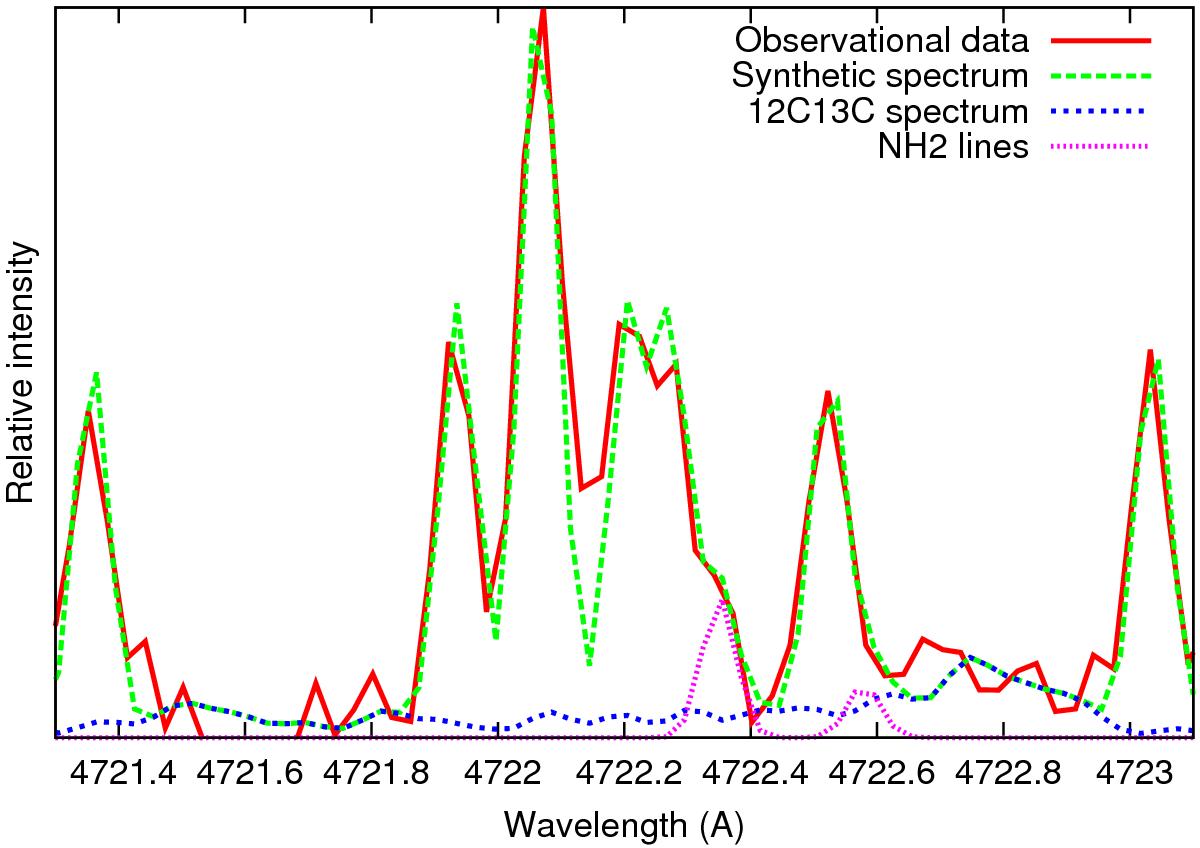
C2 and 12C13C emission lines corresponding to the (2,1) bandhead. Some NH2 emission lines also appear in this region. They have been fitted with ad hoc intensities. The 12C13C fit corresponds to a 12C/13C ratio of 80. To improve the signal-to-noise ratio, the intensities have been averaged on 0.03 Å spectral bins. The (2,1) 12C13C bandhead appears clearly at 4722.8 Å.
Current usage metrics show cumulative count of Article Views (full-text article views including HTML views, PDF and ePub downloads, according to the available data) and Abstracts Views on Vision4Press platform.
Data correspond to usage on the plateform after 2015. The current usage metrics is available 48-96 hours after online publication and is updated daily on week days.
Initial download of the metrics may take a while.