Fig. 1
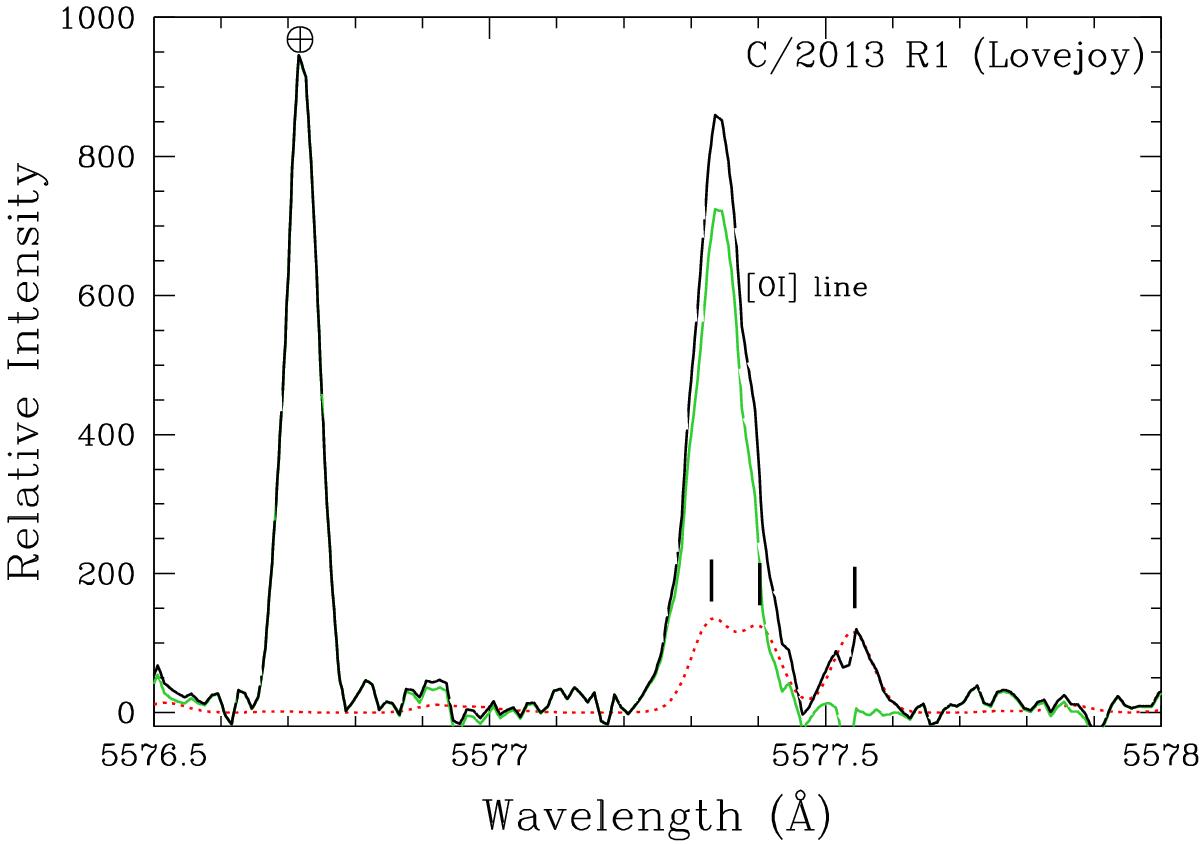
5577.339 Å oxygen line and subtraction of C2 lines from the spectra of comet R1 Lovejoy. The black spectrum corresponds to the data not corrected for C2, the green spectrum shows the data after decontamination by the C2 lines. The red dotted line represents the C2 synthetic spectrum. The positions of the C2 lines at 5577.331 Å, 5577.401 Å and 5577.541 Å are indicated with small vertical tick marks. The bright line that appears at ~5576.7 Å is the telluric oxygen line Doppler-shifted by the geocentric velocity (all the wavelengths were shifted so that the cometary emission lines were in a common rest frame). This is the last spectrum obtained on 24 December; it corresponds to a geocentric velocity of 33.41 km s-1.
Current usage metrics show cumulative count of Article Views (full-text article views including HTML views, PDF and ePub downloads, according to the available data) and Abstracts Views on Vision4Press platform.
Data correspond to usage on the plateform after 2015. The current usage metrics is available 48-96 hours after online publication and is updated daily on week days.
Initial download of the metrics may take a while.