Fig. 2
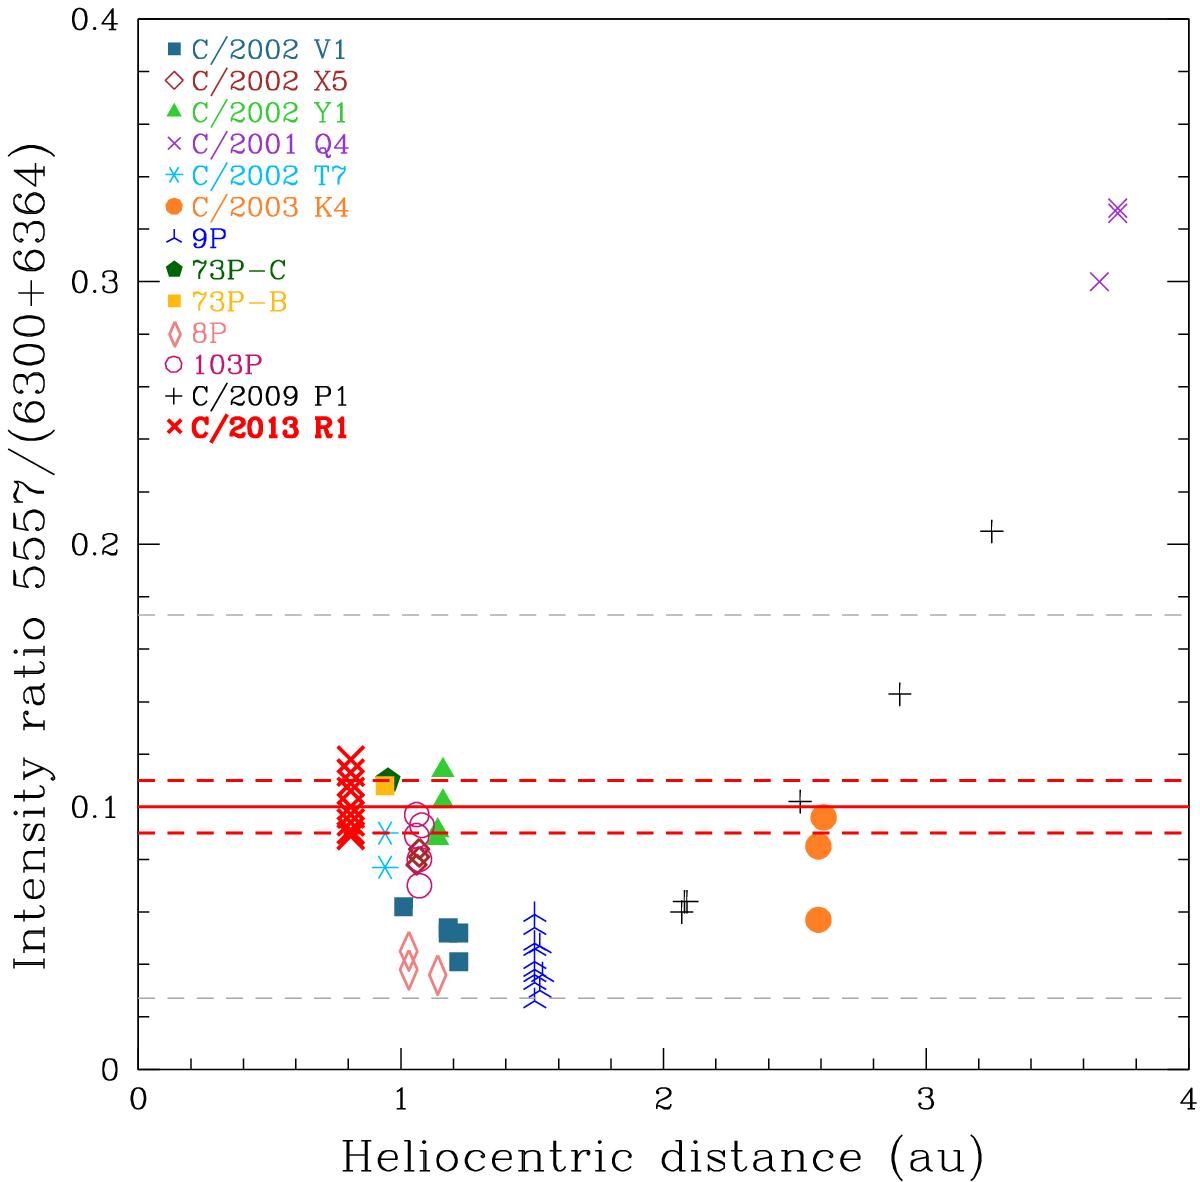
G/R intensity ratio as a function of the heliocentric distance (au). Results for 12 other comets obtained from the UVES spectrograph and analyzed by Decock et al. (2013) are also plotted for comparison. The solid line represents the average value for the R1 Lovejoy spectra, and the corresponding standard deviation (σ) range is denoted with horizontal dashed lines.
Current usage metrics show cumulative count of Article Views (full-text article views including HTML views, PDF and ePub downloads, according to the available data) and Abstracts Views on Vision4Press platform.
Data correspond to usage on the plateform after 2015. The current usage metrics is available 48-96 hours after online publication and is updated daily on week days.
Initial download of the metrics may take a while.