Free Access
Fig. 5
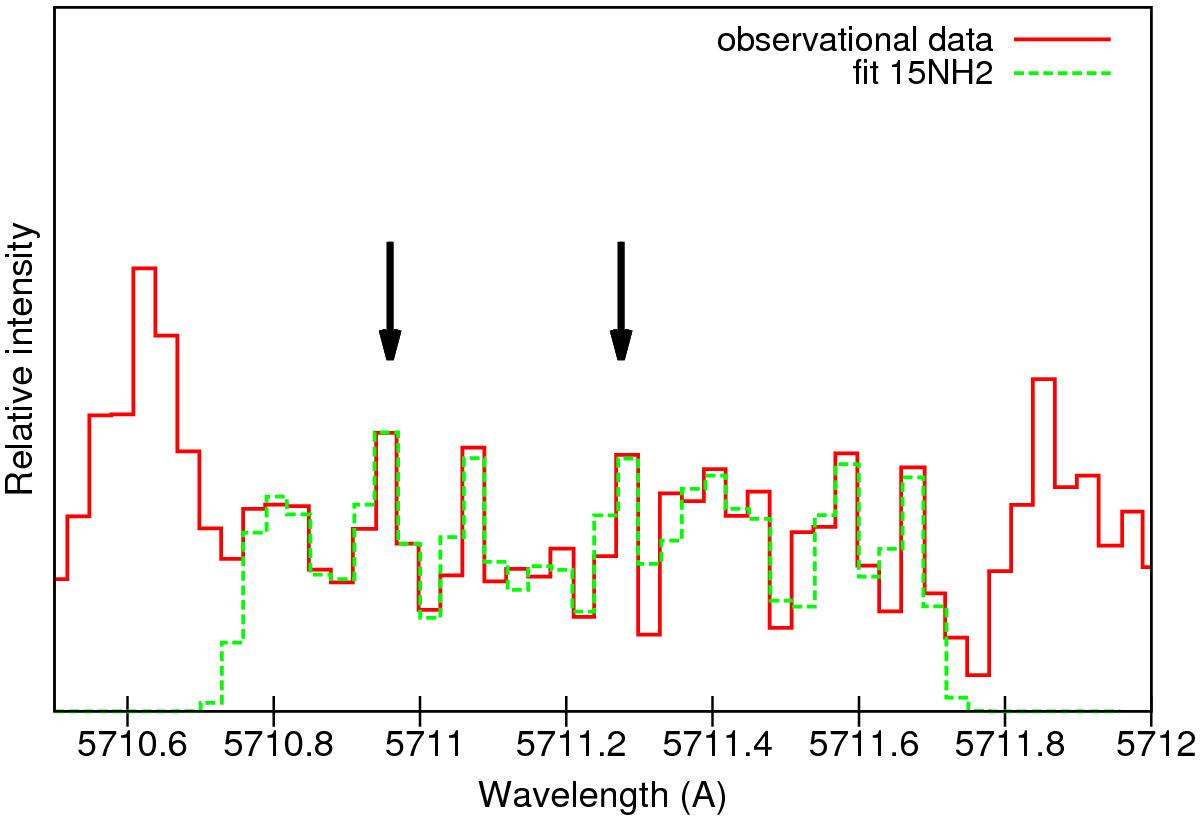
15NH2 emission lines that were detected with our observational data at 5710.959 and 5711.275 Å ((0, 10, 0)–(0, 0, 0) band). The intensities have been averaged on 0.03 Å spectral bins, and we fitted the lines ad hoc with the 15NH2 lines located at the above-mentioned wavelengths.
Current usage metrics show cumulative count of Article Views (full-text article views including HTML views, PDF and ePub downloads, according to the available data) and Abstracts Views on Vision4Press platform.
Data correspond to usage on the plateform after 2015. The current usage metrics is available 48-96 hours after online publication and is updated daily on week days.
Initial download of the metrics may take a while.