| Issue |
A&A
Volume 577, May 2015
|
|
|---|---|---|
| Article Number | A59 | |
| Number of page(s) | 18 | |
| Section | Extragalactic astronomy | |
| DOI | https://doi.org/10.1051/0004-6361/201425574 | |
| Published online | 05 May 2015 | |
Isolated ellipticals and their globular cluster systems
III. NGC 2271, NGC 2865, NGC 3962, NGC 4240, and IC 4889 ⋆,⋆⋆,⋆⋆⋆
1 Finnish Centre for Astronomy with ESO (FINCA), University of Turku, Väisäläntie 20, 21500 Piikkiö, Finland
e-mail: rsalinas@pa.msu.edu
2 Department of Physics and Astronomy, Michigan State University, East Lansing, MI 48824, USA
3 Tuorla Observatory, University of Turku, Väisäläntie 20, 21500 Piikkiö, Finland
4 Centre for Astrophysics and Supercomputing, Swinburne University of Technology, VIC 3122 Hawthorn, Australia
5 Departamento de Astronomía, Universidad de Concepción, Concepción, Chile
Received: 22 December 2014
Accepted: 21 February 2015
As tracers of star formation, galaxy assembly, and mass distribution, globular clusters have provided important clues to our understanding of early-type galaxies. But their study has been mostly constrained to galaxy groups and clusters where early-type galaxies dominate, leaving the properties of the globular cluster systems (GCSs) of isolated ellipticals as a mostly uncharted territory. We present Gemini-South/GMOS g′i′ observations of five isolated elliptical galaxies: NGC 3962, NGC 2865, IC 4889, NGC 2271, and NGC 4240. Photometry of their GCSs reveals clear color bimodality in three of them, but remains inconclusive for the other two. All the studied GCSs are rather poor with a mean specific frequency SN ~ 1.5, independently of the parent galaxy luminosity. Considering information from previous work as well, it is clear that bimodality and especially the presence of a significant, even dominant, population of blue clusters occurs at even the most isolated systems, which casts doubts on a possible accreted origin of metal-poor clusters, as suggested by some models. Additionally, we discuss the possible existence of ultra-compact dwarfs around the isolated elliptical NGC 3962.
Key words: galaxies: elliptical and lenticular, cD / galaxies: star clusters: general / galaxies: structure
Based on observations obtained at the Gemini Observatory, which is operated by the Association of Universities for Research in Astronomy, Inc., under a cooperative agreement with the NSF on behalf of the Gemini partnership: the National Science Foundation (United States), the Science and Technology Facilities Council (United Kingdom), the National Research Council (Canada), CONICYT (Chile), the Australian Research Council (Australia), Ministério da Ciência, Tecnologia e Inovação (Brazil) and Ministerio de Ciencia, Tecnología e Innovación Productiva (Argentina).
Globular cluster photometry is available in electronic form at the CDS via anonymous ftp to cdsarc.u-strasbg.fr (130.79.128.5) or via http://cdsarc.u-strasbg.fr/viz-bin/qcat?J/A+A/577/A59
Appendices are available in electronic form at http://www.aanda.org
© ESO, 2015
1. Introduction
The globular cluster systems (GCSs) of old, massive, elliptical galaxies present an almost ubiquitous optical color bimodality (e.g., Kundu & Whitmore 2001; Larsen et al. 2001), which is thought to correspond to a metallicity bimodality (e.g., Strader et al. 2007; Usher et al. 2012; Brodie et al. 2012), with caveats coming from possible nonlinearities of the color-metallicity transformations that are introduced by horizontal-branch stars (Richtler 2006, 2013; Yoon et al. 2006; Chies-Santos et al. 2012; Blakeslee et al. 2012).
Basic data of the galaxies presented in this work.
This universal bimodality has obviously been one of the main aspects that the theories of GCS formation need to address. Many scenarios, not necessarily exclusive and somewhat overlapping, have been put forward over the years (e.g., Ashman & Zepf 1992; Forbes et al. 1997; Côté et al. 1998; Beasley et al. 2002; Rhode et al. 2005; Muratov & Gnedin 2010; Elmegreen et al. 2012; Tonini 2013).
Since elliptical galaxies are known to mostly inhabit high-density environments (e.g., Dressler 1980), most of the GCS studies, and hence the observational constraints to these theories, have naturally been focused on galaxy clusters (e.g., Peng et al. 2006; Harris et al. 2006; Strader et al. 2006; Liu et al. 2011).
In the currently reigning paradigm of galaxy formation, accretion and merging play the central roles (e.g., Cole et al. 1994; De Lucia et al. 2006), and are strongly supported observationally (e.g., Ibata et al. 1994; Tal et al. 2009; van Dokkum et al. 2010). Simulations predict an accretion history for elliptical galaxies in low-density environments that is different from the history of their high-density siblings (e.g., Niemi et al. 2010); but the impact that a low-density environment may have on the properties of a GCS has seldom been investigated (e.g., Gebhardt & Kissler-Patig 1999), although it could give important evidence to distinguish between accretion-driven (e.g. Côté et al. 1998; Hilker et al. 1999) and in situ (Forbes et al. 1997) scenarios.
Only a handful of isolated elliptical galaxies (IEs) have thoroughly studied GCS (e.g., Spitler et al. 2008) because there are so very few of them in the local environment. No field ellipticals are listed, for example, in the extensive compilation of Brodie & Strader (2006, see their Table 1, and only a handful can be seen in the newer compilation of Harris et al. (2013). Recently, Cho et al. (2012) studied ten early-type galaxies in low-density environments in the magnitude range −18.5 <MB< −20 using HST/ACS, although exclusively using the density parameter of Tully (1988) as the isolation criterion.
This paper is part of an effort made to understand the properties of GCS in IEs and their connections to their parent galaxies, for which we collect a large sample. This paper is a continuation of Lane et al. (2013, hereafter Paper I) who studied the GCS of the IE NGC 3585 and NGC 5812 using Washington photometry, and Richtler et al. (2015, Paper II), who studied the IE NGC 7796. It is also complemented by the study of the field elliptical NGC 7507 (Caso et al. 2013), which was also conducted by our group.
1.1. Galaxy sample
As isolated galaxies provide the opportunity of studying galaxies without the interference of many of the processes that affect their structure and evolution in more crowded environments, many samples of IEs have been constructed, using diverse isolation criteria (Kuntschner et al. 2002; Smith et al. 2004; Stocke et al. 2004; Reda et al. 2004; Collobert et al. 2006; Nigoche-Netro et al. 2007; Fuse et al. 2012).
In this work we present observations of five IEs taken from the catalogs of Smith et al. (2004) and Reda et al. (2004); they are closer than ~50 Mpc and observable from the southern hemisphere. The GCS of NGC 2865 and IC 4889 have been studied before, albeit with a smaller field of view (see below). In the following we give their main characteristics as found in the literature.
-
NGC 2271 is an E/S0 at a surface brightnessfluctuation distance of 31.8 Mpc (Tonryet al. 2001) present in the catalog ofReda et al. (2004). Redaet al. (2007) measured an ageof 11.5 ± 0.5 Gyr, with no evidence of radial age or metallicity gradients, while Hau & Forbes (2006) found strong rotation and kinematic signatures of an inner disk, which was also found in optical imaging (de Souza et al. 2004).
-
NGC 2865 is an E3 listed in the catalog of Reda et al. (2004). It is known for the wealth of substructure it possesses (shells, tails, etc.) (Michard & Prugniel 2004; de Souza et al. 2004; Tal et al. 2009; Urrutia-Viscarra et al. 2014), because it most probably is a merger remnant (Hau et al. 1999) with a kinematically distinct core (Hau & Forbes 2006). It presents a remarkably steep age gradient from a central ~1.5 Gyr (Sánchez-Blázquez et al. 2007; Reda et al. 2007) to ~10 Gyr close to 1Re; it also has a steep metallicity gradient (Reda et al. 2007). Its GCS was studied by Sikkema et al. (2006) using HST/ACS, finding a sizeable blue population consistent with a young-to-intermediate GC population (see also Trancho et al. 2014).
-
NGC 3962 is part of the sample of Smith et al. (2004) of field ellipticals without companions, as confirmed by Madore et al. (2004), and no signs of any tidal disturbance (Tal et al. 2009). Annibali et al. (2007) measured an age of 10 Gyr, while Serra & Oosterloo (2010) estimated an age of ~2.5 Gyr.
-
NGC 4240 was taken from the catalog of Reda et al. (2004). Reda et al. (2007) found a central age of 7.5 Gyr followed by a mild age gradient. The existence of a likewise shallow metallicity gradient is explained as an indication of a past major merger. It possesses a kinematically distinct core and a mostly flat velocity dispersion profile (Hau & Forbes 2006).
-
IC 4889 is an E/S0 (Laurikainen et al. 2011) present in the catalog of Smith et al. (2004), showing isophotal twisting (Tal et al. 2009) as well as a dusty disk (Smith et al. 2004). Serra & Oosterloo (2010) estimated an age of ~3.6 Gyr. Its GCS has been studied by Gebhardt & Kissler-Patig (1999) using HST data, without finding evidence for bimodality.
The rest of the paper is distributed as follows: in Sect. 2.1 we describe observations, data reduction, and stellar photometry. In Sect. 3 we present the results on the color distribution of globular clusters, while radial profiles are presented in Sect. 4. GC luminosity functions are calculated in Sect. 5. Section 6 describes the properties of the galaxies themselves and their connections to their GCS. Section 7 places the results in a broader context before we conclude in Sect. 8.
2. Observations and data reduction
2.1. Gemini-S/GMOS imaging
Imaging of the five galaxies was obtained using GMOS, which is mounted at the Gemini South Telescope, Cerro Pachón, Chile (program ID GS-2012A-Q-6). GMOS comprises three detectors covering in total a field of view of 5.5 × 5.5 arcmin2, with a pixel scale of 0.146′′ pixel-1 after a 2 × 2 binning. A set of dithered images in the SDSS filters g′ and i′ was obtained. Details of the observations are listed in Table 2.
Observations log.
Image reduction was carried out inside the Gemini/IRAF1 package (v 1.9). Reduction included bias subtraction, flat-fielding, detector mosaicking, fringe removal (for the i′ exposures), and image co-addition. Processed bias, flat and fringe frames were retrieved from the Gemini Science Archive website. The FWHM measured on point sources in the final images is listed Table 2. The image quality in the IC 4889 exposures showed considerable variations between the two dates, for this reason, the combined g′ image takes data only from the May 2012 observations, while the combined i′ was constructed with images taken in the night in April 2012 only.
2.1.1. Stellar photometry
To facilitate the source detection, images were first median filtered using a box of 10′′ aside. This process removes the parent galaxy light (everywhere but in the innermost arcseconds), leaving the point sources unaltered. A median value of the sky, determined from blank portions in the unsubtracted images distant from the central galaxy, was then added back to the images to keep the correct photon statistics during the detection and photometry stages.
Object identification was carried out using SEXTRACTOR (Bertin & Arnouts 1996). The choice of the detection filter can have important consequences on the number of identified sources; while a Gaussian filter provides a better detection rate for the faintest sources, a “Mexican hat” filter gives better results for sources very close to saturated stars or to the center of the galaxy-unsubtracted residual. Given the relatively low Galactic latitude of some of the targets (NGC 2271 and NGC 2865) and the clumpy nature of some galaxy residuals (for example, IC 4889, see Sect. 6), the Mexican hat filter is the most suitable option. SEXTRACTOR was then run twice on each image using both detection filters. Duplicate detections within 3 pixels were removed from the merged catalogs.
Concentric aperture and psf-fitting photometry was obtained using the stand-alone version of DAOPHOT/ALLSTAR (Stetson 1987) using as input the object coordinates from SEXTRACTOR. Between 30 and 50 bright isolated stars per field were chosen to determine the psf shape. Aperture corrections for each frame were measured using a subset of these stars.
Point sources were selected based on the behavior of the SEXTRACTOR output parameter class_star and ALLSTAR parameter sharp. The accepted range of values for both parameters was determined from the results of the artificial-stars experiments (see Sect. 2.1.2). Final cross-search between the stellar positions in the two different bands was made using DAOMATCH/DAOMASTER (Stetson 1993), keeping in the final catalog only sources present in both bands with a tolerance of 3 pixels (~0.5″) in their positions, thus weeding out remaining spurious detections.
Standard stars frames from the southern extension of the catalog of Smith et al. (2002) observed on the same nights as our science frames were retrieved from the Gemini Science Archive. These frames were reduced following the same procedure as for the science images, with the exception of the fringe correction, which was deemed to be unnecessary given the short exposures (~5 s) in the i′ filter. The number of standard stars measured for each night are listed Table 3. The transformation equations to the standard system used were ![\begin{eqnarray} \label{eq:1} g'_{\rm obs} &=& g'_{\rm std} + Z_g + K_g (X-1) + b_g (g'-i')_{\rm std} \\[2mm] \label{eq:2} i'_{\rm obs}\, \, &=& i'_{\rm std} + Z_i + K_i (X-1) + b_i (g'-i')_{\rm std} , \end{eqnarray}](/articles/aa/full_html/2015/05/aa25574-14/aa25574-14-eq39.png) where X denotes the airmass of the observation. Coefficients were obtained using IRAF/PHOTCAL. The extinction coefficients were taken from the Gemini webpages and not fit, given the small range of airmasses covered by the observations. In addition, when fewer than 20 stars were available in a field, the color terms were fixed to the values obtained for NGC 4240 for which the largest number of standard stars was available. Coefficients used for each galaxy are listed in Table 3.
where X denotes the airmass of the observation. Coefficients were obtained using IRAF/PHOTCAL. The extinction coefficients were taken from the Gemini webpages and not fit, given the small range of airmasses covered by the observations. In addition, when fewer than 20 stars were available in a field, the color terms were fixed to the values obtained for NGC 4240 for which the largest number of standard stars was available. Coefficients used for each galaxy are listed in Table 3.
2.1.2. Photometry completeness
To study the level of completeness as a function of magnitude, artificial stars experiments were conducted using DAOPHOT/ADDSTAR. In each of the co-added frames (i.e., those where the galaxy light was not yet subtracted), we added 200 point sources covering a wide magnitude range. These new frames were then processed in the same way as previously described: galaxy subtraction with median filtering, source detection with SEXTRACTOR, and psf photometry with DAOPHOT. The procedure was repeated 50 times for a total of 10 000 artificial stars per galaxy per filter. An example of the fraction of recovered stars as a function of magnitude is plotted in Fig. 1 (top panel).
The fraction of recovered stars was fitted with the interpolation formula, 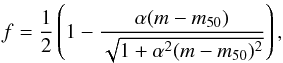 (3)which gives a good analytical description of the completeness, and which has been used for many GC studies (e.g., McLaughlin et al. 1994; Fleming et al. 1995; Wehner et al. 2008; Alamo-Martínez et al. 2012). The free parameters α and m50 indicate the speed at which the detection rate falls at the faint level and the 50% completeness, respectively. The values for both parameters for all fields and filters are listed in Table 4.
Artificial stars experiments are not only useful for understanding the detection limits, but also for understanding the behavior of the photometric measurements at these faint magnitudes. Separation between point and extended sources is a prevailing problem in galactic and extragalactic studies, and several methods are commonly used (e.g., Harris et al. 1991; Bertin & Arnouts 1996; Clem et al. 2008; Durret et al. 2009; Cho et al. 2012). We preferred to use a combination of the SEXTRACTOR output parameter class_star, a stellarity likelihood, and the ALLSTAR parameter sharp, which measures deviations from the derived psf. In Fig. 1, we show an example of the behavior of these two parameters as a function of magnitude for the artificial stars (black circles) and the detected sources (red circles). Blue dashed lines show the limits that define the envelopes of the artificial stars. Only about 1%–2% of the total artificial stars lie beyond these limits. In the following we consider as point sources the sources that satisfy these criteria.
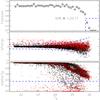 |
Fig. 1 Top panel: fraction of recovered stars after the artificial-star experiment in the i′ observations of NGC 4240. The dotted line is the fitted interpolation function (see Eq. (3)). The dashed blue lines indicate the 50% level of completeness. Middle panel: behavior of the ALLSTAR parameter sharp. Bottom panel: SEXTRACTOR stellarity index. In both panels artificial stars are indicated with black circles, while the real sources are plotted in red. The blue dashed lines indicate the point source criteria applied to the science data based on the artificial one. |
2.1.3. Estimating the contamination
GCSs of elliptical galaxies can have radial extensions of up to hundreds of kpc (e.g., Richtler et al. 2011; Schuberth et al. 2012). Given the relatively small FOV provided by GMOS at the galaxies’ distance (see Col. 10 in Table 1), a control field cannot be taken within the same telescope pointing as in wide-field studies (e.g., Rhode & Zepf 2001; Dirsch et al. 2003; Paper I), but has to be selected elsewhere. Control fields are necessary to determine the contamination the GC samples suffer; this contamination comes partly from stars and from faint background galaxies that cannot be culled during the point-source selection (Sect. 2.1.1).
Since our observing program did not include any control field, an appropriate field was selected in the Gemini Science Archive, finding that the William Herschel Deep Field (WHDF) had similar total exposure times and image quality as our science data, and a very similar setup, using g′ and i′ filters on Gemini-N/GMOS (Gemini ID GN-2001B-SV-104, Metcalfe et al. 2001). The main caveat of using the WHDF as control field lies in its relatively high Galactic latitude (b ~ −61°), implying that the stellar contamination is probably underestimated, although at the faint levels where the bulk of the GC studied here are located, the dominant component of the contamination will be unresolved background galaxies, instead of stars (Faifer et al. 2011). The WHDF counts were hence complemented by adding star counts adopted from the Besançon Galactic models (Robin et al. 2003) at each galaxy position. As noted by Lane et al. (2011), comparisons between the Besançon models and pencil beam surveys can be problematic because of stellar streams or other Local Group objects that are not included in the model. In our case, neither the WHDF nor the studied galaxies lie close to any of these features.
Completeness.
The reduction, photometry, artificial stars experiments and point-source definition of the WHDF were carried out in the same way as the target galaxies, with the exception of the median filtering, in the absence of a dominant galaxy. The color-magnitude diagram of sources in the WHDF are shown in Fig. 2 (bottom right panel). Since the completeness of the WHDF is shallower than the photometry in the NGC 2865 and NGC 4240 fields, the contamination in the faint end of these fields was estimated by multiplying the number of detected contaminant sources with the ratio of the interpolation functions (Eq. (3)) of the galaxies to that of the WHDF; generating bootstrapped samples with the expected number of contaminant sources.
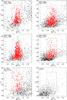 |
Fig. 2 Color–magnitude diagrams for sources detected around the five galaxies plus the control field (bottom right). Small black dots indicate the resolved sources, while the large black dots are the point sources as determined in Sect. 2.1.2. Globular clusters are depicted in red, inside the magnitude and color limits explained in the text. The number of GC candidates stated for each galaxy is before any decontamination and within the FOV. Green triangles in the NGC 3962 panel indicate UCD candidates (see Sect. 7.4). |
2.2. SOAR/SAM imaging
Additional imaging of NGC 3962 was acquired in the night of April 22, 2014, using the SOAR Adaptive Module (SAM) and its Imager (SAMI; Tokovinin et al. 2010, 2012). SAM is a ground-layer adaptive optics system installed at the SOAR 4.1 m telescope at Cerro Pachón, Chile. SAMI gives a field of view (FOV) of 3 × 3 arcmin with a scale of 0.091′′ pixel-1 (2 × 2 binning).
In total, 5 × 120, 3 × 120, and 5 × 120 s exposures were taken in the SDSS g, r, and i filters, respectively. Details of the reduction process will be given in a forthcoming paper (Salinas et al., in prep.), and only a preliminary calibration to the standard system, not crucial for its scientific goal, is given here. The FWHM measured on the combined images was 0.59″, 0.55″, and 0.50″ in the g, r, and i filters, respectively. This set of images, of higher resolution than the GMOS imaging, was used to study to the galaxy center where the deeper GMOS images were saturated. More details are given in Sect. 6.
3. GC color distribution
Color–magnitude diagrams for all the point sources in our target galaxies are shown in Fig. 2 as large black points, while resolved sources are depicted will small black dots. Globular cluster candidates were further limited to the color range 0.4 < (g − i)0< 1.4, following previous GCS studies with the same filters (Forbes et al. 2004; Wehner et al. 2008; Faifer et al. 2011), but with a slightly bluer limit to allow studying possible younger clusters (as in NGC 2685 Sikkema et al. 2006). The bright limit was fixed at Mi = −11.5 following Faifer et al. (2011), and the faint limit was given by the 80% completeness limit in both g and i. These bounding limits can be seen in Fig. 2 with dashed lines. Photometry was corrected for Galactic extinction using the recalibration of Schlafly & Finkbeiner (2011) of the dust maps of Schlegel et al. (1998).
The effect of the color-dependent completeness is negligible for NGC 3962 and the WHDF, mild for NGC 2771 and NGC 2865, and significant for NGC 4240. There is no color-dependent completeness for IC 4889.
None of the GCSs present an instantly obvious bimodal color distribution as their more massive counterparts in cluster environments (e.g., Dirsch et al. 2003), but NGC 3962 stands out by its healthy GCS. The GCSs with the deepest observations, NGC 4240 and NGC 2865, show a significant number of blue (g′ − i′ ~ 0.5) sources below i′ ~ 25, which are probably compact background galaxies that have survived the point source determination process, while IC 4889 stands out by the presence of a significant blue population throughout the entire magnitude range (21 ≲ i ≲ 24), which seems absent in the rest of the galaxies (compare, for example, with NGC 3962).
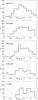 |
Fig. 3 Color histograms of the GCSs of the five target galaxies. The green dashed lines indicate the raw color distribution, the blue dotted line indicates the contamination in each field as determined in Sect. 2.1.3. The thick black lines show the background-corrected distributions. |
Figure 3 shows color histograms for the five GCSs, where the data were binned using an optimum bin size, which depends on the sample size (Izenmann 1991). Each panel shows the raw, background-corrected, and background estimate color histogram for each GCS. The background-corrected histograms reveal that most of the GC candidates with colors (g′ − i′)0 ≲ 0.7 can be accounted for as part of the contamination, except for NGC 2865 and especially NGC 4240, where a significant number of blue sources remain. The blue population in NGC 2865 is consistent with the results of Sikkema et al. (2006), who proposed the existence of a population of young clusters. Visually, the clearest case for bimodality can be seen in the IC 4889 color histogram, which contradicts the result of Gebhardt & Kissler-Patig (1999), who found no evidence of bimodality in the GCS of this galaxy.
To test the existence of bimodality in the GC color distributions more rigorously, we used a Gaussian mixture modeling (GMM) as implemented by Muratov & Gnedin (2010). GMM provides three indicators that are useful to distinguish between unimodal and bimodal distributions: the kurtosis of the distribution, k, which if negative indicates a flat-top distribution; the separation of the peaks, D, defined as ![\hbox{$D=|\mu_{\rm blue}-\mu_{\rm red}|/[(\sigma_{\rm blue}^2+\sigma_{\rm red}^2)/2]^{1/2}$}](/articles/aa/full_html/2015/05/aa25574-14/aa25574-14-eq71.png) , which, when larger than 2, indicates a clear separation between the peaks (Ashman et al. 1994); and a p-value that gives the probability of obtaining the same χ2 from a unimodal distribution. Uncertainties in each statistic were calculated with 100 bootstrapped realizations of the sample. To further test the robustness of the results, GMM was run 50 times on samples generated by randomly subtracting the number of contaminants expected per each color bin. The errors measured with this method are always within the errors obtained from the bootstrapped realizations (which are the quoted errors in Table 6), but additionally provide an uncertainty for the kurtosis that is not given by GMM. Given the large number of blue sources in NGC 4240, GMM was run for sources with 0.6 ≤ g − i ≤ 1.4, instead of 0.4 ≤ g − i ≤ 1.4 as for the rest of the galaxies.
, which, when larger than 2, indicates a clear separation between the peaks (Ashman et al. 1994); and a p-value that gives the probability of obtaining the same χ2 from a unimodal distribution. Uncertainties in each statistic were calculated with 100 bootstrapped realizations of the sample. To further test the robustness of the results, GMM was run 50 times on samples generated by randomly subtracting the number of contaminants expected per each color bin. The errors measured with this method are always within the errors obtained from the bootstrapped realizations (which are the quoted errors in Table 6), but additionally provide an uncertainty for the kurtosis that is not given by GMM. Given the large number of blue sources in NGC 4240, GMM was run for sources with 0.6 ≤ g − i ≤ 1.4, instead of 0.4 ≤ g − i ≤ 1.4 as for the rest of the galaxies.
The results of GMM applied over the background-corrected GC samples are listed in Table 6. Following Usher et al. (2012), we defined a galaxy as showing clear bimodality when the conditions p-val < 0.1, D> 2 and κ< 0 were met simultaneously. These criteria are clearly fulfilled by NGC 2271, NGC 2865, and IC 4889. NGC 4240 also fulfills the criteria, although the large number of blue sources makes its case less reliable.
The most interesting case is given by NGC 3962. Despite being the galaxy in our sample with the richest GCS and with deep observations, its peak separation is barely larger than 2, the kurtosis is very close to zero and has the highest p-value, making the case for bimodality very doubtful. Intermediate-age globular clusters are known to smear out bimodality (e.g., Richtler et al. 2012), but the luminosity function shows no sign of intermediate-age clusters (see Sect. 5). Only observations using a longer wavelength baseline will provide a more definitive answer.
Additionally, Table 6 lists the red fraction, fr, for each GCS. Red fractions, simply defined as the number of red clusters over the total number of clusters, are further discussed in Sect. 7.2.
Globular cluster radial profiles.
GMM results.
4. GC radial distribution
GCLF fitted parameters and specific frequencies.
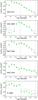 |
Fig. 4 Radial distribution of globular clusters in the studied galaxies. Open black triangles indicate the total population, while green filled squares depict the background subtracted population. Each distribution was fitted with a power law (blue dotted line), between the limits indicated by horizontal black dashed lines. |
For photometry obtained with wide enough FOVs, the population of GCs detected around a galaxy is expected to drop off to a constant value at sufficiently extended radial positions from the galactic center. This constant number will represent foreground stars and faint background galaxies, and the projected surface density of GCs as a function of galactocentric distance will give the radial distribution of GC candidates. In practice, given the rather limited FOV, we adopted the outermost bin of the radial distribution as background. Starting from the center of the images and considering only detected GC candidates brighter than the 80% completeness magnitude in the i filter, we grouped GC candidates and contaminants into concentric circular annuli, subtracted the contamination in each annulus, and then divided by the effective area over which GC candidates are distributed.
We fitted power laws, σGC = σ0rn, to the surface density profile of galaxies in our sample, where σGC is the number of GCs per square arcsecond and r is the projected radial distance. The fit was made for all GCSs in the fixed interval 40″ <r< 160″ (horizontal dashed line in Fig. 4), which avoids the central zone of incompleteness produced by saturation, ill-subtracted galaxy and possible dusty features (see Sect. 6). Results of the fit can be seen as dotted blue lines in Fig. 4 and in Table 5.
The richest GCSs, that is, NGC 3962, NGC 2271, and NGC 2865, follow a power law with index n ~ −2, as is the case for most giant ellipticals (e.g., Bassino et al. 2006). The galaxy that presents the larger deviation from the power law in the selected radial range is NGC 2865, which shows a small overabundance of GCs at log r ~ 1.95 (90″), which might be associated with its intricate shell system.
NGC 4240 and IC 4889 present very shallow GC profiles, probably an effect of the low number of GCs present in these systems. Particularly problematic is the case of IC 4889, where an abrupt jump in the cluster distribution is visible at r ~ 40″. IC 4889 not only possesses a poor cluster system, but it also is the galaxy with the shallowest observations of the set.
Finally, we note that the galaxies with fewer dusty features (NGC 2271 and NGC 4240, see Sect. 3) follow the power-law distribution inside the fit limit of 40″ more closely.
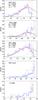 |
Fig. 5 GCLF for the five GCSs. Blue lines indicate the raw GCLF (dotted), the LF of the contamination (dashed), and the contamination-corrected GCLF (solid). Red lines indicate the fitted function (Eq. (4), dotted line) and its respective Gaussian. Vertical dashed black lines indicate the 80% and 50% completeness limits in i′ as obtained in Sect. 2.1.2. |
5. Luminosity functions and distances
Luminosity functions in the i′ band for the point sources in each galaxy field can be seen in Fig. 5. The background and foreground contamination was estimated using the WHDF and Besançon models as in Sect. 2.1.3. The background-corrected luminosity functions, that is, the functions for the globular cluster candidates, are depicted as well.
The inverted red arrows indicate the expected position of the turnover magnitude (TOM) of the globular cluster luminosity functions (GCLFs), assuming a universal value of  (Kundu & Whitmore 2001), transformed to Mi using Eq. (2) from Faifer et al. (2011), and distance moduli as given in Table 1.
For NGC 2271, NGC 2865, and NGC 3962, the contamination-subtracted GCLFs were modeled as the product of a Gaussian function with the completeness function (Eq. (3))![\begin{equation} \label{eq:gclf_eqn} \frac{\ud N}{\ud m}=\frac{a_0}{\sqrt{2\pi}\sigma_m}\exp{\left[\frac{(m-m_0)^2}{2\sigma_m^2}\right]}^{\frac{1}{2}}\left[1-\frac{\alpha(m-m_{50})}{\sqrt{1\! +\! \alpha^2(m\! -\! m_{50})^2}}\right], \end{equation}](/articles/aa/full_html/2015/05/aa25574-14/aa25574-14-eq186.png) (4)where m0 is the TOM and σm the width of the GCLF. The parameters for the completeness interpolation function are those derived in Sect. 2.1.2. Equation (4) was fitted using MPFIT, an implementation of nonlinear square fitting in IDL (Markwardt 2009). The luminosity functions were fitted down to the 50% completeness detection limit in i′ (Table 4), with the exception of NGC 2865, for which the fit was made using magnitudes down to the 80% limit, given the large number of sources at i> 25.5, which are probably faint background galaxies that escaped the point-source criteria defined in Sect. 2.1.
(4)where m0 is the TOM and σm the width of the GCLF. The parameters for the completeness interpolation function are those derived in Sect. 2.1.2. Equation (4) was fitted using MPFIT, an implementation of nonlinear square fitting in IDL (Markwardt 2009). The luminosity functions were fitted down to the 50% completeness detection limit in i′ (Table 4), with the exception of NGC 2865, for which the fit was made using magnitudes down to the 80% limit, given the large number of sources at i> 25.5, which are probably faint background galaxies that escaped the point-source criteria defined in Sect. 2.1.
NGC 3962 is the only galaxy where the completeness limit is well beyond the TOM, therefore we fit m0, σm and the Gaussian amplitude, a0 only for this galaxy. For NGC 2271 and NGC 2865, the TOM was fixed to its expected value based on its SBF distance (Tonry et al. 2001), and only σm and a0 were fit. The results of the fit for these three galaxies are listed in Table 7.
Only the case of NGC 3962 provides material to discuss its distance based on its GCLF. The distance modulus derived from the TOM position is 32.47 ± 0.20, while the value of Tonry et al. (2001), assumed throughout this paper, which is based on SBF measurements, is 32.74 ± 0.40. Even though they agree within the erros, the GCLF based distance is significantly lower than the SBF distance. If the SBF distance were the correct one, this would imply a slightly brighter TOM, TOMi = −8.24, instead of the expected −7.97.
As discussed in Sect. 3, a possible explanation for the absence of a clear separation between the color peaks in NGC 3962 is the presence of an intermediate-age population, but intermediate-age populations have exactly the opposite effect, producing fainter TOMs (e.g. Richtler 2003), also even though metallicity is expected to have an influence on the TOM, this is minimized when using I-band observations (e.g., Rejkuba 2012). A brighter TOM agrees with Blakeslee & Tonry (1996), who found evidence that the TOM varies with environment, with low-density galaxies having a brighter TOM (see also Villegas et al. 2010). A larger sample of IEs with deep enough observations would be necessary to confirm this.
The radial profiles in Fig. 4 indicate that the density of GCs quickly drops to values close to zero within the FOV, therefore, we did not attempt to extrapolate the total number of clusters, NGC, to obtain the fraction outside the FOV. The total number of GCs is then simply derived from the Gaussian fitted to the GCLF. Where no fitting was attempted (NGC 4240 and IC 4889), the total number of GCs was estimated by doubling the number of detected clusters above the TOM. The GCLF in NGC 4240 differs from the expected shape close to a Gaussian, with a large number of very faint sources. Given the old age of the galaxy (Sect. 1.1) and the lack of evidence from the color maps of a recent meger event (Sect. 6), these are probably a residual contamination from background galaxies and not a faint young population of clusters. A similar GCLF is seen in NGC 3377, as shown by Cho et al. (2012).
The total number of GCs for the five galaxies is provided in Table 7.
6. Galaxy surface brightness and colors
Surface brightness profiles of the galaxies were measured by ellipse fitting using the IRAF task ELLIPSE. All the other objects in each galaxy field were initially masked using the segmentation image produced by SEXTRACTOR, but additional regions (extended halos of bright stars, chip defects, etc.) were interactively masked during the ELLIPSE execution. After the regions to be masked were established, ELLIPSE was run a second time, fixing the center of the ellipses as the mean central value of the ellipses with semi-major axes between 30 and 300 pixels. Sky brightness was calculated using the unmasked pixels outside the last measured isophote, taking the robust mean (Beers et al. 1990) of 40 random samples containing 800 sky pixels each. The uncertainty in the sky value was taken as the dispersion of these 40 sky measurements. Photometric calibration was made with the same equations as the point source photometry (Table 3), correcting for Galactic extinction following the dust maps of Schlafly & Finkbeiner (2011).
The results from the ellipse fitting are presented in Appendix B. The errors in the g′ and i′ surface brightness profiles come from the sum in quadrature of the rms scatter in the intensity from the ellipse fitting and the uncertainty on the sky value. The surface brightness is given as function of the geometric mean radius,  , where a is the fitted ellipse major axis and ϵ its ellipticity.
Color maps were also generated for each galaxy to detect color anomalies related to dust and possible past mergers.
NGC 2271 shows a flat color profile in the inner ~30″ along the major axis, with a noticeable color gradient at larger radius (Fig. A.1). This is the normal behavior for early-type galaxies (e.g., La Barbera et al. 2012) and is compatible with the negligible age and metalicity gradients found by Reda et al. (2007) inside 0.5Re. No dusty features are visible.
Figure A.2 (left panel) shows the color map of NGC 2865. NGC 2865 is widely considered as a merger remnant (Hau et al. 1999). The right panel shows the galaxy surface brightness map with the same scale. The large of number of shells, bluer than the galaxy body, have been discussed elsewhere (Malin & Carter 1983; Fort et al. 1986). We here emphasize a very narrow ~20″ long and ~1.5″ wide stream (white box in Fig. A.2), within the structure labeled “jet” in Fort et al. (1986; their Fig. 3), pointing in projection directly to the galaxy center. Its blue color together with the large shell at the exact opposite side of the galaxy probably makes it part of the same accretion process that produced the shells, although these very narrow radial features are not reproduced by simulations (e.g., Hernquist & Quinn 1987; Bílek et al. 2015), which instead show fan-like structures.
Figure A.3 shows the g − i color map for NGC 3962. It shows the same structures as were detected by Buson et al. (1993) using Hα imaging. First, there is an extended, slightly off-centered arc-like structure about 15″ from the galaxy center, with redder color than the underlying galaxy light. The SAM images (Fig. A.3, right panel) also show a central elongated component, misaligned with the major and minor axis of the galaxy. Ionized gas is now commonly thought to be of external origin, especially for massive, round ellipticals (e.g. Sarzi et al. 2006), so even though the large scale structure of the galaxy does not reveal any evidence for past accretion, as indicated by the very low tidal parameter measured by Tal et al. (2009), the inner color structure might indicate an older merger.
NGC 4240 shows a flatter color profile (Fig. A.4), similar to the one measured on the field elliptical NGC 7507 (Salinas et al. 2012). This agrees with the shallow age and metallicity gradients found by Reda et al. (2007). A notable feature is the Δ(g − i) ~ 0.15 color difference for the inner ~15″ between the southern and northern sections. Even though one would be tempted to relate it to the lop-sided rotation curve found by Hau & Forbes (2006) on the same scales, that rotation pattern was found roughly along the east-west axis. Another feature is a red plume of ~15″ in the SE direction (indicated with a black arrow in Fig. A.4). Both features were not detected by Reda et al. (2004).
IC 4889 shows a large spiral dusty feature (Fig. A.5), very similar to the one in NGC 3962. The unphysically red external halo is remarkable. Despite our efforts of understanding any problems with these images, we were unable to pinpoint the origin for the very flat i profile.
7. Discussion
7.1. Specific frequency of clusters in low- and high-density environments
The globular cluster specific frequency, SN, defined by Harris & van den Bergh (1981) as 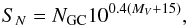 (5)connects the luminosity of a galaxy with its globular cluster population in an attempt to measure how efficient the globular cluster formation is compared to star formation. In Eq. (5), NGC is the total number of globular clusters in a galaxy, and MV is its absolute V magnitude.
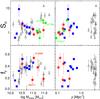 |
Fig. 6 Specific frequency (upper panels) and globular cluster red fraction (lower panels) as a function of stellar mass and the density parameter of Tully (1988). Red symbols represent our sample, while blue squares are taken from the sample of Cho et al. (2012). Black open triangles are the results from the ACSVCS (Peng et al. 2008), while the green filled circles are the five additional IEs described in the text. |
We obtained SN values for our sample using NGC as obtained from the GCLF analysis in Sect. 5. Figure 6 (upper panel) contains a comparison between our results with the sample of Cho et al. (2012) of ten low-density early-type galaxies and galaxies from the ACS Virgo Cluster Survey (ACSVCS, Peng et al. 2008). Additionally, we include the SN of five more isolated or low-density ellipticals, NGC 3585, NGC 5812 (Lane et al. 2013), NGC 7507 (Caso et al. 2013), NGC 720 (Kartha et al. 2014) and NGC 7796 (Richtler et al. 2015).
Figure 6 (upper left panel) presents SN as a function of stellar mass. Stellar masses for each galaxy in our sample and in the sample of Cho et al. (2012) were derived using homogeneous Ks apparent magnitudes taken from the 2MASS Extended Source Catalog (Jarrett et al. 2003). K-band luminosities were transformed into stellar masses by using the Hubble-type dependent mass-to-light ratios from Spitler et al. (2008), which are based on population models of Bruzual & Charlot (2003). Stellar masses for the ACSVCS galaxies were taken directly from Peng et al. (2008). Distances for the ACSVCS galaxies come from the recalibrated surface brightness fluctuations measurements given by Blakeslee et al. (2009).
Isolated ellipticals have a low SN, scattered around SN ~ 1.5, although there is a trend in the 10.5 < log M⋆< 11.4 in the sense that less massive galaxies have SN closer to 2, while more massive galaxies are clustered around ~1. A Spearman’s rank correlation test gives a coefficient of −0.74, with a two-sided significance of 0.002, indicating a high correlation. Considering a similar mass range, the opposite trend is seen for the Virgo GCSs (already discussed by Peng et al. 2008). IEs with log M⋆> 11.4 show a diverse behavior, while NGC 3962 follows the trend of less massive galaxies, NGC 720 (SN = 3 ± 0.2, Kartha et al. 2014) and NGC 7796 (SN = 2.5 ± 0.5, Richtler et al. 2015) show an increased SN, although still lower than Virgo ellipticals of similar mass.
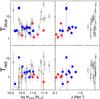 |
Fig. 7 T-parameters (see text) as function of stellar mass and density parameter. Symbols are the same as in Fig. 6. |
The upper right panel of Fig. 6 shows now the SN as a function of the density parameter of Tully (1988). Galaxies in both low-density and high density environments share a broad range of SN, but again a trend within the low-density sample can be seen, where the most isolated galaxies (ρ ~ 0.1) have even lower SN, although this trend is almost totally driven by NGC 7507, the galaxy with the lowest density in the sample and with a surprisingly low SN (Caso et al. 2013). Note that several galaxies in Virgo lack a density parameter, as well as NGC 4240 and NGC 7796, which are not included in the Tully (1988) catalog because of their distances.
The SN depends on MV, which in turn strongly depends on age. Given that isolated ellipticals are considered late accretors that span a wide range of ages (e.g., Kuntschner et al. 2002; Reda et al. 2007), a true comparison with cluster ellipticals, which are believed to be homogeneously old, is hampered. To compare galaxies with possible different stellar populations, it is relevant to use the TN parameter introduced by Zepf & Ashman (1993), 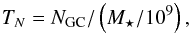 (6)where the number of GCs is normalized to the stellar mass, M⋆, instead of MV. Additionally, the parameters Tblue and Tred can be defined, where the number of blue and red clusters are used instead of the total number, NGC. The amount of blue and red clusters is obtained using the red fractions measured in Sect. 3.
Figure 7 shows Tblue and Tred for our sample together with the same galaxies as were used in the SN comparison; the sample of Cho et al. (2012) of low-density environment early-type galaxies, and early-type galaxies from the ACSVCS (Peng et al. 2006, 2008). Colors and symbols are the same as in Fig. 6.
The trend with mass seen for the SN is not seen for Tblue, although the more massive isolated ellipticals still show significantly lower values than Virgo ellipticals of the same mass. The Tred values for our sample are systematically lower than the sample of Cho et al. (2012) and the ACSVCS sample in the range of masses described.
Finally, the right panels of Fig. 7 shows the behavior of the Tred and Tblue parameters as function of the density parameter. The trend seen for SN in isolated and low-density galaxies is repeated for Tblue, although less clearly. No clear trend is seen for Tred, although if we only consider our sample without the galaxies of Cho et al. (2012), it is clear that the Tred values for isolated ellipticals span a narrow range close to 1 or lower, while Virgo ellipticals have higher values on average.
7.2. Red fractions of isolated ellipticals
The proportion between blue and red clusters in a GCS is commonly measured using the red fraction of GCs (e.g., Peng et al. 2006), that is, the fraction of red clusters compared to the entire population in a GCS. Red fractions are an important tool for distinguishing between the possible scenarios of GCS formation.
The red fractions for our galaxies derived in Sect. 3 are presented in Fig. 6 together with red fractions for GCSs belonging to the ACSVCS (Peng et al. 2008) and the ten low-density ellipticals from Cho et al. (2012). The red fractions of Peng et al. (2008) are an updated version of the results presented by Peng et al. (2006), where red fractions were corrected for the radial incompleteness that affects mostly the higher-luminosity ellipticals in their sample. Uncertainties were adopted from the original results of Peng et al. (2006) since updated values are not given by Peng et al. (2008). Uncertainties for the red fractions measured by Cho et al. (2012) are also not given in their paper.
The red fractions of Virgo galaxies present the same non-monotonic behavior seen in Peng et al. (2008, their Fig. 8) as a function of Mz instead of stellar mass. Red fractions increase from lower mass galaxies up to a maximum around log M⋆ ~ 11, beyond which red fractions experience a turnover. Interestingly, the somewhat lower red fractions for low-density ellipticals claimed by Cho et al. (2012) are not seen; in the 10 < log M⋆< 11 range the sample of Cho et al. (2012) is indistinguishable from the Virgo galaxies. The reason that we cannot see lower red fractions for the sample of Cho et al. (2012) compared to the ACSVCS is probably that a) Cho et al. (2012) did not use the red fractions corrected by aperture given by Peng et al. (2008), but used the uncorrected fractions from Peng et al. (2006), and that b) the comparison of red fractions was made as a function of MB instead of stellar mass; for the same stellar mass, low-density ellipticals will appear brighter in the optical because they are on average younger than cluster ellipticals, so the claimed lower red fractions are only a population effect on the galaxy luminosities and not an intrinsic difference between the GCSs.
However, the galaxies presented in this paper appear to systematically show lower fractions than the Virgo galaxies at similar stellar mass, with the exception of IC 4889. IC 4889 has the shallowest observations in our sample, thus the red fraction obtained for its GCS would appear to be uncertain, which would account for its unusually high value. It is important to note that just like the values for the total number of GCs, the fr are not corrected for unaccounted clusters outside the FOV, based on the quick decline of the GC density profiles (Sect. 4). If anything, wider field studies of these isolated galaxies will reveal even lower red fractions. We therefore conclude that red fractions in isolated ellipticals are equal to or possibly lower than the values for high-density ellipticals.
Recently, Tonini (2013) introduced a model of GC formation based on hierarchical merging and the mass-metallicity relation for galaxies. An important feature of the model is the ability to make predictions for galaxies with rich and poor accretion histories, where poor-accretion galaxies end up with dominant red GC populations. If we associate galaxies with poor accretion histories to present-day isolated ellipticals, our results strongly disagree with this model and are in line with the results of Kartha et al. (2014) for lenticular galaxies. Additionally, it would be inconsistent with models proposing an accreted origin from dwarf galaxies for the blue population (e.g., Côté et al. 1998).
A strong argument against the accreted origin of blue clusters is the correlation between the peak color of the blue clusters and the luminosity of the parent galaxy (e.g., Larsen et al. 2001; Strader et al. 2004), which is not expected under an accretion scenario. Our finding of a dominant blue peak despite the likely absence of a rich accretion history favors in situ formation for GCs, where then the color bimodality would instead be explained by a nonlinear color-metallicity relation in GCs (e.g., Yoon et al. 2006, 2011).
7.3. Color peaks
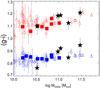 |
Fig. 8 Black stars indicate the red and blue peaks of the color distribution of GCs in our sample. Squares indicate galaxies from the sample of Cho et al. (2012), while open trinagles are the values from the ACSVCS (Peng et al. 2008). |
The mean colors, or color peaks, of the blue and red GC subpopulations have both been found to be functions of the parent galaxy luminosity (e.g., Larsen et al. 2001; Strader et al. 2004), which suggests an intimate connection between galaxy and GC enrichment history.
To compare our results again with the samples of Cho et al. (2012) and Peng et al. (2008), we transformed the (g − z) colors from these studies into (g − i) using the relation obtained by Usher et al. (2012) for 169 bona fide clusters in NGC 4365,  (7)Figure 8 shows that on average both peak magnitudes in our sample are redder, by a small but significant amount, than the Cho et al. (2012) and Peng et al. (2008) peak magnitudes. This is in contrast to the results of Cho et al. (2012), who found that the peak magnitudes for their GCS were slightly bluer than the Virgo galaxies from Peng et al. (2008), which also fits into the picture of isolated or field ellipticals having on average younger stellar populations. Because our redder values go against this intuition, we believe our data may be affected by an error in the zeropoint photometry. We therefore restrict the analysis to an internal comparison between the galaxies in our sample.
Even though for the blue clusters a slope may be more noticeable, this is dominated by the most massive (NGC 3962), and least massive galaxies (NGC 4240) of our sample, which are precisely those for which color bimodality is not totally supported (see Sect. 3). Moreover, the mass-peak color relation for blue clusters is expected to be even less pronounced for low-density environments (Strader et al. 2004). We conclude that no relation with galaxy mass is discernible for our sample, mostly limited by the narrow range of masses studied.
7.4. Ultra-compact dwarfs in NGC 3962?
The CMD of point sources around NGC 3962 shows a clear extension of the GC sequence above the selected brighter limit (Fig. 2). Seventeen point sources brighter than i = 21.24 (Mi = −11.5 at the galaxy’s distance) and with 0.8 < (g − i)0< 1.4 can be seen. In this same range of luminosity and colors only about three point sources are expected based on the comparison field (the WHDF, Fig. 2) and the Galactic model of Robin et al. (2003). Stellar systems of this brightness have commonly been labeled ultra-compact dwarfs (UCDs, e.g., Drinkwater et al. 2000) because they have no counterparts in the Local Group.
Even though some of the low-luminosity UCD candidates may just be bright GCs, given the uncertainty of 0.4 mag in the surface brightness distance modulus measured by Tonry et al. (2001), the correspondence between the expected and measured peak of the GCLF in NGC 3962 (Fig. 5) shows that the true distance cannot be too different, and hence most of these are genuinely brighter than the expected brightest GCs.
UCDs have been found mostly in galaxy groups and clusters (e.g., Mieske et al. 2008; Brodie et al. 2011), with formation channels mostly appealing to dynamical effects common in high-density environments (e.g., Hilker et al. 1999). If spectroscopically confirmed, the UCDs in NGC 3962 would be the first around an isolated elliptical, confirming that the formation of these objects is not restricted to high-density environments, following the finding of one UCD around the field spiral galaxy M 104 (Hau et al. 2009).
8. Summary and conclusions
We have studied the GCSs of five isolated elliptical galaxies, NGC 2271, NGC 2865, NGC 3962, NGC 4240, and IC 4889, using Gemini-S/GMOS gi imaging. Our main results are as follows:
-
The GMM analysis indicates clear bimodality for three out of fivegalaxies, while the two remaining show very short peakdistances, making their bimodality less clear. In general, colorbimodality is a common phenomenon down to the most isolatedelliptical galaxies.
-
The specific frequency of isolated ellipticals, SN, is close to 1.5 regardless of the galaxy mass. In the range 10.5 < log M⋆ < 11.4 a small correlation can be seen, in the sense that more massive isolated ellpiticals have smaller SN, but for higher masses, larger SN are measured.
-
The conclusion of Cho et al. (2012) that galaxy mass is the main ruler of the properties of a GCS stems from the narrow range of masses used in their sample, which is biased toward low-luminosity galaxies. For galaxies with stellar masses log M⋆ > 11, environment, and not mass, has the highest impact in determining some of the global properties (e.g., specific frequencies) of the GCSs.
-
The red fractions show no significant difference to the fractions seen in ellipticals in Virgo, making an accreted origin for the blue clusters doubtful. The slightly lower red fractions found by Cho et al. (2012) are a stellar population effect on the galaxy luminosities and are not intrinsic to the GCSs.
The last point assumes that isolated ellipticals can be connected to poor-accretion history galaxies found in cosmological simulations. Even though many isolated ellipticals show signs of recent mergers, to acquire knowledge of the entire accretion history, that is, to establish whether present-day isolated ellipticals have been isolated throughout their lifetimes, is more difficult. As shown by Cooper et al. (2013), the outer surface brightness profiles of high- and low-density galaxies are expected to be remarkably different given their different accretion histories. The study of the outer surface brightness profiles of isolated ellipticals as proxy of their accretion histories will be the subject of forthcoming publications.
Online material
Appendix A: Color maps
g − i color maps are given for all five galaxies. Each panel has a different angular scale, appropriate to indicate relevant color features in each galaxy. For all figures north is up, east to the left.
 |
Fig. A.1 NGC 2271 color map. |
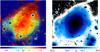 |
Fig. A.2 Left panel: g − i color map of NGC 2865. Right panel: g surface brightness map of NGC 2865. Both figures have the same size and scale. The black/white boxes indicate the radial feature discussed in the text. |
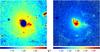 |
Fig. A.3 g − i color map for the central parts of NGC 3962. Left panel: Gemini/GMOS map, 1′ aside. The central blue area is due to detector saturation. Right panel: SOAR/SAM color map, 30′′aside. Albeit with lower S/N, it shows details that are not visible in the Gemini image because of saturation. |
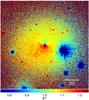 |
Fig. A.4 NGC 4240 color map. |
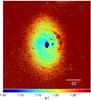 |
Fig. A.5 IC 4889 color map. |
Appendix B: Surface brightness profiles
g and i surface brightness profiles are given for each galaxy as measured with iraf/ellipse. The indicated radii are the mean geometric radii of each fitted ellipse. Radii are given in arcseconds, the surface brightness in mag/arcsec2.
NGC 2271 surface photometry.
NGC 2865 surface photometry.
NGC 3962 surface photometry.
NGC 4240 surface photometry.
IC 4889 surface photometry.
Acknowledgments
We thank the anonymous referee for fast and valuable feedback on our manuscript. R.S. thanks Karla Álamo-Martínez, Terry Bridges, Favio Faifer and especially Chiara Tonini for useful discussions. R.S. also thanks Andrei Tokovinin for his assistance during and after the SOAR/SAM observations. T.R. acknowledges financial support from FONDECYT project No. 1100620 and from the BASAL Centro de Astrofísica y Tecnologías Afines (CATA) PFB-06/2007. R.R.L. acknowledges financial support from FONDECYT project No. 3130403. Partly based on observations obtained at the Southern Astrophysical Research (SOAR) telescope, which is a joint project of the Ministério da Ciência, Tecnologia, e Inovação (MCTI) da República Federativa do Brasil, the US National Optical Astronomy Observatory (NOAO), the University of North Carolina at Chapel Hill (UNC), and Michigan State University (MSU).
References
- Alamo-Martínez, K. A., West, M. J., Blakeslee, J. P., et al. 2012, A&A, 546, A15 [NASA ADS] [CrossRef] [EDP Sciences] [Google Scholar]
- Annibali, F., Bressan, A., Rampazzo, R., Zeilinger, W. W., & Danese, L. 2007, A&A, 463, 455 [NASA ADS] [CrossRef] [EDP Sciences] [Google Scholar]
- Ashman, K. M., & Zepf, S. E. 1992, ApJ, 384, 50 [NASA ADS] [CrossRef] [Google Scholar]
- Ashman, K. M., Bird, C. M., & Zepf, S. E. 1994, AJ, 108, 2348 [NASA ADS] [CrossRef] [Google Scholar]
- Bassino, L. P., Faifer, F. R., Forte, J. C., et al. 2006, A&A, 451, 789 [NASA ADS] [CrossRef] [EDP Sciences] [Google Scholar]
- Beasley, M. A., Baugh, C. M., Forbes, D. A., Sharples, R. M., & Frenk, C. S. 2002, MNRAS, 333, 383 [NASA ADS] [CrossRef] [MathSciNet] [Google Scholar]
- Beers, T. C., Flynn, K., & Gebhardt, K. 1990, AJ, 100, 32 [NASA ADS] [CrossRef] [Google Scholar]
- Bertin, E., & Arnouts, S. 1996, A&AS, 117, 393 [NASA ADS] [CrossRef] [EDP Sciences] [Google Scholar]
- Bílek, M., Ebrová, I., Jungwiert, B., Jílková, L., & Bartošková, K. 2015, Can. J. Phys., 93, 203 [NASA ADS] [CrossRef] [Google Scholar]
- Blakeslee, J. P., & Tonry, J. L. 1996, ApJ, 465, L19 [NASA ADS] [CrossRef] [Google Scholar]
- Blakeslee, J. P., Jordán, A., Mei, S., et al. 2009, ApJ, 694, 556 [NASA ADS] [CrossRef] [Google Scholar]
- Blakeslee, J. P., Cho, H., Peng, E. W., et al. 2012, ApJ, 746, 88 [NASA ADS] [CrossRef] [Google Scholar]
- Brodie, J. P., & Strader, J. 2006, ARA&A, 44, 193 [NASA ADS] [CrossRef] [Google Scholar]
- Brodie, J. P., Romanowsky, A. J., Strader, J., & Forbes, D. A. 2011, AJ, 142, 199 [NASA ADS] [CrossRef] [Google Scholar]
- Brodie, J. P., Usher, C., Conroy, C., et al. 2012, ApJ, 759, L33 [NASA ADS] [CrossRef] [Google Scholar]
- Bruzual, G., & Charlot, S. 2003, MNRAS, 344, 1000 [NASA ADS] [CrossRef] [Google Scholar]
- Buson, L. M., Sadler, E. M., Zeilinger, W. W., et al. 1993, A&A, 280, 409 [NASA ADS] [Google Scholar]
- Caso, J. P., Richtler, T., Bassino, L. P., et al. 2013, A&A, 555, A56 [NASA ADS] [CrossRef] [EDP Sciences] [Google Scholar]
- Chies-Santos, A. L., Larsen, S. S., Cantiello, M., et al. 2012, A&A, 539, A54 [NASA ADS] [CrossRef] [EDP Sciences] [Google Scholar]
- Cho, J., Sharples, R. M., Blakeslee, J. P., et al. 2012, MNRAS, 422, 3591 [NASA ADS] [CrossRef] [Google Scholar]
- Clem, J. L., Van den Berg, D. A., & Stetson, P. B. 2008, AJ, 135, 682 [NASA ADS] [CrossRef] [Google Scholar]
- Cole, S., Aragon-Salamanca, A., Frenk, C. S., Navarro, J. F., & Zepf, S. E. 1994, MNRAS, 271, 781 [NASA ADS] [CrossRef] [Google Scholar]
- Collobert, M., Sarzi, M., Davies, R. L., Kuntschner, H., & Colless, M. 2006, MNRAS, 370, 1213 [NASA ADS] [CrossRef] [Google Scholar]
- Cooper, A. P., D’Souza, R., Kauffmann, G., et al. 2013, MNRAS, 434, 3348 [NASA ADS] [CrossRef] [Google Scholar]
- Côté, P., Marzke, R. O., & West, M. J. 1998, ApJ, 501, 554 [NASA ADS] [CrossRef] [Google Scholar]
- De Lucia, G., Springel, V., White, S. D. M., Croton, D., & Kauffmann, G. 2006, MNRAS, 366, 499 [NASA ADS] [CrossRef] [Google Scholar]
- de Souza, R. E., Gadotti, D. A., & dos Anjos, S. 2004, ApJS, 153, 411 [NASA ADS] [CrossRef] [Google Scholar]
- Dirsch, B., Richtler, T., Geisler, D., et al. 2003, AJ, 125, 1908 [NASA ADS] [CrossRef] [Google Scholar]
- Dressler, A. 1980, ApJ, 236, 351 [NASA ADS] [CrossRef] [Google Scholar]
- Drinkwater, M. J., Jones, J. B., Gregg, M. D., & Phillipps, S. 2000, PASA, 17, 227 [NASA ADS] [CrossRef] [Google Scholar]
- Durret, F., Slezak, E., & Adami, C. 2009, A&A, 506, 637 [NASA ADS] [CrossRef] [EDP Sciences] [Google Scholar]
- Elmegreen, B. G., Malhotra, S., & Rhoads, J. 2012, ApJ, 757, 9 [NASA ADS] [CrossRef] [Google Scholar]
- Faifer, F. R., Forte, J. C., Norris, M. A., et al. 2011, MNRAS, 416, 155 [NASA ADS] [Google Scholar]
- Fleming, D. E. B., Harris, W. E., Pritchet, C. J., & Hanes, D. A. 1995, AJ, 109, 1044 [NASA ADS] [CrossRef] [Google Scholar]
- Forbes, D. A., Brodie, J. P., & Grillmair, C. J. 1997, AJ, 113, 1652 [NASA ADS] [CrossRef] [Google Scholar]
- Forbes, D. A., Faifer, F. R., Forte, J. C., et al. 2004, MNRAS, 355, 608 [NASA ADS] [CrossRef] [Google Scholar]
- Fort, B. P., Prieur, J.-L., Carter, D., Meatheringham, S. J., & Vigroux, L. 1986, ApJ, 306, 110 [NASA ADS] [CrossRef] [Google Scholar]
- Fuse, C., Marcum, P., & Fanelli, M. 2012, AJ, 144, 57 [NASA ADS] [CrossRef] [Google Scholar]
- Gebhardt, K., & Kissler-Patig, M. 1999, AJ, 118, 1526 [NASA ADS] [CrossRef] [Google Scholar]
- Harris, W. E., & van den Bergh, S. 1981, AJ, 86, 1627 [NASA ADS] [CrossRef] [Google Scholar]
- Harris, W. E., Allwright, J. W. B., Pritchet, C. J., & van den Bergh, S. 1991, ApJS, 76, 115 [NASA ADS] [CrossRef] [Google Scholar]
- Harris, W. E., Whitmore, B. C., Karakla, D., et al. 2006, ApJ, 636, 90 [NASA ADS] [CrossRef] [Google Scholar]
- Harris, W. E., Harris, G. L. H., & Alessi, M. 2013, ApJ, 772, 82 [NASA ADS] [CrossRef] [Google Scholar]
- Hau, G. K. T., & Forbes, D. A. 2006, MNRAS, 371, 633 [NASA ADS] [CrossRef] [Google Scholar]
- Hau, G. K. T., Carter, D., & Balcells, M. 1999, MNRAS, 306, 437 [NASA ADS] [CrossRef] [Google Scholar]
- Hau, G. K. T., Spitler, L. R., Forbes, D. A., et al. 2009, MNRAS, 394, L97 [NASA ADS] [Google Scholar]
- Hernquist, L., & Quinn, P. J. 1987, ApJ, 312, 1 [NASA ADS] [CrossRef] [Google Scholar]
- Hilker, M., Infante, L., & Richtler, T. 1999, A&AS, 138, 55 [NASA ADS] [CrossRef] [EDP Sciences] [Google Scholar]
- Ibata, R. A., Gilmore, G., & Irwin, M. J. 1994, Nature, 370, 194 [NASA ADS] [CrossRef] [Google Scholar]
- Izenmann, A. J. 1991, Am. Stat. Assoc., 86, 205 [Google Scholar]
- Jarrett, T. H., Chester, T., Cutri, R., Schneider, S. E., & Huchra, J. P. 2003, AJ, 125, 525 [NASA ADS] [CrossRef] [Google Scholar]
- Kartha, S. S., Forbes, D. A., Spitler, L. R., et al. 2014, MNRAS, 437, 273 [NASA ADS] [CrossRef] [Google Scholar]
- Kundu, A., & Whitmore, B. C. 2001, AJ, 121, 2950 [NASA ADS] [CrossRef] [Google Scholar]
- Kuntschner, H., Smith, R. J., Colless, M., et al. 2002, MNRAS, 337, 172 [NASA ADS] [CrossRef] [Google Scholar]
- La Barbera, F., Ferreras, I., de Carvalho, R. R., et al. 2012, MNRAS, 426, 2300 [NASA ADS] [CrossRef] [Google Scholar]
- Lane, R. R., Kiss, L. L., Lewis, G. F., et al. 2011, A&A, 530, A31 [NASA ADS] [CrossRef] [EDP Sciences] [Google Scholar]
- Lane, R. R., Salinas, R., & Richtler, T. 2013, A&A, 549, A148 [NASA ADS] [CrossRef] [EDP Sciences] [Google Scholar]
- Larsen, S. S., Brodie, J. P., Huchra, J. P., Forbes, D. A., & Grillmair, C. J. 2001, AJ, 121, 2974 [NASA ADS] [CrossRef] [Google Scholar]
- Laurikainen, E., Salo, H., Buta, R., & Knapen, J. H. 2011, MNRAS, 418, 1452 [NASA ADS] [CrossRef] [Google Scholar]
- Liu, C., Peng, E. W., Jordán, A., et al. 2011, ApJ, 728, 116 [NASA ADS] [CrossRef] [Google Scholar]
- Madore, B. F., Freedman, W. L., & Bothun, G. D. 2004, ApJ, 607, 810 [NASA ADS] [CrossRef] [Google Scholar]
- Malin, D. F., & Carter, D. 1983, ApJ, 274, 534 [NASA ADS] [CrossRef] [Google Scholar]
- Markwardt, C. B. 2009, in Astronomical Data Analysis Software and Systems XVIII, eds. D. A. Bohlender, D. Durand, & P. Dowler, ASP Conf. Ser., 411, 251 [Google Scholar]
- McLaughlin, D. E., Harris, W. E., & Hanes, D. A. 1994, ApJ, 422, 486 [NASA ADS] [CrossRef] [Google Scholar]
- Metcalfe, N., Shanks, T., Campos, A., McCracken, H. J., & Fong, R. 2001, MNRAS, 323, 795 [NASA ADS] [CrossRef] [Google Scholar]
- Michard, R., & Prugniel, P. 2004, A&A, 423, 833 [NASA ADS] [CrossRef] [EDP Sciences] [Google Scholar]
- Mieske, S., Hilker, M., Jordán, A., et al. 2008, A&A, 487, 921 [NASA ADS] [CrossRef] [EDP Sciences] [Google Scholar]
- Muratov, A. L., & Gnedin, O. Y. 2010, ApJ, 718, 1266 [NASA ADS] [CrossRef] [Google Scholar]
- Niemi, S., Heinämäki, P., Nurmi, P., & Saar, E. 2010, MNRAS, 405, 477 [NASA ADS] [Google Scholar]
- Nigoche-Netro, A., Moles, M., Ruelas-Mayorga, A., Franco-Balderas, A., & Kjørgaard, P. 2007, A&A, 472, 773 [NASA ADS] [CrossRef] [EDP Sciences] [Google Scholar]
- Peng, E. W., Jordán, A., Côté, P., et al. 2006, ApJ, 639, 95 [NASA ADS] [CrossRef] [Google Scholar]
- Peng, E. W., Jordán, A., Côté, P., et al. 2008, ApJ, 681, 197 [NASA ADS] [CrossRef] [Google Scholar]
- Reda, F. M., Forbes, D. A., Beasley, M. A., O’Sullivan, E. J., & Goudfrooij, P. 2004, MNRAS, 354, 851 [NASA ADS] [CrossRef] [Google Scholar]
- Reda, F. M., Proctor, R. N., Forbes, D. A., Hau, G. K. T., & Larsen, S. S. 2007, MNRAS, 377, 1772 [NASA ADS] [CrossRef] [Google Scholar]
- Rejkuba, M. 2012, Ap&SS, 341, 195 [NASA ADS] [CrossRef] [Google Scholar]
- Rhode, K. L., & Zepf, S. E. 2001, AJ, 121, 210 [NASA ADS] [CrossRef] [Google Scholar]
- Rhode, K. L., Zepf, S. E., & Santos, M. R. 2005, ApJ, 630, L21 [NASA ADS] [CrossRef] [Google Scholar]
- Richtler, T. 2003, in Stellar Candles for the Extragalactic Distance Scale, eds. D. Alloin, & W. Gieren (Berlin: Springer Verlag), Lect. Notes Phys., 635, 281 [Google Scholar]
- Richtler, T. 2006, BASI, 34, 83 [Google Scholar]
- Richtler, T. 2013, in 370 Years of Astronomy in Utrecht, eds. G. Pugliese, A. de Koter, & M. Wijburg, ASP Conf. Ser., 470, 327 [Google Scholar]
- Richtler, T., Salinas, R., Misgeld, I., et al. 2011, A&A, 531, A119 [NASA ADS] [CrossRef] [EDP Sciences] [Google Scholar]
- Richtler, T., Bassino, L. P., Dirsch, B., & Kumar, B. 2012, A&A, 543, A131 [NASA ADS] [CrossRef] [EDP Sciences] [Google Scholar]
- Richtler, T., Salinas, R., Lane, R. R., Hilker, M., & Schirmer, M. 2015, A&A, 574, A21 [NASA ADS] [CrossRef] [EDP Sciences] [Google Scholar]
- Robin, A. C., Reylé, C., Derrière, S., & Picaud, S. 2003, A&A, 409, 523 [NASA ADS] [CrossRef] [EDP Sciences] [Google Scholar]
- Salinas, R., Richtler, T., Bassino, L. P., Romanowsky, A. J., & Schuberth, Y. 2012, A&A, 538, A87 [NASA ADS] [CrossRef] [EDP Sciences] [Google Scholar]
- Sánchez-Blázquez, P., Forbes, D. A., Strader, J., Brodie, J., & Proctor, R. 2007, MNRAS, 377, 759 [NASA ADS] [CrossRef] [Google Scholar]
- Sarzi, M., Falcón-Barroso, J., Davies, R. L., et al. 2006, MNRAS, 366, 1151 [NASA ADS] [CrossRef] [Google Scholar]
- Schlafly, E. F., & Finkbeiner, D. P. 2011, ApJ, 737, 103 [NASA ADS] [CrossRef] [Google Scholar]
- Schlegel, D. J., Finkbeiner, D. P., & Davis, M. 1998, ApJ, 500, 525 [NASA ADS] [CrossRef] [Google Scholar]
- Schuberth, Y., Richtler, T., Hilker, M., et al. 2012, A&A, 544, A115 [NASA ADS] [CrossRef] [EDP Sciences] [Google Scholar]
- Serra, P., & Oosterloo, T. A. 2010, MNRAS, 401, L29 [NASA ADS] [Google Scholar]
- Sikkema, G., Peletier, R. F., Carter, D., Valentijn, E. A., & Balcells, M. 2006, A&A, 458, 53 [NASA ADS] [CrossRef] [EDP Sciences] [Google Scholar]
- Smith, J. A., Tucker, D. L., Kent, S., et al. 2002, AJ, 123, 2121 [Google Scholar]
- Smith, R. M., Martínez, V. J., & Graham, M. J. 2004, ApJ, 617, 1017 [NASA ADS] [CrossRef] [Google Scholar]
- Spitler, L. R., Forbes, D. A., Strader, J., Brodie, J. P., & Gallagher, J. S. 2008, MNRAS, 385, 361 [NASA ADS] [CrossRef] [Google Scholar]
- Stetson, P. B. 1987, PASP, 99, 191 [NASA ADS] [CrossRef] [Google Scholar]
- Stetson, P. B. 1993, in Stellar Photometry – Current Techniques and Future Developments, eds. C. J. Butler, & I. Elliott, IAU Colloq., 136, 291 [Google Scholar]
- Stocke, J. T., Keeney, B. A., Lewis, A. D., Epps, H. W., & Schild, R. E. 2004, AJ, 127, 1336 [NASA ADS] [CrossRef] [Google Scholar]
- Strader, J., Brodie, J. P., & Forbes, D. A. 2004, AJ, 127, 3431 [NASA ADS] [CrossRef] [Google Scholar]
- Strader, J., Brodie, J. P., Spitler, L., & Beasley, M. A. 2006, AJ, 132, 2333 [NASA ADS] [CrossRef] [Google Scholar]
- Strader, J., Beasley, M. A., & Brodie, J. P. 2007, AJ, 133, 2015 [NASA ADS] [CrossRef] [Google Scholar]
- Tal, T., van Dokkum, P. G., Nelan, J., & Bezanson, R. 2009, AJ, 138, 1417 [NASA ADS] [CrossRef] [Google Scholar]
- Tokovinin, A., Cantarutti, R., Tighe, R., et al. 2010, PASP, 122, 1483 [NASA ADS] [CrossRef] [Google Scholar]
- Tokovinin, A., Tighe, R., Schurter, P., et al. 2012, in SPIE Conf. Ser., 8447 [Google Scholar]
- Tonini, C. 2013, ApJ, 762, 39 [NASA ADS] [CrossRef] [Google Scholar]
- Tonry, J. L., Dressler, A., Blakeslee, J. P., et al. 2001, ApJ, 546, 681 [NASA ADS] [CrossRef] [Google Scholar]
- Trancho, G., Miller, B. W., Schweizer, F., Burdett, D. P., & Palamara, D. 2014, ApJ, 790, 122 [NASA ADS] [CrossRef] [Google Scholar]
- Tully, R. B. 1988, Nearby galaxies catalog (CUP) [Google Scholar]
- Urrutia-Viscarra, F., Arnaboldi, M., Mendes de Oliveira, C., et al. 2014, A&A, 569, A97 [NASA ADS] [CrossRef] [EDP Sciences] [Google Scholar]
- Usher, C., Forbes, D. A., Brodie, J. P., et al. 2012, MNRAS, 426, 1475 [NASA ADS] [CrossRef] [Google Scholar]
- van Dokkum, P. G., Whitaker, K. E., Brammer, G., et al. 2010, ApJ, 709, 1018 [NASA ADS] [CrossRef] [Google Scholar]
- Villegas, D., Jordán, A., Peng, E. W., et al. 2010, ApJ, 717, 603 [NASA ADS] [CrossRef] [Google Scholar]
- Wehner, E. M. H., Harris, W. E., Whitmore, B. C., Rothberg, B., & Woodley, K. A. 2008, ApJ, 681, 1233 [NASA ADS] [CrossRef] [Google Scholar]
- Yoon, S.-J., Yi, S. K., & Lee, Y.-W. 2006, Science, 311, 1129 [NASA ADS] [CrossRef] [PubMed] [Google Scholar]
- Yoon, S.-J., Lee, S.-Y., Blakeslee, J. P., et al. 2011, ApJ, 743, 150 [NASA ADS] [CrossRef] [Google Scholar]
- Zepf, S. E., & Ashman, K. M. 1993, MNRAS, 264, 611 [NASA ADS] [CrossRef] [Google Scholar]
All Tables
All Figures
|
Fig. 1 Top panel: fraction of recovered stars after the artificial-star experiment in the i′ observations of NGC 4240. The dotted line is the fitted interpolation function (see Eq. (3)). The dashed blue lines indicate the 50% level of completeness. Middle panel: behavior of the ALLSTAR parameter sharp. Bottom panel: SEXTRACTOR stellarity index. In both panels artificial stars are indicated with black circles, while the real sources are plotted in red. The blue dashed lines indicate the point source criteria applied to the science data based on the artificial one. |
| In the text | |
|
Fig. 2 Color–magnitude diagrams for sources detected around the five galaxies plus the control field (bottom right). Small black dots indicate the resolved sources, while the large black dots are the point sources as determined in Sect. 2.1.2. Globular clusters are depicted in red, inside the magnitude and color limits explained in the text. The number of GC candidates stated for each galaxy is before any decontamination and within the FOV. Green triangles in the NGC 3962 panel indicate UCD candidates (see Sect. 7.4). |
| In the text | |
|
Fig. 3 Color histograms of the GCSs of the five target galaxies. The green dashed lines indicate the raw color distribution, the blue dotted line indicates the contamination in each field as determined in Sect. 2.1.3. The thick black lines show the background-corrected distributions. |
| In the text | |
|
Fig. 4 Radial distribution of globular clusters in the studied galaxies. Open black triangles indicate the total population, while green filled squares depict the background subtracted population. Each distribution was fitted with a power law (blue dotted line), between the limits indicated by horizontal black dashed lines. |
| In the text | |
|
Fig. 5 GCLF for the five GCSs. Blue lines indicate the raw GCLF (dotted), the LF of the contamination (dashed), and the contamination-corrected GCLF (solid). Red lines indicate the fitted function (Eq. (4), dotted line) and its respective Gaussian. Vertical dashed black lines indicate the 80% and 50% completeness limits in i′ as obtained in Sect. 2.1.2. |
| In the text | |
|
Fig. 6 Specific frequency (upper panels) and globular cluster red fraction (lower panels) as a function of stellar mass and the density parameter of Tully (1988). Red symbols represent our sample, while blue squares are taken from the sample of Cho et al. (2012). Black open triangles are the results from the ACSVCS (Peng et al. 2008), while the green filled circles are the five additional IEs described in the text. |
| In the text | |
|
Fig. 7 T-parameters (see text) as function of stellar mass and density parameter. Symbols are the same as in Fig. 6. |
| In the text | |
|
Fig. 8 Black stars indicate the red and blue peaks of the color distribution of GCs in our sample. Squares indicate galaxies from the sample of Cho et al. (2012), while open trinagles are the values from the ACSVCS (Peng et al. 2008). |
| In the text | |
|
Fig. A.1 NGC 2271 color map. |
| In the text | |
|
Fig. A.2 Left panel: g − i color map of NGC 2865. Right panel: g surface brightness map of NGC 2865. Both figures have the same size and scale. The black/white boxes indicate the radial feature discussed in the text. |
| In the text | |
|
Fig. A.3 g − i color map for the central parts of NGC 3962. Left panel: Gemini/GMOS map, 1′ aside. The central blue area is due to detector saturation. Right panel: SOAR/SAM color map, 30′′aside. Albeit with lower S/N, it shows details that are not visible in the Gemini image because of saturation. |
| In the text | |
|
Fig. A.4 NGC 4240 color map. |
| In the text | |
|
Fig. A.5 IC 4889 color map. |
| In the text | |
Current usage metrics show cumulative count of Article Views (full-text article views including HTML views, PDF and ePub downloads, according to the available data) and Abstracts Views on Vision4Press platform.
Data correspond to usage on the plateform after 2015. The current usage metrics is available 48-96 hours after online publication and is updated daily on week days.
Initial download of the metrics may take a while.