Free Access
Fig. 4
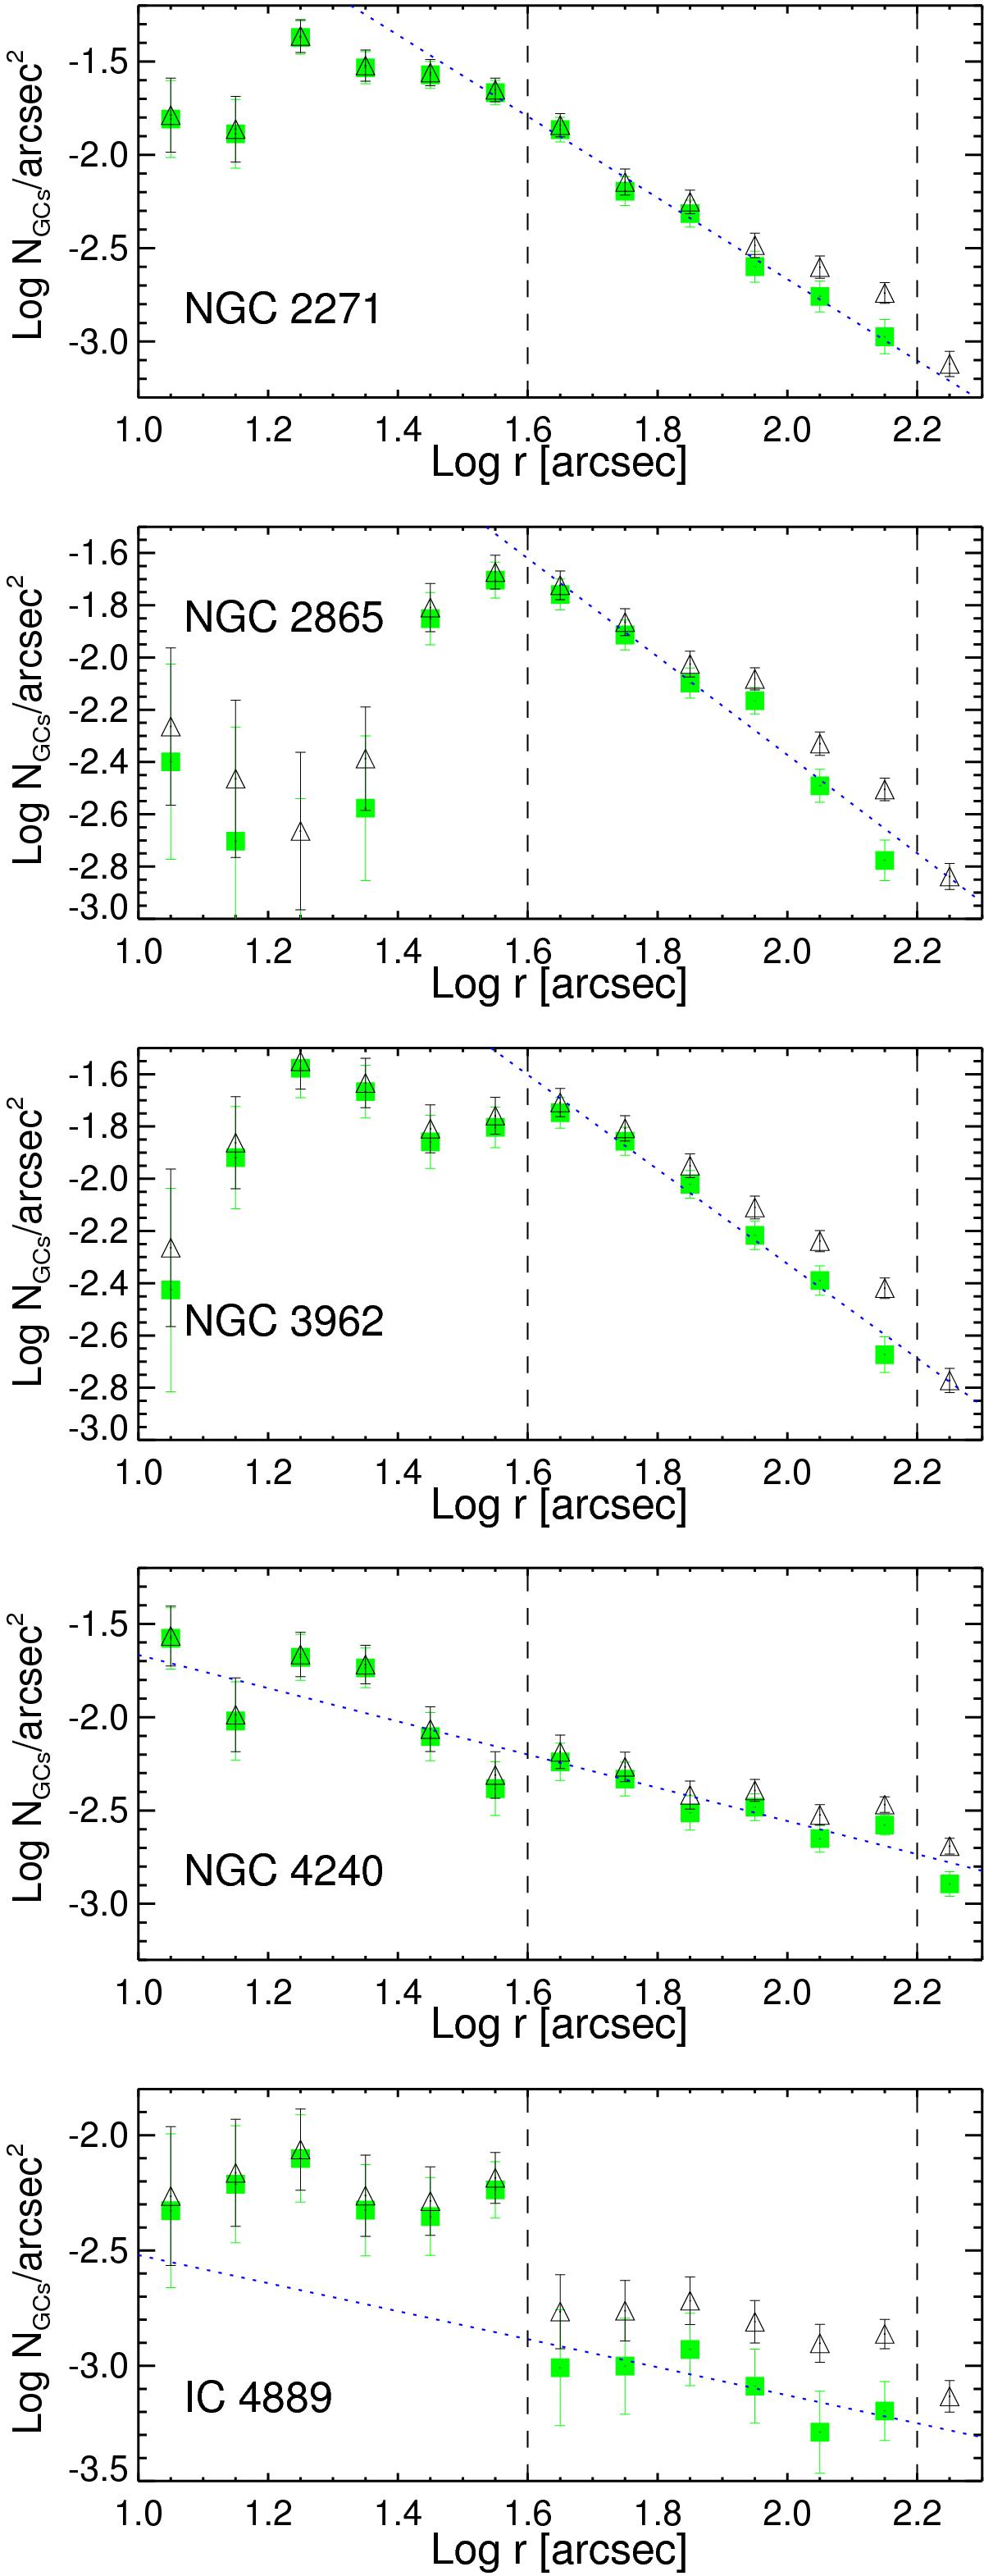
Radial distribution of globular clusters in the studied galaxies. Open black triangles indicate the total population, while green filled squares depict the background subtracted population. Each distribution was fitted with a power law (blue dotted line), between the limits indicated by horizontal black dashed lines.
Current usage metrics show cumulative count of Article Views (full-text article views including HTML views, PDF and ePub downloads, according to the available data) and Abstracts Views on Vision4Press platform.
Data correspond to usage on the plateform after 2015. The current usage metrics is available 48-96 hours after online publication and is updated daily on week days.
Initial download of the metrics may take a while.