Fig. 6
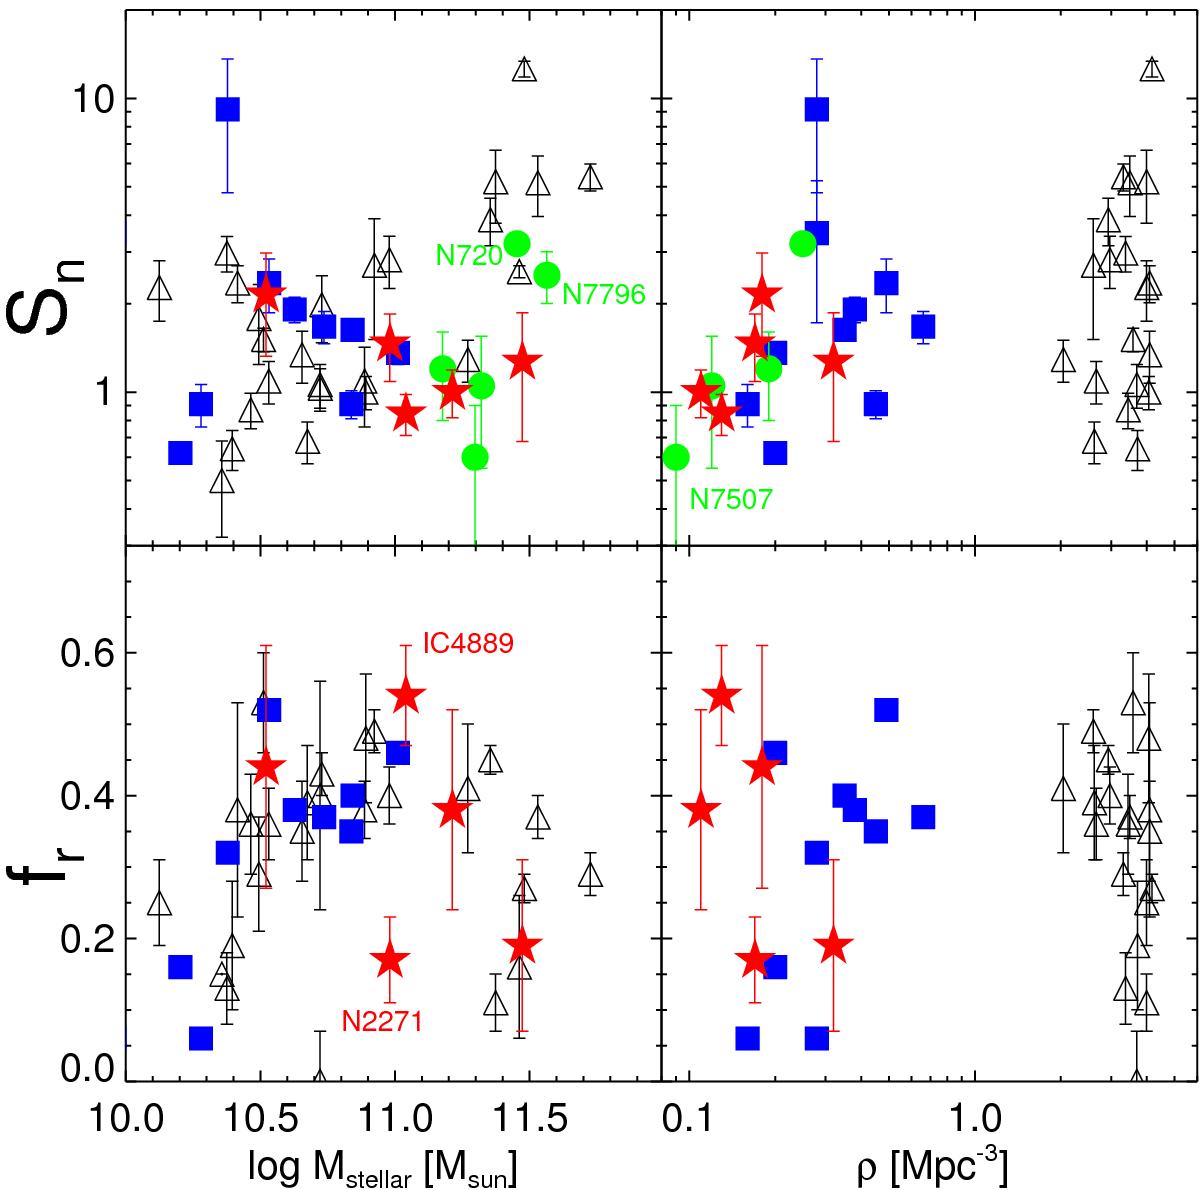
Specific frequency (upper panels) and globular cluster red fraction (lower panels) as a function of stellar mass and the density parameter of Tully (1988). Red symbols represent our sample, while blue squares are taken from the sample of Cho et al. (2012). Black open triangles are the results from the ACSVCS (Peng et al. 2008), while the green filled circles are the five additional IEs described in the text.
Current usage metrics show cumulative count of Article Views (full-text article views including HTML views, PDF and ePub downloads, according to the available data) and Abstracts Views on Vision4Press platform.
Data correspond to usage on the plateform after 2015. The current usage metrics is available 48-96 hours after online publication and is updated daily on week days.
Initial download of the metrics may take a while.