Fig. 5
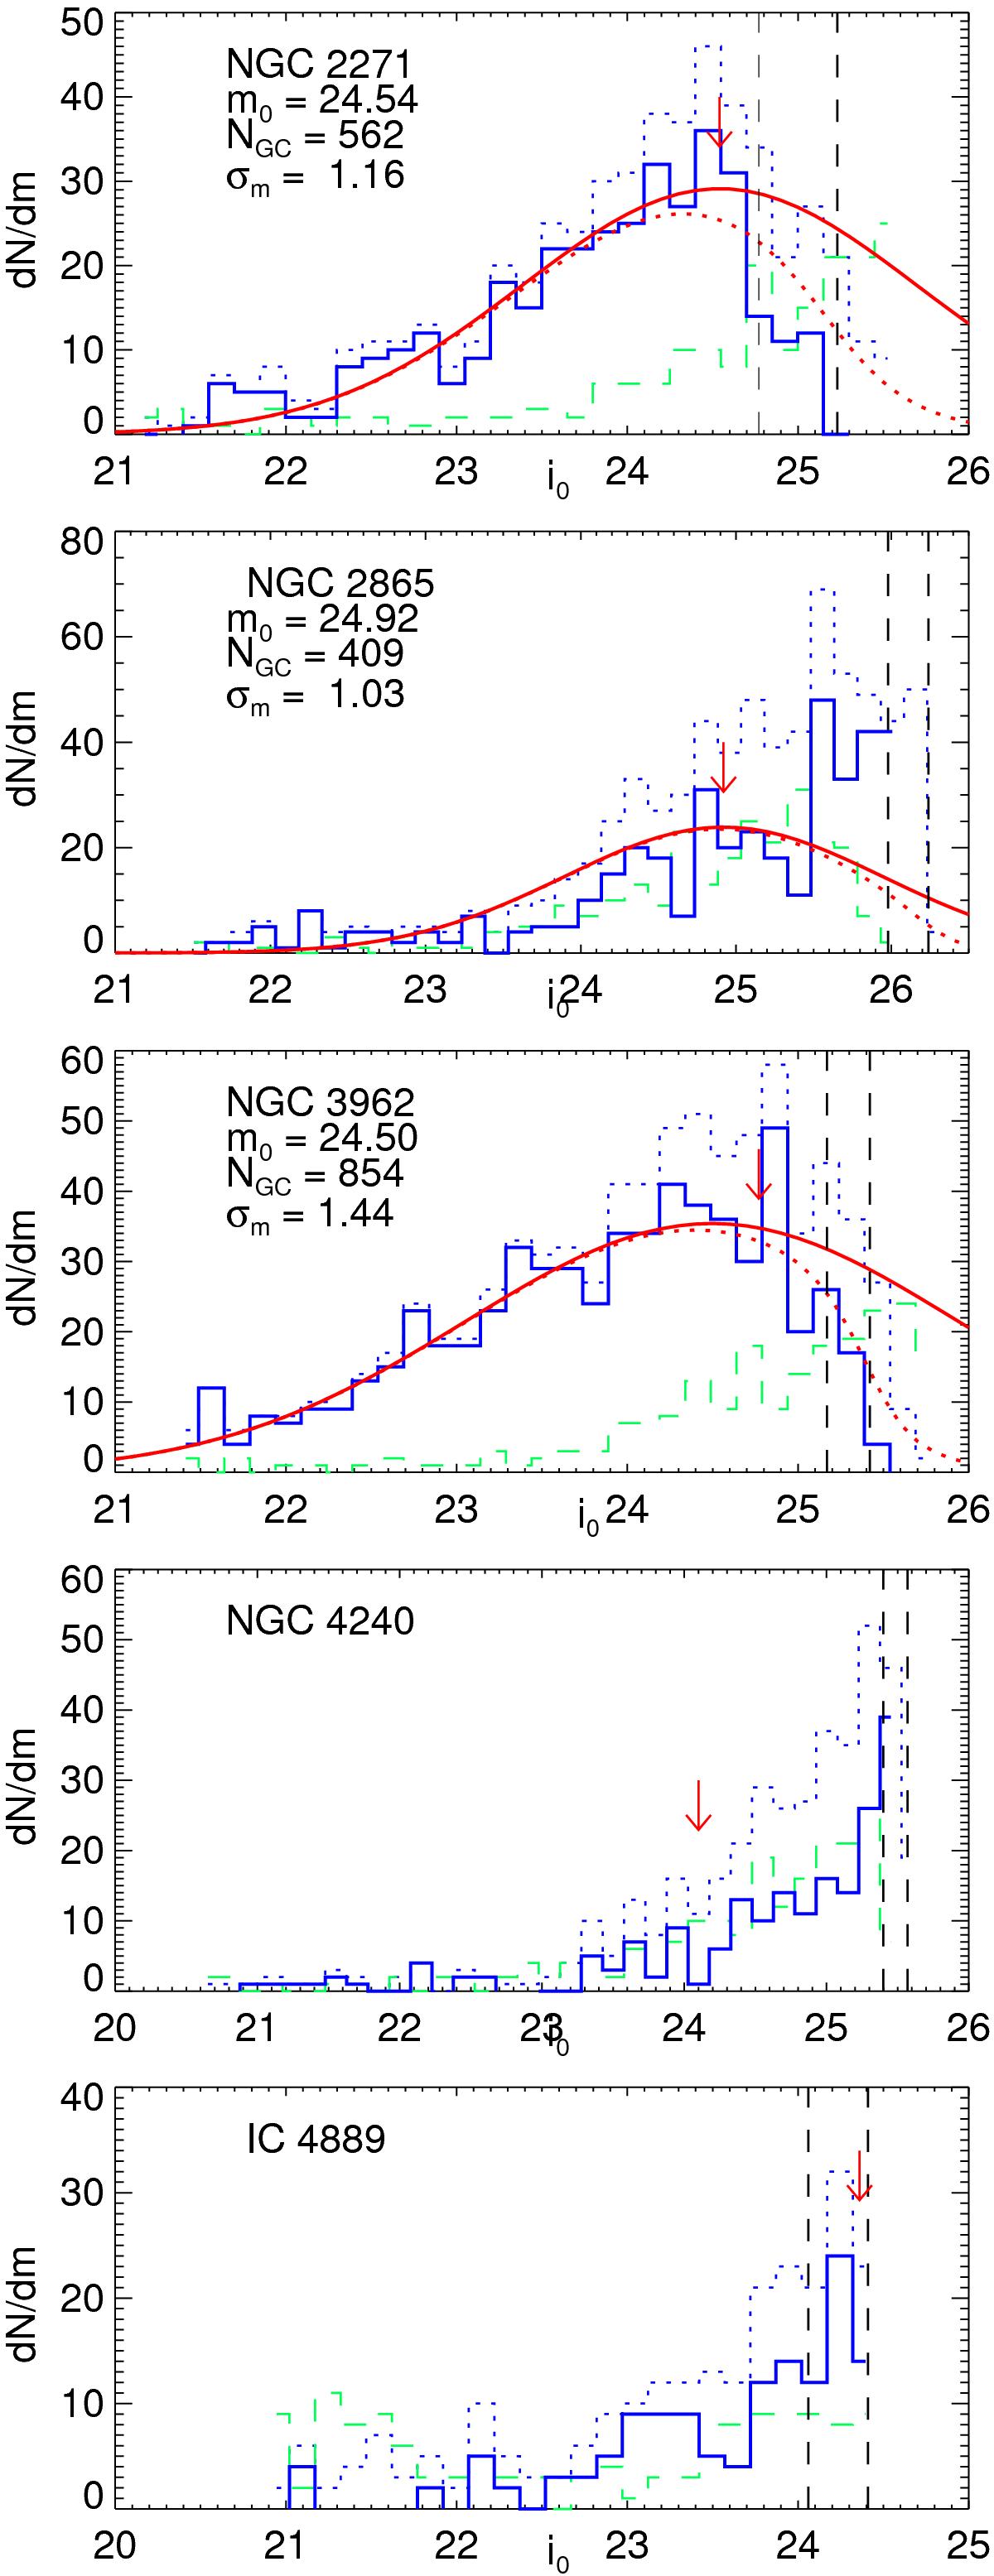
GCLF for the five GCSs. Blue lines indicate the raw GCLF (dotted), the LF of the contamination (dashed), and the contamination-corrected GCLF (solid). Red lines indicate the fitted function (Eq. (4), dotted line) and its respective Gaussian. Vertical dashed black lines indicate the 80% and 50% completeness limits in i′ as obtained in Sect. 2.1.2.
Current usage metrics show cumulative count of Article Views (full-text article views including HTML views, PDF and ePub downloads, according to the available data) and Abstracts Views on Vision4Press platform.
Data correspond to usage on the plateform after 2015. The current usage metrics is available 48-96 hours after online publication and is updated daily on week days.
Initial download of the metrics may take a while.