Fig. 2
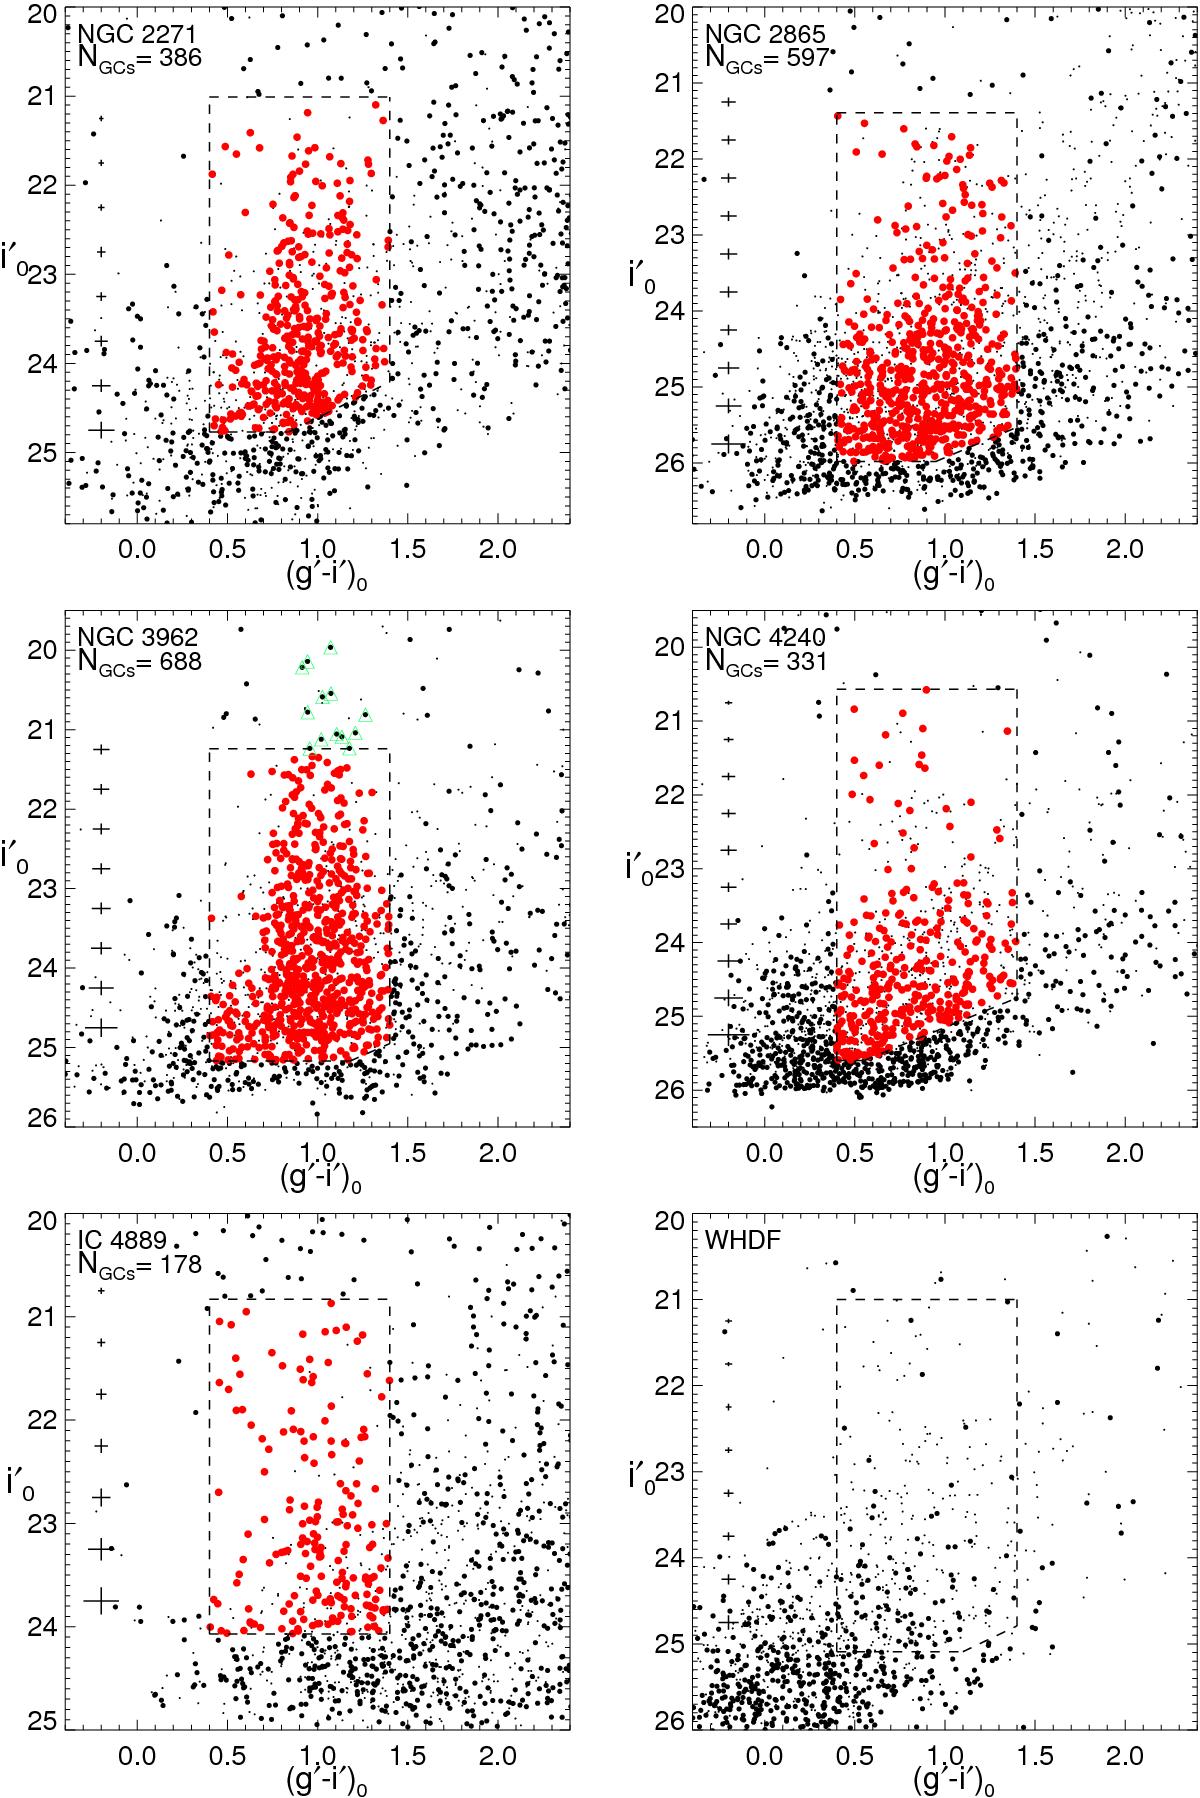
Color–magnitude diagrams for sources detected around the five galaxies plus the control field (bottom right). Small black dots indicate the resolved sources, while the large black dots are the point sources as determined in Sect. 2.1.2. Globular clusters are depicted in red, inside the magnitude and color limits explained in the text. The number of GC candidates stated for each galaxy is before any decontamination and within the FOV. Green triangles in the NGC 3962 panel indicate UCD candidates (see Sect. 7.4).
Current usage metrics show cumulative count of Article Views (full-text article views including HTML views, PDF and ePub downloads, according to the available data) and Abstracts Views on Vision4Press platform.
Data correspond to usage on the plateform after 2015. The current usage metrics is available 48-96 hours after online publication and is updated daily on week days.
Initial download of the metrics may take a while.