Free Access
Fig. A.3
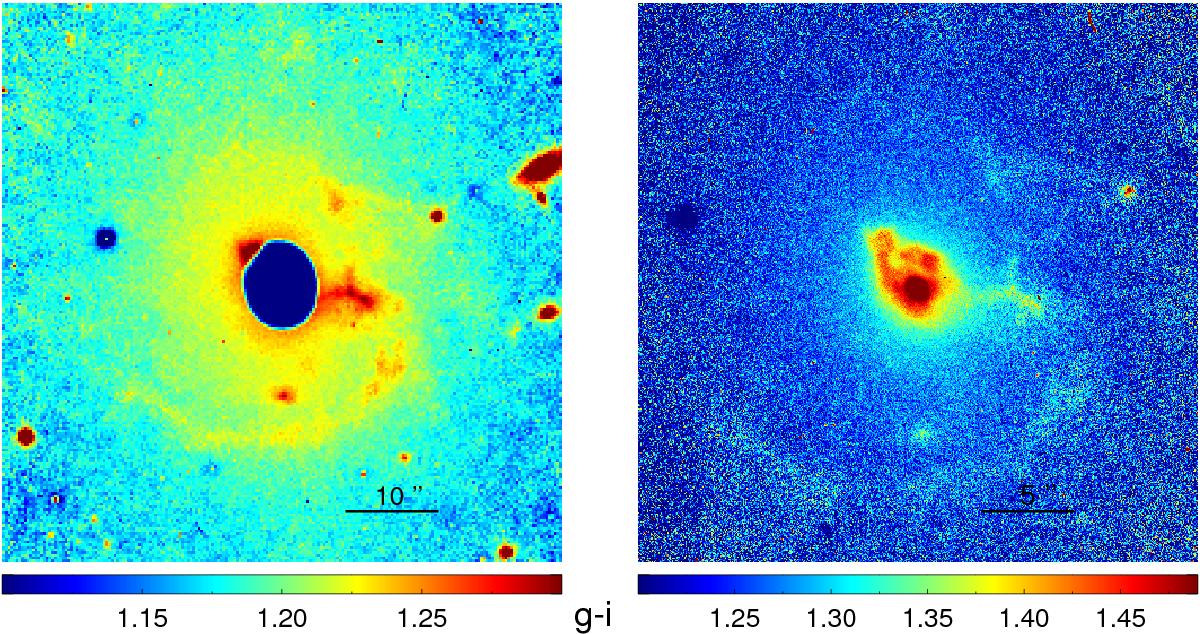
g − i color map for the central parts of NGC 3962. Left panel: Gemini/GMOS map, 1′ aside. The central blue area is due to detector saturation. Right panel: SOAR/SAM color map, 30′′aside. Albeit with lower S/N, it shows details that are not visible in the Gemini image because of saturation.
Current usage metrics show cumulative count of Article Views (full-text article views including HTML views, PDF and ePub downloads, according to the available data) and Abstracts Views on Vision4Press platform.
Data correspond to usage on the plateform after 2015. The current usage metrics is available 48-96 hours after online publication and is updated daily on week days.
Initial download of the metrics may take a while.