| Issue |
A&A
Volume 576, April 2015
|
|
|---|---|---|
| Article Number | A16 | |
| Number of page(s) | 41 | |
| Section | Catalogs and data | |
| DOI | https://doi.org/10.1051/0004-6361/201425349 | |
| Published online | 13 March 2015 | |
Hα3: an Hα imaging survey of HI selected galaxies from ALFALFA ⋆
V. The Coma supercluster survey completion
1 Università degli Studi di Milano-Bicocca, Piazza della Scienza 3, 20126 Milano, Italy
e-mail: giuseppe.gavazzi@mib.infn.it; guido.consolandi@mib.infn.it, e.viscardi4@campus.unimib.it
2 Universitäts-Sternwarte München, Schenierstrasse 1, 81679 München, Germany
3 Max-Planck-Institut für Extraterrestrische Physik, Giessenbachstrasse, 85748 Garching, Germany
4 Centre for Astrophysics and Supercomputing, Swinburne University of Technology, Hawthorn, 3122 Victoria, Australia
5 Institute for Computational Cosmology, Department of Physics, Durham University, South Road, Durham, DH1 3LE, UK
6 Carnegie Observatories, 813 Santa Barbara Street, Pasadena, CA 91101, USA
7 Instituto de Astronomía, Universidad Nacional Autónoma de México, Carretera Tijuana-Ensenada, km 103, 22860 Ensenada, B.C., Mexico
8 Aix-Marseille Université, CNRS, LAM (Laboratoire d’Astrophysique de Marseille) UMR 7326, 13388 Marseille, France
9 Center for Radiophysics and Space Research, Space Science Building, Ithaca, NY 14853, USA
Received: 17 November 2014
Accepted: 19 December 2014
Neutral hydrogen represents the major observable baryonic constituent of galaxies that fuels the formation of stars through transformation of molecular hydrogen. The emission of the hydrogen recombination line Hα is the most direct tracer of the process that transforms gas (fuel) into stars. We continue to present Hα3 (acronym for Hα − αα), an extensive Hα+[NII] narrow-band imaging campaign of galaxies selected from the HI Arecibo Legacy Fast ALFA Survey (ALFALFA), using the instrumentation available at the San Pedro Martir (SPM) observatory (Mexico). In 48 nights since 2011 we were able to carry out the Hα imaging observations of 724 galaxies in the region of the Coma supercluster 10h < RA < 16h ; 24° < Dec < 28° and 3900 <cz< 9000 km s-1. Of these, 603 are selected from the ALFALFA and constitute a 97% complete sample. They provide for the first time a complete census of the massive star formation properties of local gas-rich galaxies belonging to different environments (cluster vs. filaments), morphological types (spirals vs. dwarf Irr), over a wide range of stellar mass (~ 108 − 1011.5M⊙) in the Coma supercluster. The present Paper V provides Hα data and derived star formation rates for the observed galaxies.
Key words: galaxies: clusters: individual: Coma / Galaxy: fundamental parameters / galaxies: ISM
The data available for the 724 galaxies are given in three tables, which are partially listed in the Appendix. The full tables, the Atlas, and the FITS images of the 724 targeted galaxies are distributed via http://goldmine.mib.infn.it/ (Gavazzi et al. 2003, 2014) under the section project/papers.
© ESO, 2015
1. Introduction
Since the turn of the century broadband photometry has received tremendous momentum, in particular from the Sloan Digital Sky Survey (SDSS, York et al. 2000). Owing to this and other similarly large projects that were necessarily carried out by large teams, today’s photometric measurements are available for hundred of thousands, if not millions of galaxies in the whole northern sky.
Similar extensive work does not exist for narrow-band (e.g., Hα) extragalactic imaging in the nearby universe, and existing surveys only cover small regions of the sky at best. Besides the growing effort being placed on the high-redshift universe, owing to the new generation Near InfraRed Integral Field Units (NIR IFUs) attached to 10 m class telescopes, e.g., K-band Multi Object Spectrograph (KMOS, Wisnioski et al. 2014) and Spectrograph for INtegral Field Observations in the Near Infrared (SINFONI, Förster Schreiber et al. 2009 at the Very Large Telescope, VLT); OH-Suppressing Infrared Imaging Spectrograph (OSIRIS at Keck) or narrow-band IR HiZELS imaging (High Redshift Emission Line Survey at the UKIRT, Best et al. 2010), Hα imaging work is available for less than 3000 galaxies in the local universe. After the pioneering work of Kennicutt & Kent in 1983, other groups, in collaboration with Kennicutt, continued this type of work. Among others, we mention the survey of 468 Survey for Ionization in Neutral Gas Galaxies (SINGG) galaxies HI selected from HI Parkes All Sky Survey (HIPASS) by Meurer et al. (2006), the survey of 436 galaxies in the Local Volume (within 11 Mpc) by Kennicutt et al. (2008), of 802 objects by Karachentsev & Kaisina (2013), and of 465 galaxies in Abell clusters by Sakai et al. (2012), which includes approximately 2000 objects in total.
A similar effort by our group was mostly focused on the Virgo cluster (including parts of the Local supercluster) and on the Coma supercluster. It is worth mentioning the survey of 482 galaxies in Virgo, Coma and A1367 by Gavazzi et al. (2002a,b); the survey of 30 galaxies in the Virgo cluster by Boselli et al. (2002); that of 63 galaxies in Coma+A1367 by Iglesias et al. (2002); the one of 273 galaxies in Virgo+Coma+A1367 by Gavazzi et al. (2006); and, finally, the survey of 235 HI selected galaxies in Virgo by Gavazzi et al. (2012). Adding the present survey of 724 galaxies in the Coma supercluster, observations by our group add approximately another 1800 Hα measurements.
Since the blind HI Arecibo Legacy Fast ALFA Survey (ALFALFA; Giovanelli et al. 2005) was completed (2012) at Arecibo and the catalog containing 40% of the targets was published (α.40, Haynes et al. 2011), we undertook the ambitious project to follow-up the HI targets in the spring sky with Hα observations.
The project was well suited for the instrumentation available at the San Pedro Martir observatory belonging to the Universidad Nacional Autonoma de Mexico (UNAM). Both the 1.5 m and the 2.1 m telescopes are equipped with digital cameras with a field of view of approximately 5 arcmin and a set of ~80 Å wide interferometric filters, appropriate for covering most targets with pointed observations, reaching the required sensitivity in less than one hour exposure.
Paper I of this series (Gavazzi et al. 2012) reports the observations obtained for the strip 0 < Dec < 16 deg (covering 235 galaxies in the Local supercluster with cz< 3000 km s-1). Paper II (Gavazzi et al. 2013a) reports the analysis of Hα3 (Hα − αα) in the Local supercluster. Paper III (Gavazzi et al. 2013b), based on a preliminary analysis of the Hα3 survey in the Great Wall, reports on the evidence for environmental dependent galaxy evolution in the densest regions of the Coma supercluster. Paper IV (Fossati et al. 2013) contains the analysis of the structural parameters of Hα3 galaxies in the Local and Coma superclusters.
The present Paper V contains the data collected for ALFALFA selected galaxies in the strip 24 < Dec < 28 deg, covering 724 objects with 3900 <cz< 9000 km s-1 in the Coma supercluster.
The exquisite weather conditions encountered at San Pedro Martir allowed us to complete the Coma survey in just four years (2011−2014). Since 2011, when Hα3 began at San Pedro Martir (SPM), the project was allocated 48 nights. The shutter was kept open for 257 h. Counting an average duration of 8 h per night, this reflects a 67% open shutter efficiency.
This paper is organized as follows. The observed Coma supercluster sample is described in Sect. 2. The observation strategy is the subject of Sect. 3, while the data reduction procedures are briefly outlined in Sect. 4, as they are identical to those reported in Paper I.
The joint analysis of the Coma supercluster (this paper) and the Local supercluster (Paper I) is the subject of Paper VI of this series (Gavazzi et al., in prep.). Throughout the paper we adopt H0 = 73 km s-1 Mpc-1.
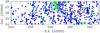 |
Fig. 1 Sky distribution (RA and Dec not to scale) of 623 HI selected galaxies in the ALFALFA strip 24°< Dec < 28°; 3900 <cz< 9000 (km s-1) (from Haynes et al. 2011), divided among 603 galaxies subject to Hα follow up observations (blue circles) and 20 not observed (red circles). Green circles indicate 121 optically selected galaxies from SDSS without AGC designation. The large semi-circle gives the position of the Coma cluster. |
2. The sample
2.1. Selection
Our sample is drawn from the 360-square degree region 10h < RA < 16h; 24° < Dec < 28°; 3900 <cz< 9000 km s-1, covering the Coma supercluster, including half of the Coma cluster. This region has been fully mapped by ALFALFA (Haynes et al. 2011), which provides us with a complete sample of HI selected galaxies, with HI masses as low as 109 − 9.5M⊙1. The goal of the Hα3 survey is to follow up with Hα imaging observations the ALFALFA targets with high signal-to-noise ratio (typically S/N > 6.5), and with consistent detection between two independent polarizations (code = 1 sources in Haynes et al. 2011). We will refer to these targets as the HI or radio targets. Figure 1 illustrates the sky region under study. The panel contains 623 HI selected galaxies in the range 3900 <cz < 9000 (km s-1), from the ALFALFA Survey, divided among 603 Hα that were subject to follow up observations (blue circles), 20 not observed (red circles), plus 121 galaxies (green circles) not ALFALFA-selected (without designation in the (Arecibo Galaxy Catalog, AGC). These are for the most part CGCG galaxies (Catalog of Galaxies and Clusters of Galaxies, Zwicky et al. 1968) previously (1993−2006) observed in the context of the GOLDMine project, independent from their HI selection, and some fainter SDSS late-type galaxies (LTGs) observed on purpose, especially during the 2013 run, to show Hα emission in their SDSS nuclear spectra, in spite of being gas-poor LTGs (undetected by ALFALFA). This subsample tests that stripped LT galaxies still retain some gas in their centers feeding some circumnuclear star formation, demonstrating that the gas ablation proceeds outside-in, as in the ram-pressure scenario (see Gavazzi et al. 2013b).
2.2. Completeness
In the region under study there are 683 HI selected galaxies, collected from ALFALFA, but only 623 of them lie in the range 3900 <cz< 9000 (km s-1, suitable for our narrow-band filter coverage). Of those galaxies, 603 are subject to follow up observations in Hα reaching a completeness of 97%. The remaining 20 ALFALFA sources (red circles in Fig. 1) were not observed by Hα3 because they lie too close to bright stars that would saturate the detector.
To further investigate the HI completeness of Hα3, i.e., the limiting HI mass above which Hα3 is complete, we compare in Fig. 2 the ALFALFA HI mass function given by Martin et al. (2010, black curve), representative of the whole Local Universe sampled by ALFALFA, which is well represented by a Schechter function with α = −1.33, Φ∗ = 4.8 × 10⁻³ Mpc-3 dex-1, M∗ = 109.96 with the HI Mass distribution in Hα3 (black solid histogram). The black curve is the ALFALFA HI mass function whose Φ∗ was normalized to the volume sampled by Hα3.
The agreement between the black line and the black solid histogram is very satisfactory above log (MHI/M⊙) ~ 9.2, which can be assumed as the HI completeness limit of Hα3. The data and the black line depart above log (MHI/M⊙) ~ 10.5 due to cosmic variance, as the number of high HI mass galaxies sampled by Hα3 is limited. This is an effect of HI deficiency and the highest HI mass objects are too rare to be found in the small volume sampled by Hα3.
Figure 2 also displays the HI Mass distribution of the 603 galaxies subject to Hα follow up observations (red histogram).
2.3. Ancillary data
The whole region we studied, where 683 radio selected galaxies are found, was covered with imaging and spectroscopic observations by the SDSS (DR10, Ahn et al. 2014), which provided an optically complete selection of 2416 galaxies as faint as r < 17.7 mag for the first time. It is well known, however that the SDSS pipeline is tailored for providing correct magnitudes of objects of cosmological interest (cz > 0.05), but is often unreliable for extended, low brightness objects in the nearby universe because of the “shredding” problem (Blanton et al. 2005). Therefore we based our Petrosian magnitude extraction (in the AB system) on the SDSS material using an automated procedure (Consolandi et al., in prep.) especially tailored for resolving the shredding problem and for accurate masking of the unwanted light coming from contaminating objects (foreground stars and galaxies). This procedure performs aperture photometry on the i and g SDSS images that we downloaded using the IRSA-Montage software (Katz et al. 2011), centered at the optical coordinates of the target galaxies. The procedure automatically detects and masks (using Sextractor, Bertin & Arnouts 1996) contaminating stars and galaxies, evaluates and subtracts the mode value of the sky, and performs the integrated photometry up to an aperture centered on each target object corresponding to 2 × the Petrosian radius, consistently with SDSS. We checked that the individual measurements obtained using the above procedure are consistent with those measured manually (IRAF, Image Reduction and Analysis Facility) on the SDSS material, even for large galaxies for which the SDSS pipeline is most unreliable.
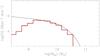 |
Fig. 2 HI mass function for the 623 HI selected galaxies collected from ALFALFA in the range 3900 <cz< 9000 (km s-1) (black solid histogram). It is indistinguishable from the red solid histogram, which refers to the galaxies subject to Hα follow up observations. HI mass function of Martin et al. (2010) (black solid line). There is a lack of bright galaxies above 1010.5M⊙ because of the finite sampled volume of the Coma supercluster. |
The optical properties of the 724 sources observed in Hα3 are presented in Table A.1. Individual entries are as follows:
-
Col. 1: galaxy name using the nomenclature recommended by theIAU;
-
Col. 2: AGC designation, from Haynes et al. (2011);
-
Col. 3: CGCG (Zwicky et al. 1968) designation;
-
Cols. 4 and 5: optical celestial coordinates (J2000);
-
Col. 6: morphological type, classified by the authors by visual inspection of the SDSS color images;
-
Col. 7: recessional velocity from the SDSS spectroscopic database or from Nasa Extragalactic Database (NED);
-
Cols. 8 and 9: major and minor 25th mag arcsec-2 isophotal diameters in the (g-band) from SDSS;
-
Cols. 10 and 11: i and g Petrosian (AB) magnitudes;
-
Col. 12: adopted distance (Mpc).
Log-book of the Hα observations in the Coma region.
3. Observations
Narrow-band imaging of the Hα emission (rest frame λ = 6562.8 Å) of 724 galaxies was secured with observations taken for the most part at the San Pedro Martir Observatory belonging to the Mexican Observatorio Astronómico Nacional (OAN). Out of the 724 objects observed, 603 are HI selected from ALFALFA and 121 are optically selected.
For each run, Table 1 summarizes the observing dates, the telescope, the characteristics of the CCD detector used, and the number of observed objects. Among the 724 objects included in Tables 1, 68 have been observed in Hα prior to 2010 (prior to the publication of ALFALFA). These are optically selected galaxies whose data are in common with Gavazzi et al. (1998, 2002a,b, 2006), Boselli & Gavazzi (2002), Iglesias-Páramo et al. (2002). Among them three galaxies were observed in 2000 using the 2.5 m Isaac Newton Telescope (INT, La Palma). All other target galaxies were observed using the 2.1 m and 1.5 m telescopes at San Pedro Martir Observatory equipped with 1024 × 1024 pixel detectors from 1993 to 2006 and with a 2048 × 2048 pixel CCD, used in a 2× rebin mode since 2010.
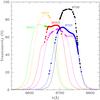 |
Fig. 3 Transmissivity of the ON-band (6643, 6650, 6683, 6690, 6723 and 6730 Å) filters. Points mark the throughput at the redshift of the target galaxies. |
For each galaxy we obtained ON-band exposures using a set of narrow-band interferometric filters, whose bandpass was chosen to include the wavelength of their redshifted Hα+[NII] lines, as shown in Fig. 3. While the median seeing at the San Pedro Martir is ~ , the final full width half maximum (FWHM) for point sources in the images is affected by a poor telescope guiding and dome seeing. The final distribution ranges from ~1′′ to ~3′′, with a median seeing
  as shown in Fig. 4.
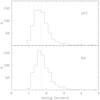 |
Fig. 4 FWHM of stars measured on the final OFF-band images (top panel) and ON-band images (bottom panel). Poor telescope guiding performance and dome seeing result in a median seeing of 1.7′′ (dotted line). |
To minimize the contamination from cosmic rays, we split the ON-band observations in multiple (at least three) exposures with a total integration time ranging typically from 5 to 30 min, according to the seeing conditions and to the source brightness.
We secured the stellar continuum subtraction by means of shorter (typically 3 to 5 min) observations taken through a broadband (λc 6515 Å, Δλ ~ 1200 Å) r-Gunn filter (OFF-band frames).
We derive the absolute flux calibration using the spectrophotometric stars Feige34 and HZ44 from the catalog of Massey et al. (1988), observed every ~2 h. Most observations were carried out in photometric conditions. However a handful galaxies have been imaged in transparent but not photometric conditions and for these objects we derive only the Hα equivalent width (EW; insensitive to the absolute flux calibration), but not the Hα flux (see N in Col. 11 of Table A.3).
The information relative to the narrow-band observations is listed in Table A.2, as follows:
-
Col. 1: galaxy name using the nomenclature recommended by the IAU;
-
Col. 2: AGC designation, from Haynes et al. (2011);
-
Col. 3: CGCG (Zwicky et al. 1968) designation;
-
Col. 4: observing date (yy-mm-dd UT);
-
Col. 5: central wavelength of the adopted ON-band filter (Å);
-
Cols. 6 and 7: duration and number of individual ON-band exposures;
-
Col. 8: average airmass during the ON-band exposures;
-
Col. 9: adopted photometric zero point;
-
Col. 10: FWHM of point sources (arcsec), as measured on the ON-band frames;
-
Cols. 11 and 12: duration and number of individual OFF-band exposures;
-
Col. 13: FWHM of point sources (arcsec) as measured on the OFF-band frames;
-
Col. 14: normalization factor n of the OFF-band frames (see next section).
4. Data reduction
4.1. Image analysis
We reduce the CCD frames following an identical procedure to that described in Paper I of this series, based on the STSDAS and GALPHOT IRAF packages. We provide a detailed description of the data reduction in that paper and here we give only a brief summary. Also the methods to extract the photometry of the Hα+[NII] line (flux and equivalent width) and to estimate its error budget can be found in Sect. 4.2 of Paper I. Similarly, the procedures to correct the measured flux for Galactic extinction, deblending from [NII] and internal extinction are identical to those given in Sect. 4.3 of Paper I and are not repeated here.
In summary, each image is bias-subtracted and flatfield corrected using sky exposures obtained during twilight in regions devoid of stars. When three exposures on the same object are available, we adopt a median combination of the realigned images to reject cosmic rays in the final stack. Otherwise we reject cosmic rays by direct inspection of the frames.
We subtract a mean local sky background, computed around the galaxy, using the GALPHOT tasks MARKSKY and SKYFIT. Some frames taken in 2011 are affected by some extra noise structured in a horizontal pattern probably introduced by the electronics during the read out process. We found that a satisfactory sky background subtraction from these frames is obtained using the task BACKGROUND, generally applied to spectroscopic data reduction.
The flatfielded ON frames were aligned with the OFF frames using field stars. At this stage, the seeing was determined independently on the two sets of images (see Fig. 4). After normalization of the OFF-band frames (see Sect. 4.2), NET images were produced by subtracting the OFF from the ON frames.
4.2. Integral photometry
Fluxes and EWs of the Hα line can be recovered from narrow ON-band observations by subtracting the stellar continuum contribution estimated from broadband (r) images, once these are normalized to account for the ratio of the transmissivity of the two filters and the difference in exposure time. For each galaxy, we derive the normalization coefficient n by assuming that field stars have no significant Hα emission on average and therefore they have identical continuum levels in the ON- and OFF-band frames. Following Spector et al. (2012), however, we multiply the normalization coefficient found so far by 0.95 to account for the fact that field stars are generally redder than the galaxy continua we are trying to estimate. The normalization factors relative to the data taken in 2014 are checked by comparing the r-band photometry of the target galaxies available from SDSS with the internal magnitudes obtained with aperture photometry performed on our normalized r-band frames. As shown in Fig. 5, a satisfactory agreement exists between the SDSS r-band magnitudes and our internal magnitudes.
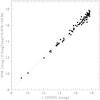 |
Fig. 5 Comparison between the integrated r mag from SDSS (DR10, except for the ten brightest objects, measured as in Sect. 2.3) and the magnitudes measured in the r images taken at SPM in 2014, using the IRAF task QPHOT. |
4.3. Comparisons with SDSS and the literature
Taking advantage of the SDSS spectral database (DR10), we compare our results, limited to the inner 3 arcsec apertures, with the corresponding values from SDSS nuclear spectra taken in 3 arcsec fibres.
The raw F(Hα + [NII]) and EW(Hα + [NII]), (i.e., neglecting corrections for [NII] deblending and internal absorption) measured in the inner 3 arcsec aperture centered on the galaxy nuclei are compared with the same quantities from DR10 spectral database in Fig. 6, showing overall consistency. The median value of the differences of EW (this work – SDSS) is 1.38 ± 8.78 Å. The median value of the differences of log Flux (this work – SDSS) is −0.07 ± 0.16.
As mentioned in Paper II, the sources of error in the flux measurements are a combination of a) uncertainty on the background subtraction (dominant for extended sources); b) Poisson statistical uncertainty (dominant for weak sources); and c) systematic uncertainties on the OFF-band normalization factor (see Spector et al. 2012).
Several galaxies were repeatedly observed at SPM in different runs. They are given in Fig. 7, showing satisfactory agreement. The only deviating point (AGC 250425) was checked on 3 arcsec aperture and compared with the measurement on the SDSS nuclear spectrum; the correct calibration turns out to correspond to the 2.1 m measurement.
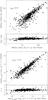 |
Fig. 6 Top panel: comparison between the EW(Hα + [NII]) measured on the Hα images from this work in 3 arcsec apertures and the EW(Hα + [NII]) measured on SDSS spectra taken in 3 arcsec fibres. Bottom panel: comparison between the (Hα + [NII]) flux measured on the Hα images from this work in 3 arcsec apertures and the (Hα + [NII]) flux measured on SDSS spectra taken in 3 arcsec fibres. The dashed lines give the 1:1 relation. |
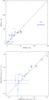 |
Fig. 7 Comparison between the integrated EWHα (top panel) and Hα flux (bottom panel) repeatedly measured in different observing runs. Red symbol refers to measurements taken in April and May 2010 at the 1.5 m. Blue symbols are 1.5 m vs. 2.1 m measurements. Green symbols are 2.1 m vs. 2.1 m repeated measurements. The dashed lines give the 1:1 relation. The object with deviating EWHα was checked on SDSS nuclear spectroscopy and found to be consistent with the 2.1 m measurement. |
5. Results
The results of integral photometry of the Hα + [NII] and the derivation of the corrected star formation rate (SFR), as derived from the present observations, are listed in Table A.3 as follows:
-
Col. 1: galaxy name using the nomenclature recommended by the IAU;
Col. 2: AGC designation, from Haynes et al. (2011);
Col. 3: CGCG (Zwicky et al. 1968) designation;
Cols. 4 and 5: RA and Dec (J2000);
Col. 6: equivalent width (EW) of Hα + [NII] (Å);
Col. 7: 1σ uncertainty on the Hα + [NII] EW;
Col. 8: logarithm of Hα + [NII] flux (erg cm-2 s-1);
Col. 9: logarithm of 1σ uncertainty on the Hα + [NII] flux;
Col. 10: logarithm value of SFR in M⊙ yr-1 corrected for galactic extinction, deblending from [NII] and internal extinction as adopted by Lee et al. (2009);
Col. 11: sky quality: P = photometric, N = non photometric. An asterisk marks galaxies with uncertain fluxes because the transmissivity of the used ON band filter at their redshift was less than 50%.
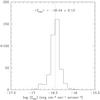 |
Fig. 8 Histogram of the limiting 1σ surface brightness in the Hα NET images. |
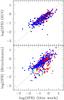 |
Fig. 9 Determination of the star formation rate from this work is compared with that obtained by Brinchmann et al. (2004, multiplied by 1.5 to account for the change of IMF from Kroupa to Salpeter) (bottom panel) and with that obtained using the NUV magnitudes of Huang et al. (2012) (top panel). Blue dots represent galaxies with nuclear HII-like spectra, red dots are AGNs (or LINERs), green dots are nuclear passive spectra. |
The comparison between the SRF determined in this work by converting Hα luminosities into SFR adopting the Kennicutt (1998) recipe (assuming a Salpeter initial mass function, IMF) with those given by Brinchmann et al. (2004) and by Huang et al. (2012) is plotted in Fig. 9. Brinchmann et al. (2004) adopt a Kroupa IMF (Kroupa 2001) and suggest that their SFR should be converted into Salpeter by multiplying them by 1.5 (see Fig. 9, bottom panel). Huang et al. (2012) use the Chabrier IMF (Chabrier 2003), therefore we recalculate the SFR from their near ultra violet (NUV) luminosities adopting the Kennicutt (1998) recipe (see Fig. 9, top panel). The figure shows an excellent agreement between our data and Huang et al. (2012). Brinchmann et al. (2004) SFRs, based on the SDSS nuclear spectra extrapolated to the whole galaxies using the SDSS integrated colors, appear systematically higher than our values by 0.2 dex. On the opposite most passive and many active galactic nucleus (AGN) galaxies appear underestimated by Brinchmann et al. (2004). Both discrepancies might derive from the extrapolation method adopted by Brinchmann et al. (2004). Most of the discrepant AGNs (marked with red symbols) are in fact low-ionization nuclear emission-line regions (LINERs), i.e., with nuclear Hα lower or comparable to [NII], giving a possible clue for their low extrapolated SFR by Brinchmann et al. (2004).
As introduced in Giovanelli et al. (2005) ALFALFA is a noise-limited survey rather than a flux-limited one. At any given integrated HI mass the 21 cm flux per velocity channel is inversely proportional to the width of the HI profile, thus to the galaxy inclination. The completeness and sensitivity of ALFALFA are well understood and discussed in detail in Saintonge (2007), Martin et al. (2010), and Haynes et al. (2011).
Acknowledgments
Observations were taken at the observatory of San Pedro Martir (Baja California, Mexico), belonging to the Mexican Observatorio Astronómico Nacional. We thank the Mexican TAC for the generous time allocation to this project. We acknowledge useful discussions with Luis Aguillar, Luis Carrasco, Michael Richter. We thank Fabrizio Arrigoni Battaia, Silvia Fabello, Emanuele Farina, Mattia Fumagalli, Lea Giordano, and Camilla Pacifici for their participation in some of the observing runs and Luca Cortese, Anna Gallazzi, Stefano Zibetti, Federica Martinelli, and Ilaria Arosio for their contribution to the data reduction. The authors would like to acknowledge the work of the entire ALFALFA collaboration team in observing, flagging, and extracting the catalog of galaxies used in this work. This research has made use of the GOLDMine database (Gavazzi et al. 2003, 2014) and of the NASA/IPAC Extragalactic Database (NED), which is operated by the Jet Propulsion Laboratory, California Institute of Technology, under contract with the National Aeronautics and Space Administration. Funding for the Sloan Digital Sky Survey (SDSS) and SDSS-II has been provided by the Alfred P. Sloan Foundation, the Participating Institutions, the National Science Foundation, the US Department of Energy, the National Aeronautics and Space Administration, the Japanese Monbukagakusho, and the Max Planck Society, and the Higher Education Funding Council for England. The SDSS Web site is http://www.sdss.org/. The SDSS is managed by the Astrophysical Research Consortium (ARC) for the Participating Institutions. The Participating Institutions are the American Museum of Natural History, Astrophysical Institute Potsdam, University of Basel, University of Cambridge, Case Western Reserve University, The University of Chicago, Drexel University, Fermilab, the Institute for Advanced Study, the Japan Participation Group, The Johns Hopkins University, the Joint Institute for Nuclear Astrophysics, the Kavli Institute for Particle Astrophysics and Cosmology, the Korean Scientist Group, the Chinese Academy of Sciences (LAMOST), Los Alamos National Laboratory, the Max-Planck-Institute for Astronomy (MPIA), the Max-Planck-Institute for Astrophysics (MPA), New Mexico State University, Ohio State University, University of Pittsburgh, University of Portsmouth, Princeton University, the United States Naval Observatory, and the University of Washington. R.G. and M.P.H. are supported by US NSF grants AST-1107390 and by a Brinson Foundation grant. M.F. acknowledges support by the Science and Technology Facilities Council [grant number ST/L00075X/1]. M. Fossati acknowledges the support of the Deutsche Forschungsgemeinschaft via Project ID 387/1-1.
References
- Ahn, C. P., Alexandroff, R., Allen de Prieto, C., et al. 2014, ApJS, 211, 17 [NASA ADS] [CrossRef] [Google Scholar]
- Bertin, E., & Arnouts, S. 1996, A&AS, 117, 393 [NASA ADS] [CrossRef] [EDP Sciences] [Google Scholar]
- Best, P., Smail, I., Sobral, D., et al. 2010 [arXiv:1003.5183] [Google Scholar]
- Blanton, M. R., Schlegel, D. J., Strauss, M. A., et al. 2005, AJ, 129, 2562 [NASA ADS] [CrossRef] [Google Scholar]
- Boselli, A., & Gavazzi, G. 2002, A&A, 386, 124 [NASA ADS] [CrossRef] [EDP Sciences] [Google Scholar]
- Boselli, A., Iglesias-Páramo, J., Vílchez, J. M., & Gavazzi, G. 2002, A&A, 386, 134 [NASA ADS] [CrossRef] [EDP Sciences] [Google Scholar]
- Brinchmann, J., Charlot, S., White, S. D. M., et al. 2004, MNRAS, 351, 1151 [NASA ADS] [CrossRef] [Google Scholar]
- Chabrier, G. 2003, PASP, 115, 763 [NASA ADS] [CrossRef] [Google Scholar]
- Förster Schreiber, N. M., Genzel, R., Bouché, N., et al. 2009, ApJ, 706, 1364 [NASA ADS] [CrossRef] [Google Scholar]
- Fossati, M., Gavazzi, G., Savorgnan, G., et al. 2013, A&A, 553, A91 (Paper IV) [NASA ADS] [CrossRef] [EDP Sciences] [Google Scholar]
- Gavazzi, G., Catinella, B., Carrasco, L., Boselli, A., & Contursi, A. 1998, AJ, 115, 1745 [NASA ADS] [CrossRef] [Google Scholar]
- Gavazzi, G., Boselli, A., Pedotti, P., Gallazzi, A., & Carrasco, L. 2002a, A&A, 386, 114 [NASA ADS] [CrossRef] [EDP Sciences] [Google Scholar]
- Gavazzi, G., Boselli, A., Pedotti, P., Gallazzi, A., & Carrasco, L. 2002b, A&A, 396, 449 [NASA ADS] [CrossRef] [EDP Sciences] [Google Scholar]
- Gavazzi, G., Boselli, A., Donati, A., Franzetti, P., & Scodeggio, M. 2003, A&A, 400, 451 [NASA ADS] [CrossRef] [EDP Sciences] [Google Scholar]
- Gavazzi, G., Boselli, A., Cortese, L., et al. 2006, A&A, 446, 839 [NASA ADS] [CrossRef] [EDP Sciences] [Google Scholar]
- Gavazzi, G., Fumagalli, Michele, Galardo, V., et al. 2012, A&A, 545, A16 (Paper I) [NASA ADS] [CrossRef] [EDP Sciences] [Google Scholar]
- Gavazzi, G., Fumagalli, Michele, Fossati, M., et al. 2013a, A&A, 553, A89 (Paper II) [NASA ADS] [CrossRef] [EDP Sciences] [Google Scholar]
- Gavazzi, G., Savorgnan, G., Fossati, M., et al. 2013b, A&A, 553, A90 (Paper III) [NASA ADS] [CrossRef] [EDP Sciences] [Google Scholar]
- Gavazzi, G., Franzetti, P., & Boselli, A. 2014 [arXiv:1401.8123] [Google Scholar]
- Giovanelli, R., Haynes, M. P., Kent, B. R., et al. 2005, AJ, 130, 2598 [NASA ADS] [CrossRef] [Google Scholar]
- Haynes, M. P., Giovanelli, R., Martin, A. M., et al. 2011, AJ, 142, 170 [NASA ADS] [CrossRef] [Google Scholar]
- Huang, S., Haynes, M. P., Giovanelli, R., & Brinchmann, J. 2012, ApJ, 756, 113 [NASA ADS] [CrossRef] [Google Scholar]
- Iglesias-Páramo, J., Boselli, A., Cortese, L., Vílchez, J. M., & Gavazzi, G. 2002, A&A, 384, 383 [NASA ADS] [CrossRef] [EDP Sciences] [Google Scholar]
- Karachentsev, I. D., & Kaisina, E. I. 2013, AJ, 146, 46 [NASA ADS] [CrossRef] [Google Scholar]
- Katz, D. S., Berriman, G. B., & Mann, R. G. 2011, in Reshaping Research and Development Using Web 2.0-based Technologies, ed. M. Baker (Nova Science Publishers, Inc.) [Google Scholar]
- Kennicutt, R. C., Jr. 1998, ApJ, 498, 541 [NASA ADS] [CrossRef] [Google Scholar]
- Kennicutt, R. C., Jr., & Kent, S. M. 1983, AJ, 88, 1094 [NASA ADS] [CrossRef] [Google Scholar]
- Kennicutt, R. C., Jr., Lee, J. C., Funes, S. J., et al. 2008, ApJS, 178, 247 [NASA ADS] [CrossRef] [Google Scholar]
- Kroupa, P. 2001, MNRAS, 322, 231 [NASA ADS] [CrossRef] [Google Scholar]
- Lee, J. C., Gil de Paz, A., Tremonti, C., et al. 2009, ApJ, 706, 599 [NASA ADS] [CrossRef] [Google Scholar]
- Martin, A. M., Papastergis, E., Giovanelli, R., et al. 2010, ApJ, 723, 1359 [NASA ADS] [CrossRef] [Google Scholar]
- Massey, P., Strobel, K., Barnes, J. V., & Anderson, E. 1988, ApJ, 328, 315 [NASA ADS] [CrossRef] [Google Scholar]
- Meurer, G. R., Hanish, D. J., Ferguson, H. C., et al. 2006, ApJS, 165, 307 [NASA ADS] [CrossRef] [Google Scholar]
- Saintonge, A. 2007, AJ, 133, 2087 [NASA ADS] [CrossRef] [Google Scholar]
- Sakai, S., Kennicutt, R. C., Jr., & Moss, C. 2012, ApJS, 199, 36 [NASA ADS] [CrossRef] [Google Scholar]
- Spector, O., Finkelman, I., & Brosch, N. 2012, MNRAS, 419, 2156 [NASA ADS] [CrossRef] [Google Scholar]
- York, D. G., Adelman, J., Anderson, J. E., Jr., et al. 2000, AJ, 120, 1579 [Google Scholar]
- Wisnioski, E., Förster Schreiber, N. M., Wuyts, S., et al. 2014, ApJ, 799, 209 [Google Scholar]
- Zwicky, F., Herzog, E., & Wild, P. 1968, Pasadena: California Institute of Technology (CIT) [Google Scholar]
Appendix A: The Atlas
An Atlas of the 724 observed galaxies, sorted by their celestial coordinates is given in this Appendix. The OFF-band contours are drawn at 1.5, 2.5, 5 × σ of the sky in the OFF frame and the gray scales represent the NET flux intensity between 1 and 3 × σ of the sky in the NET frame. A bar of one arcmin length is given on all images. The images obtained in 2013 were rotated clockwise by 10.5 or 3.5 degrees to align the Y axes of the CCD with the North direction.
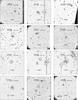 |
Fig. A.1 One page gallery of the atlas of 724 galaxies (red crosses) observed in Hα, identified by their celestial coordinates and, if available, by their AGC designation. The OFF-band countours are drawn at 1.5, 2.5, 5 × σ of the sky in the normalized r band images. The grey scale represents the NET flux intensity between 1 and 3 × σ of the sky in the Hα NET (continuum subtracted) frames. A 1 arcmin bar is given on all images. All 2013 images have been rotated by 10.5 or 3.5 clockwise to align the Y axes of the CCD with the North direction. |
Basic data of the 724 target galaxies.
Hα observational specifications of the 724 target galaxies.
Integrated Hα photometric parameters of the 724 target galaxies.
All Tables
All Figures
|
Fig. 1 Sky distribution (RA and Dec not to scale) of 623 HI selected galaxies in the ALFALFA strip 24°< Dec < 28°; 3900 <cz< 9000 (km s-1) (from Haynes et al. 2011), divided among 603 galaxies subject to Hα follow up observations (blue circles) and 20 not observed (red circles). Green circles indicate 121 optically selected galaxies from SDSS without AGC designation. The large semi-circle gives the position of the Coma cluster. |
| In the text | |
|
Fig. 2 HI mass function for the 623 HI selected galaxies collected from ALFALFA in the range 3900 <cz< 9000 (km s-1) (black solid histogram). It is indistinguishable from the red solid histogram, which refers to the galaxies subject to Hα follow up observations. HI mass function of Martin et al. (2010) (black solid line). There is a lack of bright galaxies above 1010.5M⊙ because of the finite sampled volume of the Coma supercluster. |
| In the text | |
|
Fig. 3 Transmissivity of the ON-band (6643, 6650, 6683, 6690, 6723 and 6730 Å) filters. Points mark the throughput at the redshift of the target galaxies. |
| In the text | |
|
Fig. 4 FWHM of stars measured on the final OFF-band images (top panel) and ON-band images (bottom panel). Poor telescope guiding performance and dome seeing result in a median seeing of 1.7′′ (dotted line). |
| In the text | |
|
Fig. 5 Comparison between the integrated r mag from SDSS (DR10, except for the ten brightest objects, measured as in Sect. 2.3) and the magnitudes measured in the r images taken at SPM in 2014, using the IRAF task QPHOT. |
| In the text | |
|
Fig. 6 Top panel: comparison between the EW(Hα + [NII]) measured on the Hα images from this work in 3 arcsec apertures and the EW(Hα + [NII]) measured on SDSS spectra taken in 3 arcsec fibres. Bottom panel: comparison between the (Hα + [NII]) flux measured on the Hα images from this work in 3 arcsec apertures and the (Hα + [NII]) flux measured on SDSS spectra taken in 3 arcsec fibres. The dashed lines give the 1:1 relation. |
| In the text | |
|
Fig. 7 Comparison between the integrated EWHα (top panel) and Hα flux (bottom panel) repeatedly measured in different observing runs. Red symbol refers to measurements taken in April and May 2010 at the 1.5 m. Blue symbols are 1.5 m vs. 2.1 m measurements. Green symbols are 2.1 m vs. 2.1 m repeated measurements. The dashed lines give the 1:1 relation. The object with deviating EWHα was checked on SDSS nuclear spectroscopy and found to be consistent with the 2.1 m measurement. |
| In the text | |
|
Fig. 8 Histogram of the limiting 1σ surface brightness in the Hα NET images. |
| In the text | |
|
Fig. 9 Determination of the star formation rate from this work is compared with that obtained by Brinchmann et al. (2004, multiplied by 1.5 to account for the change of IMF from Kroupa to Salpeter) (bottom panel) and with that obtained using the NUV magnitudes of Huang et al. (2012) (top panel). Blue dots represent galaxies with nuclear HII-like spectra, red dots are AGNs (or LINERs), green dots are nuclear passive spectra. |
| In the text | |
|
Fig. A.1 One page gallery of the atlas of 724 galaxies (red crosses) observed in Hα, identified by their celestial coordinates and, if available, by their AGC designation. The OFF-band countours are drawn at 1.5, 2.5, 5 × σ of the sky in the normalized r band images. The grey scale represents the NET flux intensity between 1 and 3 × σ of the sky in the Hα NET (continuum subtracted) frames. A 1 arcmin bar is given on all images. All 2013 images have been rotated by 10.5 or 3.5 clockwise to align the Y axes of the CCD with the North direction. |
| In the text | |
Current usage metrics show cumulative count of Article Views (full-text article views including HTML views, PDF and ePub downloads, according to the available data) and Abstracts Views on Vision4Press platform.
Data correspond to usage on the plateform after 2015. The current usage metrics is available 48-96 hours after online publication and is updated daily on week days.
Initial download of the metrics may take a while.