Fig. 9
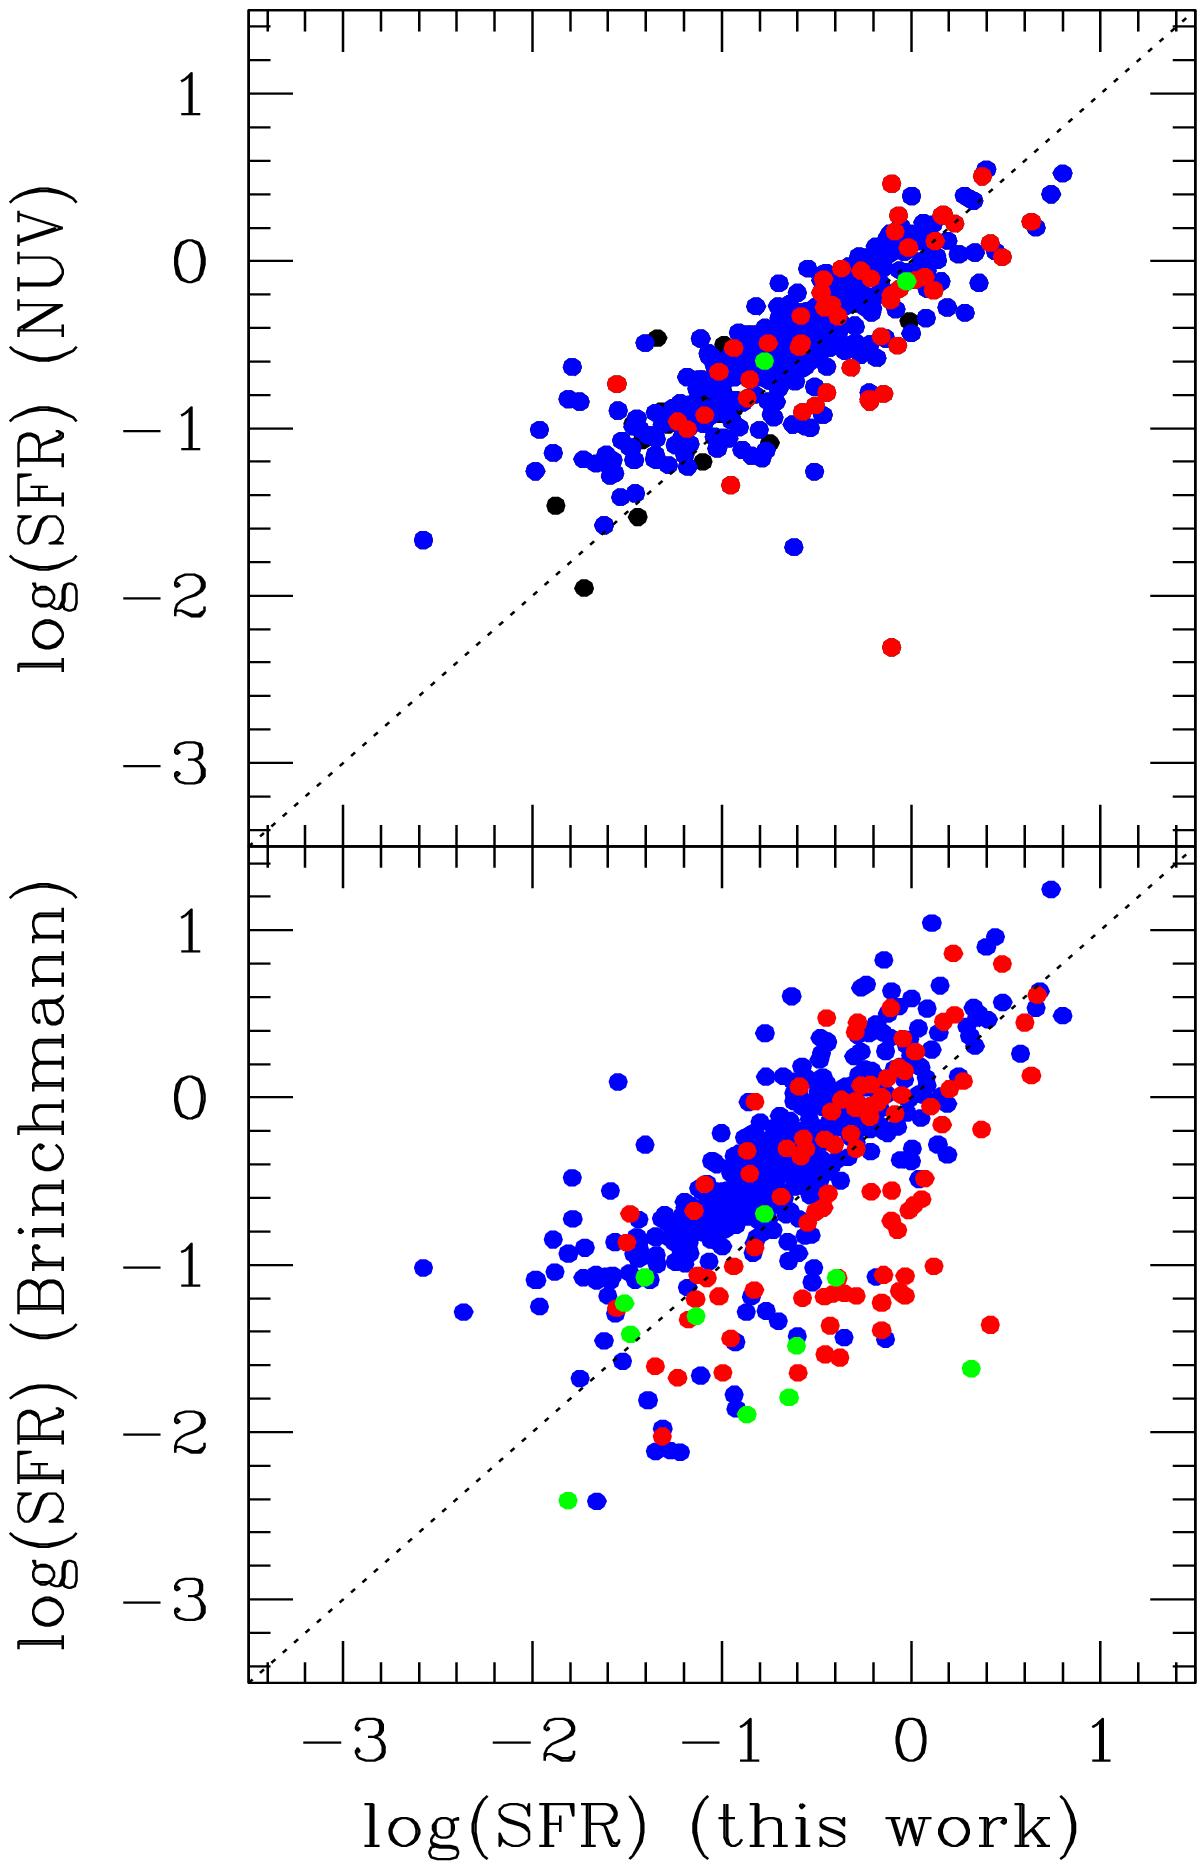
Determination of the star formation rate from this work is compared with that obtained by Brinchmann et al. (2004, multiplied by 1.5 to account for the change of IMF from Kroupa to Salpeter) (bottom panel) and with that obtained using the NUV magnitudes of Huang et al. (2012) (top panel). Blue dots represent galaxies with nuclear HII-like spectra, red dots are AGNs (or LINERs), green dots are nuclear passive spectra.
Current usage metrics show cumulative count of Article Views (full-text article views including HTML views, PDF and ePub downloads, according to the available data) and Abstracts Views on Vision4Press platform.
Data correspond to usage on the plateform after 2015. The current usage metrics is available 48-96 hours after online publication and is updated daily on week days.
Initial download of the metrics may take a while.