Fig. 6
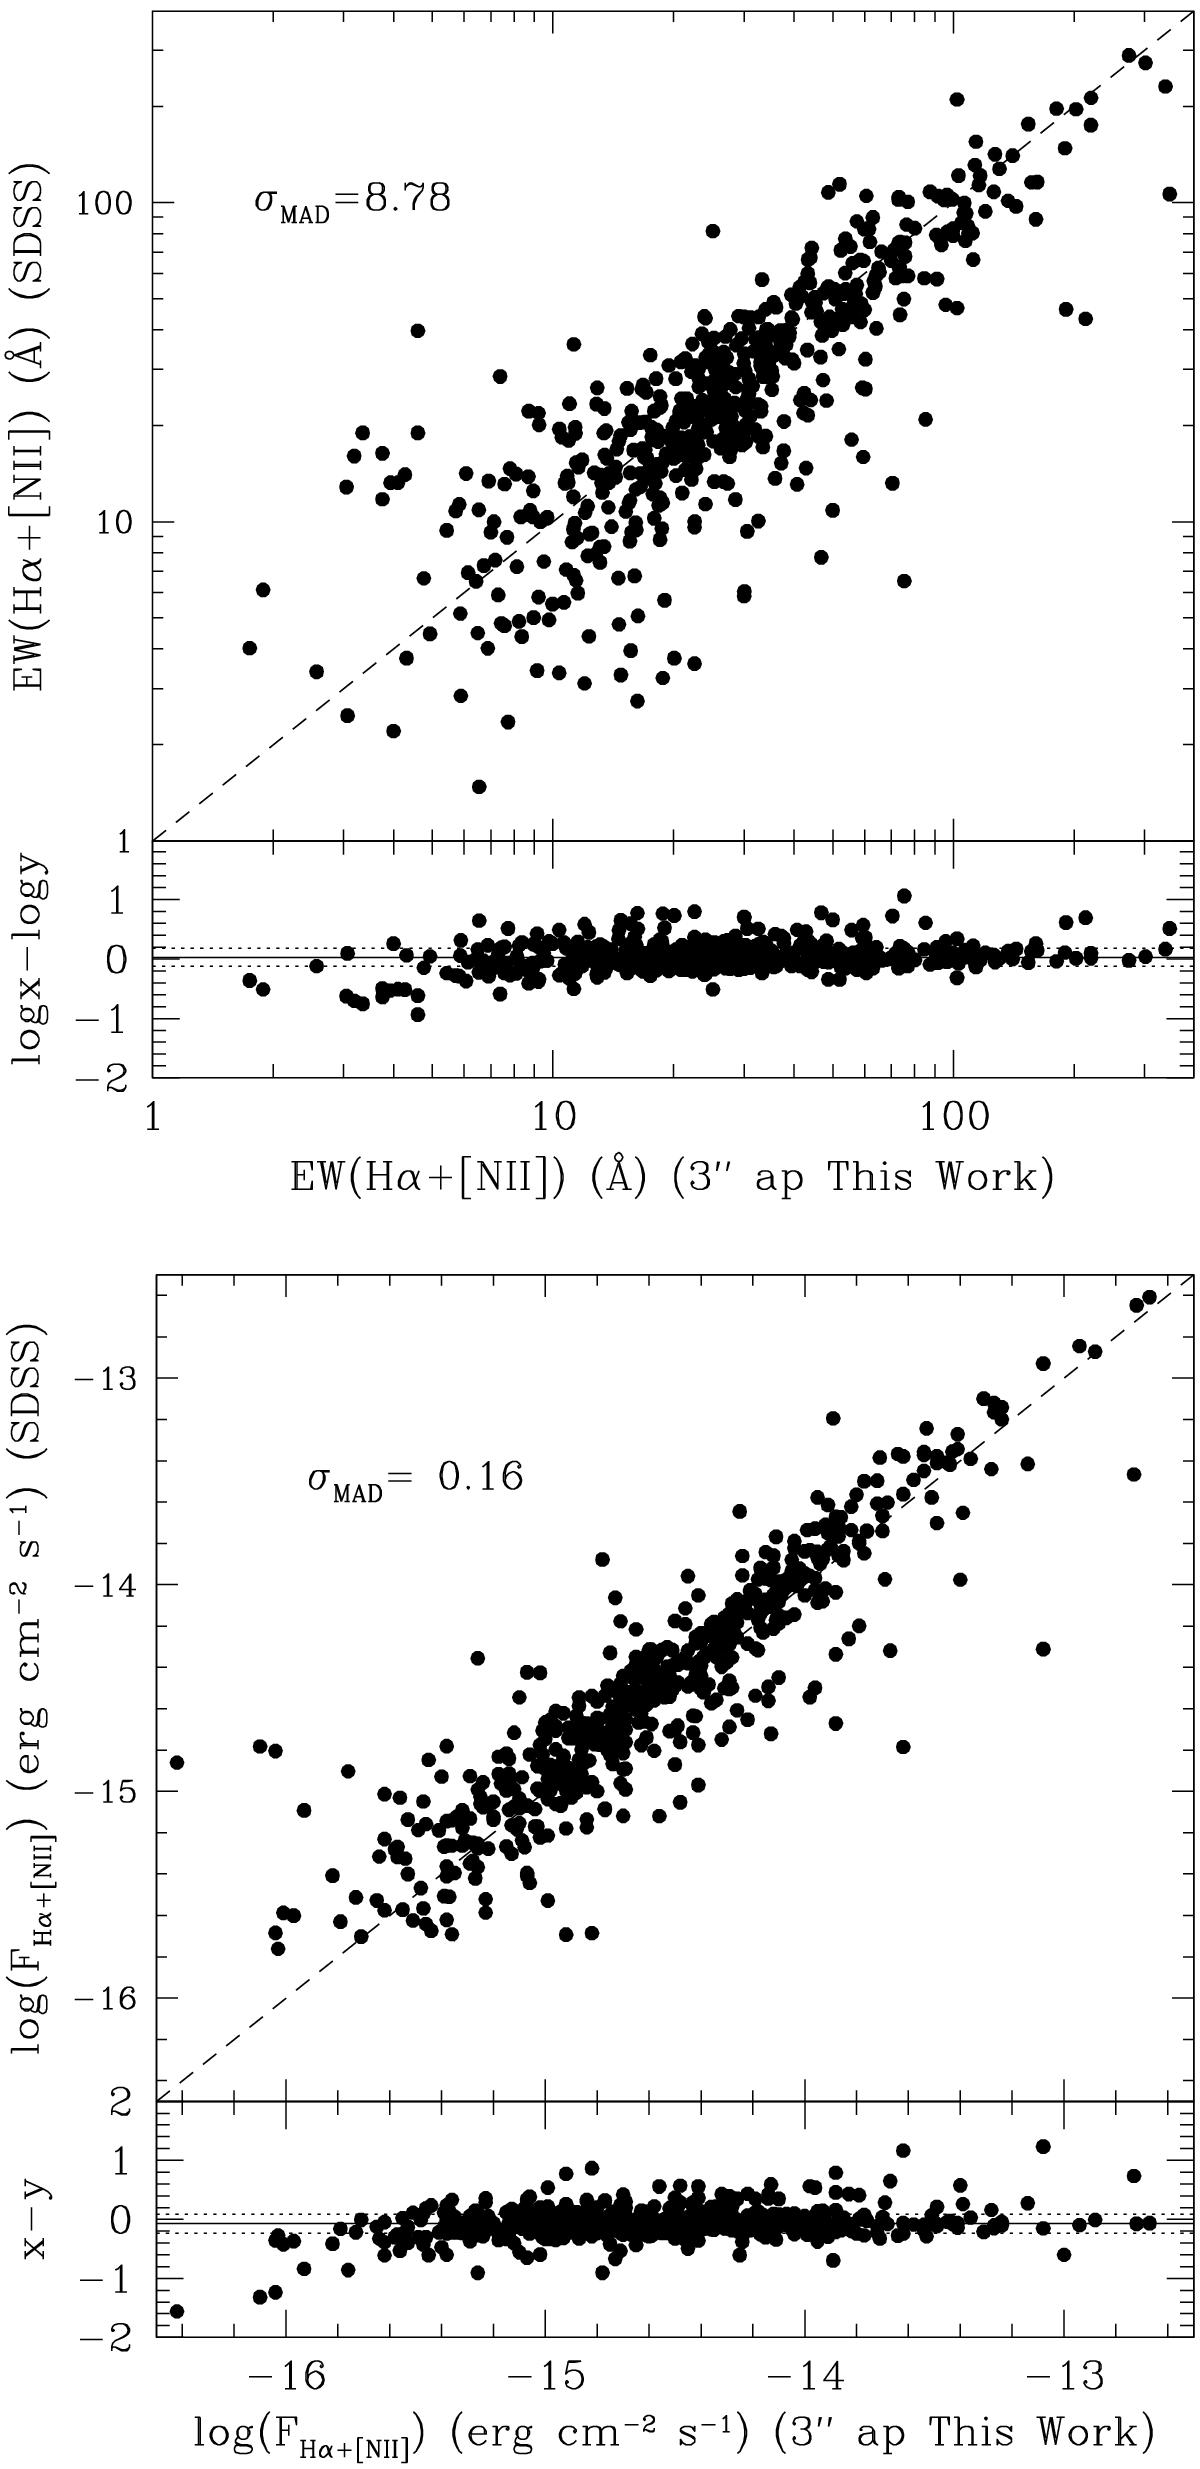
Top panel: comparison between the EW(Hα + [NII]) measured on the Hα images from this work in 3 arcsec apertures and the EW(Hα + [NII]) measured on SDSS spectra taken in 3 arcsec fibres. Bottom panel: comparison between the (Hα + [NII]) flux measured on the Hα images from this work in 3 arcsec apertures and the (Hα + [NII]) flux measured on SDSS spectra taken in 3 arcsec fibres. The dashed lines give the 1:1 relation.
Current usage metrics show cumulative count of Article Views (full-text article views including HTML views, PDF and ePub downloads, according to the available data) and Abstracts Views on Vision4Press platform.
Data correspond to usage on the plateform after 2015. The current usage metrics is available 48-96 hours after online publication and is updated daily on week days.
Initial download of the metrics may take a while.