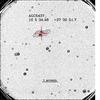
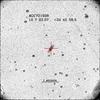
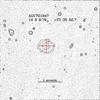
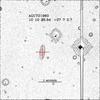
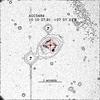
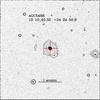
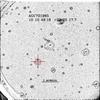
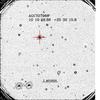
Fig. A.1
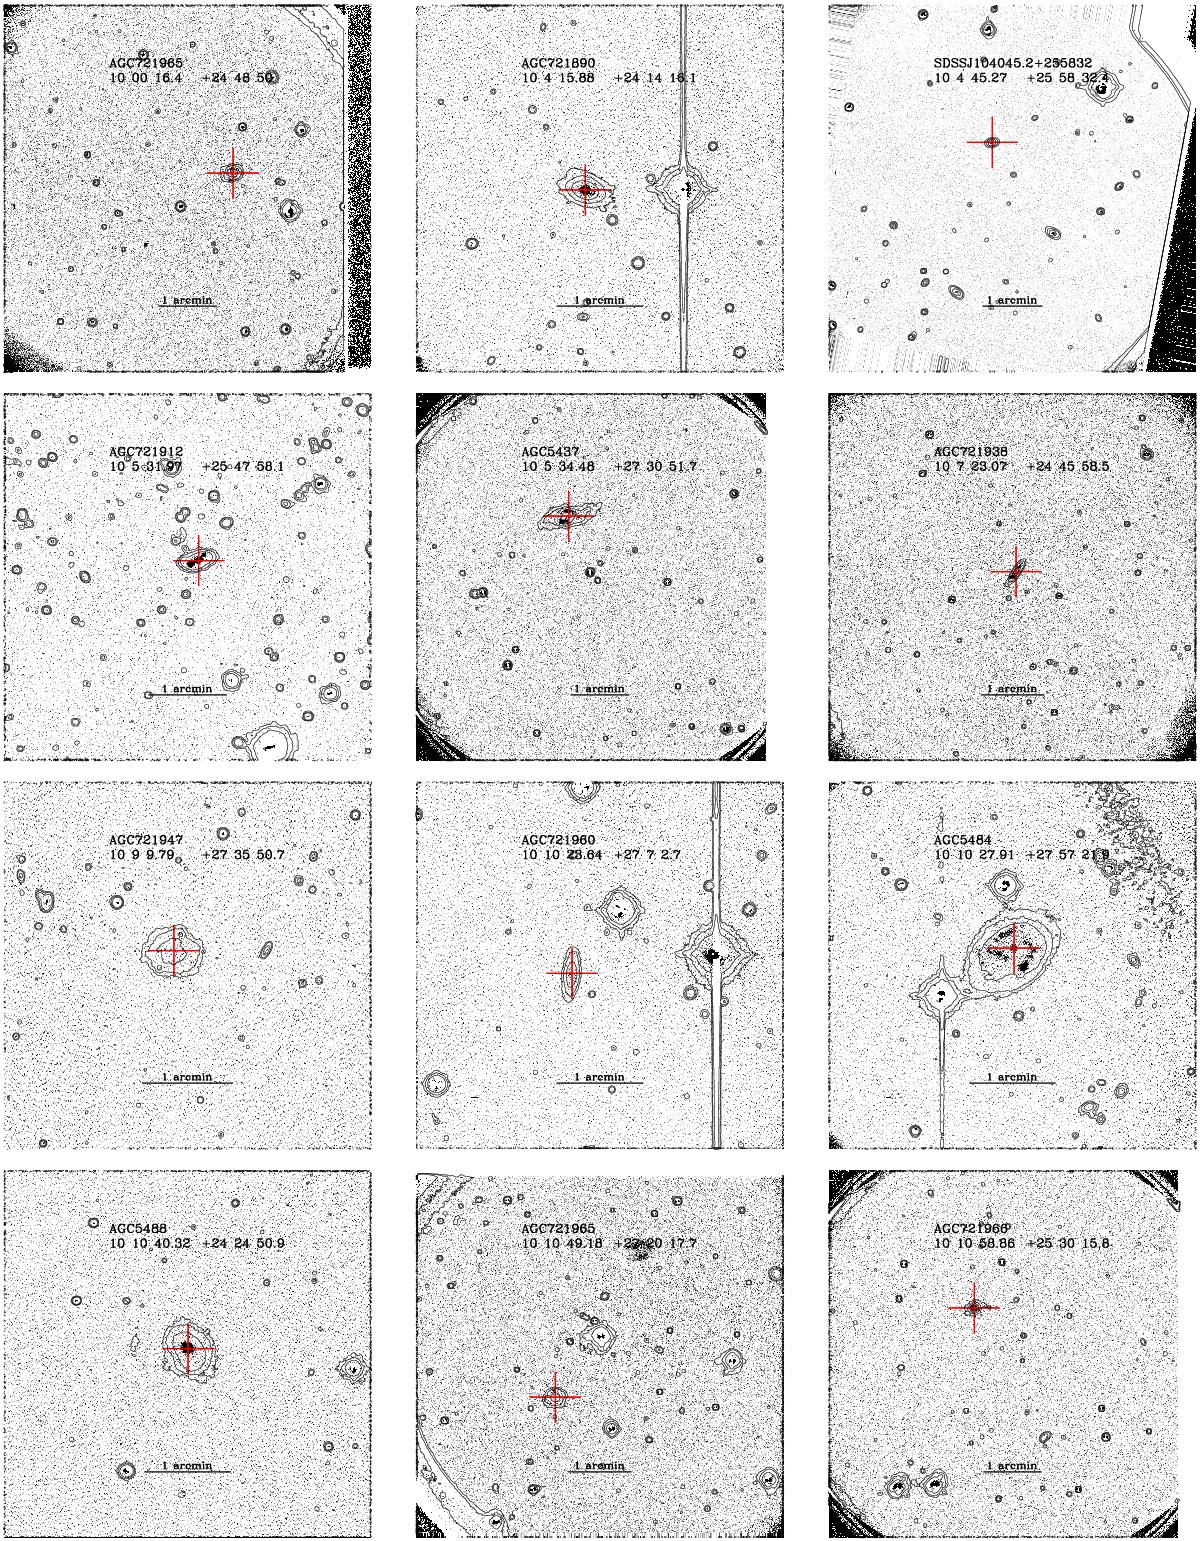
One page gallery of the atlas of 724 galaxies (red crosses) observed in Hα, identified by their celestial coordinates and, if available, by their AGC designation. The OFF-band countours are drawn at 1.5, 2.5, 5 × σ of the sky in the normalized r band images. The grey scale represents the NET flux intensity between 1 and 3 × σ of the sky in the Hα NET (continuum subtracted) frames. A 1 arcmin bar is given on all images. All 2013 images have been rotated by 10.5 or 3.5 clockwise to align the Y axes of the CCD with the North direction.

Current usage metrics show cumulative count of Article Views (full-text article views including HTML views, PDF and ePub downloads, according to the available data) and Abstracts Views on Vision4Press platform.
Data correspond to usage on the plateform after 2015. The current usage metrics is available 48-96 hours after online publication and is updated daily on week days.
Initial download of the metrics may take a while.