Fig. 7
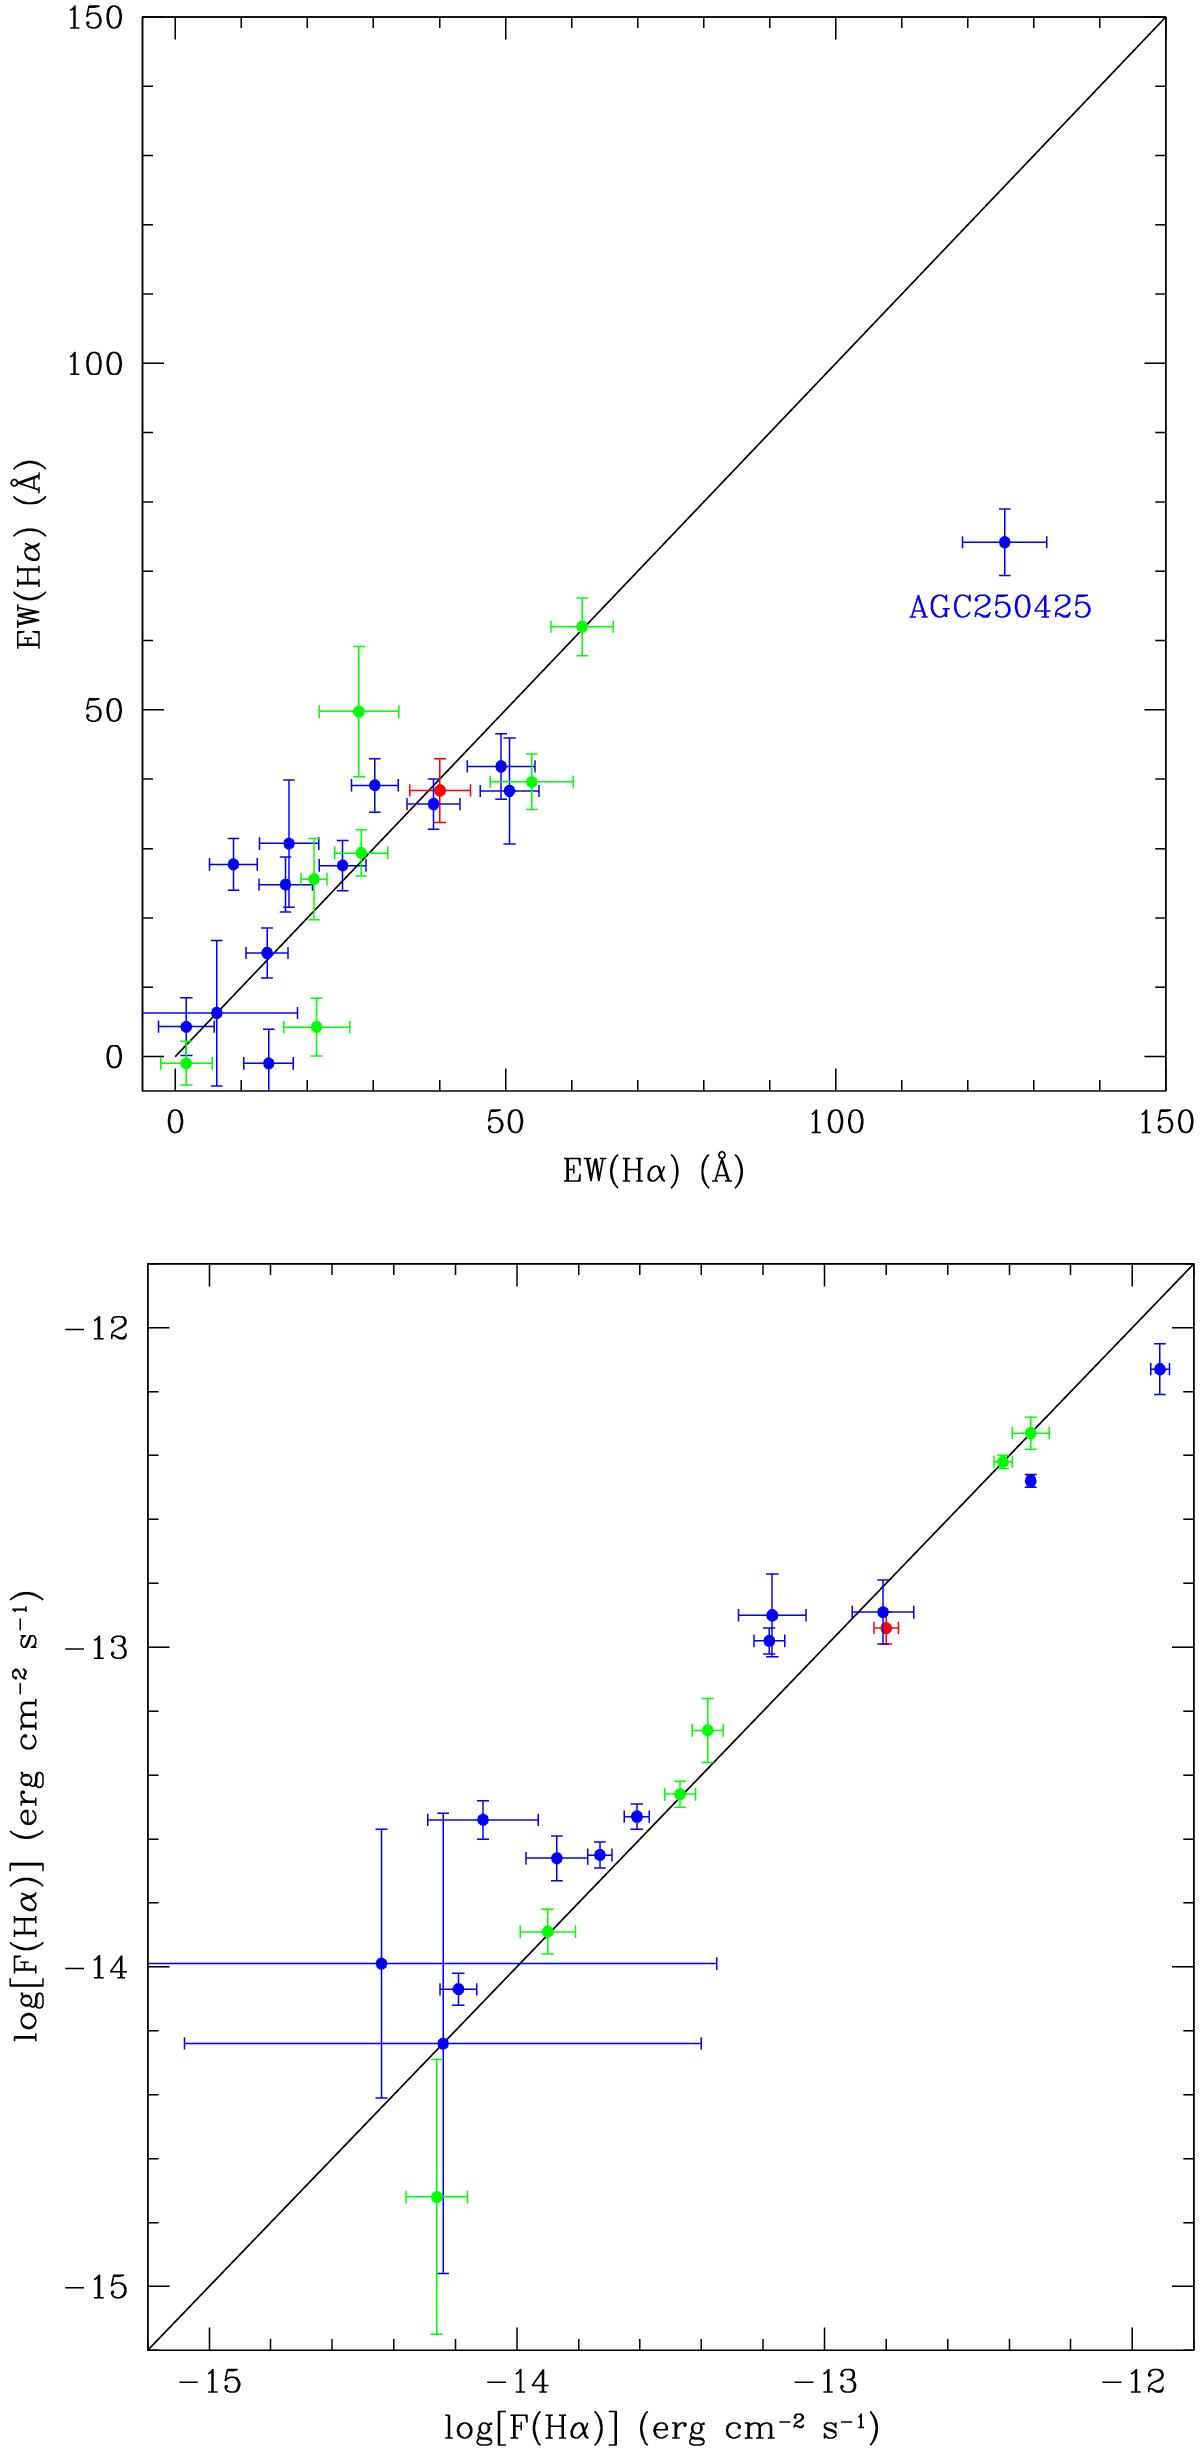
Comparison between the integrated EWHα (top panel) and Hα flux (bottom panel) repeatedly measured in different observing runs. Red symbol refers to measurements taken in April and May 2010 at the 1.5 m. Blue symbols are 1.5 m vs. 2.1 m measurements. Green symbols are 2.1 m vs. 2.1 m repeated measurements. The dashed lines give the 1:1 relation. The object with deviating EWHα was checked on SDSS nuclear spectroscopy and found to be consistent with the 2.1 m measurement.
Current usage metrics show cumulative count of Article Views (full-text article views including HTML views, PDF and ePub downloads, according to the available data) and Abstracts Views on Vision4Press platform.
Data correspond to usage on the plateform after 2015. The current usage metrics is available 48-96 hours after online publication and is updated daily on week days.
Initial download of the metrics may take a while.