Fig. 2
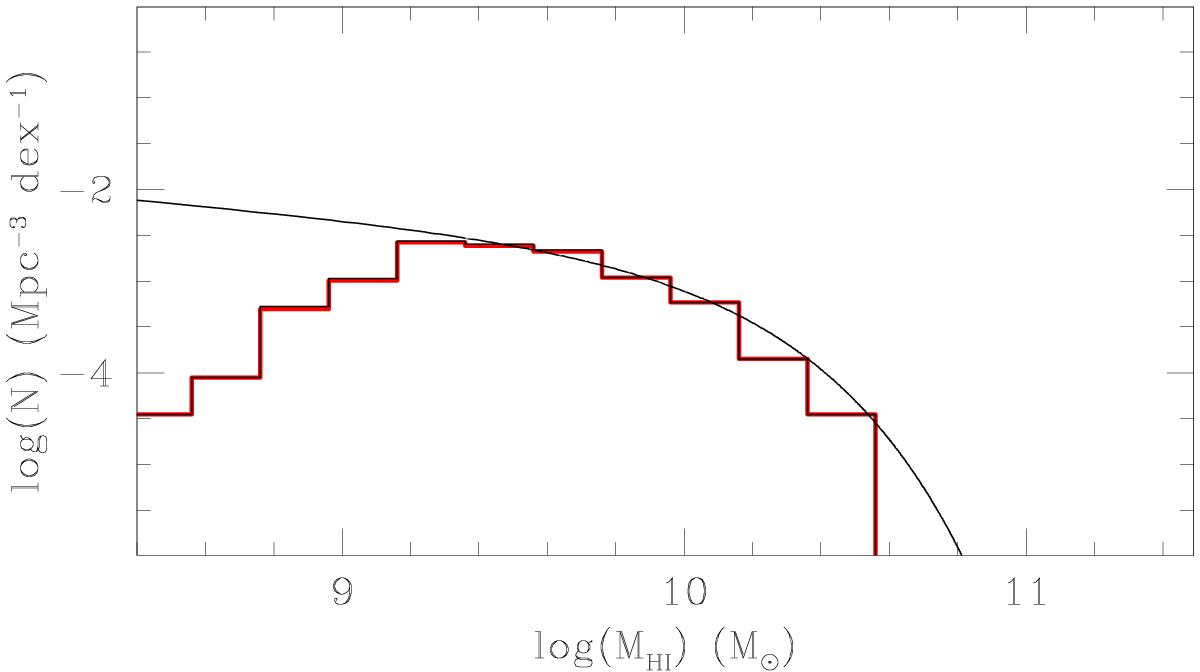
HI mass function for the 623 HI selected galaxies collected from ALFALFA in the range 3900 <cz< 9000 (km s-1) (black solid histogram). It is indistinguishable from the red solid histogram, which refers to the galaxies subject to Hα follow up observations. HI mass function of Martin et al. (2010) (black solid line). There is a lack of bright galaxies above 1010.5M⊙ because of the finite sampled volume of the Coma supercluster.
Current usage metrics show cumulative count of Article Views (full-text article views including HTML views, PDF and ePub downloads, according to the available data) and Abstracts Views on Vision4Press platform.
Data correspond to usage on the plateform after 2015. The current usage metrics is available 48-96 hours after online publication and is updated daily on week days.
Initial download of the metrics may take a while.