| Issue |
A&A
Volume 576, April 2015
|
|
|---|---|---|
| Article Number | A99 | |
| Number of page(s) | 18 | |
| Section | Interstellar and circumstellar matter | |
| DOI | https://doi.org/10.1051/0004-6361/201425113 | |
| Published online | 10 April 2015 | |
Isotopic fractionation of carbon, deuterium, and nitrogen: a full chemical study⋆
1
LERMA, Observatoire de Paris, PSL Research University, CNRS,
UMR8112,
Place Janssen,
92190
Meudon Cedex,
France
e-mail:
This email address is being protected from spambots. You need JavaScript enabled to view it.
2
Sorbonne Universités, UPMC Univ. Paris 6, 4 Place Jussieu,
75005
Paris,
France
3
ISM, Université de Bordeaux – CNRS, UMR 5255,
351 cours de la
Libération, 33405
Talence Cedex,
France
e-mail:
This email address is being protected from spambots. You need JavaScript enabled to view it.
Received: 6 October 2014
Accepted: 5 January 2015
Abstract
Context. The increased sensitivity and high spectral resolution of millimeter telescopes allow the detection of an increasing number of isotopically substituted molecules in the interstellar medium. The 14N/15N ratio is difficult to measure directly for molecules containing carbon.
Aims. Using a time-dependent gas-phase chemical model, we check the underlying hypothesis that the 13C/12C ratio of nitriles and isonitriles is equal to the elemental value.
Methods. We built a chemical network that contains D, 13C, and 15N molecular species after a careful check of the possible fractionation reactions at work in the gas phase.
Results. Model results obtained for two different physical conditions that correspond to a moderately dense cloud in an early evolutionary stage and a dense, depleted prestellar core tend to show that ammonia and its singly deuterated form are somewhat enriched in 15N, which agrees with observations. The 14N/15N ratio in N2H+ is found to be close to the elemental value, in contrast to previous models that obtain a significant enrichment, because we found that the fractionation reaction between 15N and N2H+ has a barrier in the entrance channel. The high values of the N2H+/15NNH+ and N2H+/N15NH+ ratios derived in L1544 cannot be reproduced in our model. Finally, we find that nitriles and isonitriles are in fact significantly depleted in 13C, thereby challenging previous interpretations of observed C15N, HC15N, and H15NC abundances from 13C containing isotopologues.
Key words: astrochemistry / molecular processes / ISM: molecules / ISM: clouds
Appendices are available in electronic form at http://www.aanda.org
© ESO, 2015
1. Introduction
Understanding isotopic abundances on a large scale is a major goal that has received a great deal of attention for its application to terrestrial environments (ocean, meteorites), the solar system (planets, comets), and galactic interstellar space. The variation in isotopic ratios may give us some information about the link between solar system objects and galactic interstellar environments as discussed by Aléon (2010). We mainly focus our study on interstellar environments where low-temperature conditions may significantly affect the isotopic ratios of the molecular content. Isotopic molecules are detected in a variety of environments and offer an additional tool for determining physical conditions because they usually do not suffer from opacity problems.
Early modeling studies of 13C and 18O isotopic enrichment were performed by Langer et al. (1984), who introduced different isotopic exchange reactions, relying on previous theoretical and experimental studies by Watson et al. (1976) and Smith & Adams (1980). The possible effects of selective photodissociation of CO have subsequently been emphasized (Glassgold et al. 1985; Le Bourlot et al. 1993; Visser et al. 2009), which tend to increase the CO/13CO ratio. The use of the CN radical as a tracer of 12C/13C isotopic ratio has been raised by Savage et al. (2002), Milam et al. (2005), who studied the corresponding gradient as a function of the galactic distance. The actual value of the 12C/13C isotopic ratio in the local interstellar medium (ISM) is assumed to be 68 (Milam et al. 2005).
The possibility of nitrogen isotopic fractionation in interstellar clouds has been investigated by Terzieva & Herbst (2000), who suggest various 15N isotopic exchange reactions. Rodgers & Charnley (2004, 2008a,b) used these suggested reaction-rate constants to predict nitrogen isotopic fractionation in chemical models of dense interstellar molecular cores. They specifically discussed the role of the atomic-to-molecular nitrogen ratio in the fractionation process and the possible link between nitrogen hydrides and CN containing molecules (nitriles). The corresponding observations are sparse, however, and difficult because the elemental 14N/15N ratio is high (441 ± 5), as determined by the recent Genesis solar wind sampling measurement (Marty et al. 2011), and is assumed to hold in the local ISM.
In addition, the zero point energy (ZPE) differences involved in nitrogen fractionation reactions are small, and the predicted corresponding chemical enrichment is moderate. Lucas & Liszt (1998) report HC15N absorption in diffuse clouds located in front of distant quasars with a HCN/HC15N ratio of 270 ± 27, close to value reported for the Earth. However, various new observations of isotopic nitrogen containing molecules have been reported, including 15N substituted ammonia and deuterated ammonia (Gerin et al. 2009; Lis et al. 2010), the diazenylium ion (N2H+; Bizzocchi et al. 2010, 2013; Daniel et al. 2014), CN and HCN (Ikeda et al. 2002; Pillai et al. 2007; Adande & Ziurys 2012; Hily-Blant et al. 2013b; Daniel et al. 2014), HCN and HNC (Wampfler et al. 2014). The strong depletion found in 15N variants of the N2H+ isotopologue strongly contradicts model predictions (Gerin et al. 2009), which motivates a reinvestigation of the chemical processes at work. With this in mind, the link between deuterated chemistry and the possible role of ortho/para molecular hydrogen has been studied by Wirström et al. (2012).
We analyze in Sect. 2 the various possible isotopic exchange reactions that are involved for molecules containing carbon and nitrogen. Indeed, most nitrogen-fractionation observational results for CN-containing molecules involve only 13C and 15N species so that the measure of the nitrogen isotopic ratio assumes a fixed 12C/13C fraction. We examine and extend the pioneering study of Terzieva & Herbst (2000) and check for the possible presence of barriers in the entrance channels of isotopic exchange reactions through theoretical calculations. We also update the ZPE values involved and derive the corresponding exothermicity values. We present our new chemical model in Sect. 3 and compare it with available observations and other models. Our conclusions are presented in Sect. 5.
2. Chemical reactions involving isotopic substitutes of 12C and 14N
2.1. 13C and 15N exchange reactions
At very low temperatures, isotopic exchange reactions may only occur if no barrier is present between the interacting atoms, ions, and molecules or if tunnelling plays an important role. Experimental information is crucial, and we constrain the evaluation of rate constants using that information. If no experimental data are available, we apply theoretical methods to determine the presence of a barrier: A first technique uses density functional theory (DFT) calculations with the hybrid M06-2X functional developed by Zhao & Truhlar (2008), which is well suited to thermochemical calculations, associated to the cc-pVTZ basis set using GAUSSIAN09 software.The alternative is provided by the MRCI+Q method (with the aug-cc-pVTZ basis set). For barrierless cases, we derive the reaction rate constants by using a simple capture theory (Georgievskii & Klippenstein 2005) for both ion-neutral and neutral-neutral reactions. We consider four different families of isotopic exchange reactions:
-
A: direct reactions. The proton transfer in the N2H+ + N15N → N15NH+ + N2 reaction can serve as an example. In this case and for reactions without a barrier, the reaction rate coefficient of the forward reaction is equal to the capture-rate constant multiplied by a probability factor f(B, M), f(B,M) depending on the rotational constant, mass, and symmetry values of the reactants and products. In reactions involving 15N and 13C, the mass ratio of reactants and products are very close, and f(B,M) ≅ σentrance channel/σexit channels. (The symmetry number σ is equal to the number of pathways.) The reverse reaction is calculated from the equilibrium constant K, as in Terzieva & Herbst (2000): K = kf/kr = f(B,M) × exp(ΔE/kT).
-
B: reactions involving adduct formation and leading to direct products without isomerization. As an example, we refer to 15N+ + N2 → N15N + 14N+. We first assume that the high pressure rate constant is equal to the capture rate constant (for reactions without a barrier). We apply statistical theory for the system at thermal equilibrium so that kf + kr = kcapture. From the equilibrium constant expression, we then derive
![Mathematical equation: \hbox{$ k_{\rm f}= k_{\rm capture} \times \frac{f(B,M)}{[ f(B,M) + \exp(- \Delta E/kT)] }$}](/articles/aa/full_html/2015/04/aa25113-14/aa25113-14-eq21.png) and
and ![Mathematical equation: \hbox{$ k_{\rm r}= k_{\rm capture} \times \frac{\exp(- \Delta E/kT)}{[f(B,M) +\exp(- \Delta E/kT)]}$}](/articles/aa/full_html/2015/04/aa25113-14/aa25113-14-eq22.png) .
. -
C: reactions involving adduct formation with isomerization pathways. Such a case holds for 13C + HCN → 12C + H13CN. We again assume that the high pressure rate constant is given by capture theory (for reactions without a barrier). The isotopic isomerization reaction competes with the dissociation of the adduct. The rate constant depends on the location of the transition state, and statistical calculations are generally required to estimate the isomerization reaction rate constant.
-
D: other reactive exothermic channels. The exchange reaction is generally discarded. (The possibility of N atom exchange in the 15N + CN and in 15N + C2N reactions is discussed.)
The knowledge of the exoergicity values ΔE is also a major concern. They are obtained from the differences of the ZPEs between products and reactants. We recall the corresponding expressions in Appendix B and derive their values by using the most recent determinations of spectroscopic constants reported in Tables B.2–B.4.
We summarize in Table 1 the different isotopic exchange reactions considered and display the corresponding reaction rate constants. Detailed information is provided in Appendix A on the theoretical methods used for the different systems. The reactions involving 15N are displayed in the upper part of the table. We also consider 13C isotopic exchange reactions in the lower part of Table 1.
Isotopic exchange reactions.
Table 1 shows two main discrepancies compared to previous studies by Terzieva & Herbst (2000). The exchange reactions between atomic 15N and N2H+ as well as with HCNH+are found to be unlikely to occur because significant barriers arise in the complex formation step. A similar result is obtained for 15N+ exchange with NO, whereas these reactions had been included in Terzieva & Herbst (2000). The exchange reaction between atomic 15N and CN, which was suggested by Rodgers & Charnley (2008a), is found to be plausible. Additional exchange possibilities have also been considered, such as the reaction between 15N and C2N. As far as 13C possible fractionation is concerned, we find that CN could be enriched in 13C through the exchange reactions of CN with 13C and 13C+. However, such a mechanism does not hold for HNC because atomic carbon is found to react with HNC (Loison et al. 2014). 13C enrichment of HCN is also found to be unlikely since the calculated transition state lies above the entrance level in the hypothetical isomerization process (C mechanism).
2.2. Ammonia synthesis
Ammonia synthesis proceeds mainly through a chain of reactions starting with 14N+ and H2, because the reaction between N and H3+ has been shown to be inefficient (Milligan et al. 2000).
2.2.1. The 14N+ + H2 reaction and isotopic substitutions
This almost thermoneutral reaction deserves a special mention and has received considerable attention. Le Bourlot (1991) first pointed out the possible role of ortho-H2 in the interstellar chemistry of ammonia based on the energy of its J = 1 rotational level almost compensating for the small endothermicity of the reaction 14N+ + H2 → NH+ + H. Dislaire et al. (2012) subsequently reanalyzed the experimental data (Marquette et al. 1988) and suggest new separate expressions for the reaction rate with p-H2 and o-H2. Similar results were obtained by Zymak et al. (2013), who also emphasized the possible role of the fine structure level of 14N+. We follow the prescription derived by Dislaire et al. (2012) and extend their analysis to deuterated forms and those including 15N, as displayed in Table 2. In the case of 15N substituted compounds, we have taken the (small) additional term due to the change in ZPE into account.
Reaction rate coefficients of N+ + H2 and isotopic variants.
These expressions should be used with caution because in their kinetic expression, we consider that the exponential term represents the enthalpy difference between the products and reactants. The capture rate constant of 15N+ + HD reaction is about (2/3)0.5 less than the rate of the 15N+ + H2 reaction, owing to the different mass dependences. The formation of 15ND+ is favored at low temperatures.
2.2.2. NH + H2
+ H2
The final step of ion-molecule reactions leading to ammonia formation is the reaction between NH and H2, giving NH
 . Although exothermic, this reaction has a strong temperature dependence, displaying a minimum at T ~ 100 K and a slow increase at lower temperatures (Barlow & Dunn 1987), which is interpreted by the presence of a barrier to complex formation, as discussed in Herbst et al. (1991). At temperatures close to 10 K, the reaction is likely to proceed through tunneling that may take place or H atom abstraction. However, the NH reaction with D2 is found to be slower when the temperature decreases because tunneling is not efficient with deuterium. We thus reconsider the isotopic variants of this reaction, as shown in Table 3, where we give the present reaction rates compared to previous values derived from Anicich & Huntress (1986). These values are indeed different from those used in our previous studies (Roueff et al. 2005) where we assumed the same rate for the channels resulting from the reactions of NH and isotopologues with HD, based on pure statistical considerations. We discuss the resulting modifications in Sect. 3.
Reaction rate coefficients of NH + H2 and isotopic variants at T = 10 K.
Identical reaction rate coefficients are used for the 15N isotopically substituted reactions.
3. Models
3.1. General features
Chemical reactions involving nitrogen atoms and CH, CN, and OH have been studied experimentally and shown to be less efficient than previously thought at low temperatures (Daranlot et al. 2012, 2013), which was confirmed by theoretical studies. The corresponding reaction rate constants have been implemented in the KIDA chemical data base (Wakelam et al. 2013), and we updated our chemical network accordingly. We also include the reactions discussed in Loison et al. (2014) in their study of HCN/HNC chemistry. We explicitly include deuterium, 13C, and 15N molecular compounds in our chemical network. The reactions displayed in Table 1, have been included, which allows us to test the hypothesis of a constant 12C/13C isotopic ratio to derive the 14N/15N ratio in C15N containing molecules. We take the role of the ortho/para ratio of molecular H2 into account in the H2D+ + H2 and 14N+ (15N+) + H2 chemical reactions in an approximate way: we did not compute the full ortho/para equilibrium as in the models of Flower et al. (2006), Pagani et al. (2011), Faure et al. (2013) and instead introduce it as a model parameter, which can be varied. Faure et al. (2013) have found a value of 10-3 for temperatures below 15 K.
Apart from exchange reactions, reactions involving isotopic molecules are assumed to have the same total rate constant as those involving the main isotope except for the reaction of 15N+ with H2/HD/D2. The various reaction channels are obtained from statistical considerations, in the absence of experimental information. We restrict carbon-containing molecules to three carbon atoms, nitrogen-containing molecules to two nitrogen atoms, and consider full deuteration as in our previous studies (Roueff et al. 2005). Within these constraints, the number of species considered in the model is 307 linked through more than 5400 chemical reactions.
Model definitions.
We consider two different models as displayed in Table 4. Model (a) may be considered as a template of TMC1, and it assumes a density of hydrogen nuclei nH = 2 × 104 cm-3. The elemental abundance of carbon relative to hydrogen nuclei is taken as 4.15 × 10⁻⁵ to reproduce the derived relative abundance of CO (Ohishi et al. 1992). We derive the oxygen elemental abundance by imposing a C/O ratio of 0.7 appropriate for TMC1 and take the nitrogen elemental abundance used by Le Gal et al. (2014) in their work on nitrogen chemistry. The elemental abundance of sulfur is not well constrained, and we have taken the low metal case value of 8.0 × 10⁻⁸. Model (b) is more representative of a prestellar core with a density of 2 × 105 cm-3 similar to L134N or Barnard 1 (B1) where the elemental abundances of carbon, oxygen, and nitrogen are reduced by a factor of 3 to account for depletion. T = 10 K in both cases and the cosmic ionization rate ζ per H2 is 1.3 × 10⁻¹⁷ s-1 as in Le Gal et al. (2014).
3.2. Results
We summarize our results obtained with a 10-3 value of the o/p ratio of H2 in Table 5 and give some observational values for comparison. Time-dependent effects may be visualized from the values reported at 106 years and at steady state for model (a). Steady state is reached after a few 107 and 106 years for models (a) and (b), respectively. Since there are fewer 15N enrichment reactions than previously assumed (Terzieva & Herbst 2000), most nitrogen containing species are found to have isotopic abundance ratios close to the solar value (14N/15N = 440) given by the Genesis mission (Marty et al. 2011).
Model (a) and (b) results and observations. ss means stationary state. The value of the o/p ratio of H2 is taken as 10-3.
4. Discussion
We display the time dependence of various isotopic ratios and fractional abundances relative to H2 and discuss the chemical behavior involved in the fractionation processes for the two reported models. We first consider in Fig. 1 the reservoirs of nitrogen, atomic, and molecular nitrogen, as well as N2H+ ions that are chemically linked to N2.
 |
Fig. 1 Upper panel: time dependence of N/15N isotopic ratios in atomic and molecular nitrogen and N2H+ ions. a) and b) correspond to the models defined in Table 4; the black heavy dotted line represents the elemental N/15N. Lower panel: time dependence of the fractional abundances relative to H2 of N, N2, and N2H+ for models (a) and (b). The value reported for N2H+ towards TMC1 (Ohishi et al. 1992) is displayed as a horizontal green dashed line. |
Atomic nitrogen becomes depleted in 15N after about 105 years, whereas molecular nitrogen is slightly enriched. These evolution times are also required to build significant amounts of molecular compounds, which compare satisfactorily with available observations. The overall dependence of N2H+ follows closely that of N2 as it is formed from the N2 + H3+ reaction, with a slight decoupling between 15NNH+ and N15NH+ at long evolution times. We find that the isotopic ratio of the N2H+ ions displays an almost constant value close to the solar value after some 105 years. They are in good agreement with observations in B1 but disagree by a factor of 2 for L1544. The trend that 15NNH+ is less abundant than N15NH+ is reproduced in our results as a result of the differences of endothermicity in their reactions with N2. We checked that introducing 15N2 and species containing two 15N atoms had no effect on these ratios. We could not find any gas-phase mechanism able to generate such a high ratio in prestellar core conditions. The high isotopic ratio found in L1544 implies an equivalently high ratio for molecular nitrogen, which strongly contradicts our findings. These results are markedly different from those derived by Hily-Blant et al. (2013b), who find a moderate 15N enrichment, because these authors introduced the 15N + N2H+ fractionation reaction, which does not occur1.
4.1. Nitrogen hydrides
We display in Fig. 2 the time evolution of the isotopic ratios of nitrogen hydrides and of their fractional abundances relative to H2. NH3 and NH2 show very similar behavior in that they both result from the reaction chain starting with the 14N+ + H2 reactions.
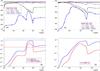 |
Fig. 2 Upper panel: time dependence of N/15N isotopic ratios in nitrogen hydrides. a) and b) correspond to the models defined in Table 4; The black heavy dotted line represents the elemental N/15N. Lower panel: time dependence of the fractional abundances relative to H2 of NH, NH2, NH3, and NH2D for models (a) and (b). The values reported for NH3 (Ohishi et al. 1992) and NH2D (Tiné et al. 2000) towards TMC1 are displayed as horizontal blue and red dashed lines, respectively, in the left panel. |
The species NH2 and NH3 are found to be enriched in 15N owing to the 15N+ + o-H2 reaction, which has a slightly weaker endothermicity, as reported in Table 2, than the corresponding 14N+ + o-H2 reaction, a difference which slightly favors 15NH+ formation. Nevertheless, despite the large uncertainties regarding the rate of the N+ + H2 reaction, our results are in fair agreement with the results of Daniel et al. (2014) for prestellar core B1. Since the N+ + HD → ND+ + H reaction has weaker endothermicity than the N+ + H2→ NH+ + H reaction, the modeled 14NH2D/15NH2D ratio behaves somewhat differently than the 14NH3/15NH3 ratio. The ratio exhibits large variations around 105 years and decreases below that of NH3 at long times and at steady state.
The observed values are compatible with calculations at sufficiently long times. The values of this ratio reported in Gerin et al. (2009) have been found to be too high as a result of assuming a single excitation rotational temperature. The future availability of collisional excitation rates of NH2D by H2 (Daniel et al. 2014) may give rise to additional changes. NH does not follow the same trend as NH2 and NH3 and is only slightly enriched in 15N. As discussed by Hily-Blant et al. (2013b), NH is mainly formed from the dissociative recombination (DR) of N2H+, a reaction that has been recently revisited by Vigren et al. (2012), who derive a branching ratio towards a NH of 7%. We checked that this analysis still holds for model (b) even if the reaction of N2H+ with CO becomes more efficient. The formation route of NH through NH recombination may take over for highly depleted CO.
4.2. Nitriles and isonitriles
Deriving 15N isotopic ratios of CN, HCN, and HNC from observations is a difficult challenge because the transitions of the main isotopologues are optically thick. Then, most of the reported observational values of the 14N/15N molecular ratios are obtained from the ratios of the minor isotopologues 13CN/C15N, H13CN/HC15N, and HN13C/H15NC, which is subsequently multiplied by an assumed C/13C value, usually taken as 68 (Milam et al. 2005).
4.2.1. 13C/15N ratios
We test these hypotheses in our models by explicitly introducing fractionation reactions of 13C, as discussed in Sect. 2. Table 5 shows that the 13C isotopic ratios of CN, HCN, and HNC vary both with time and density.
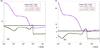 |
Fig. 3 Time evolution of 13C/15N ratios in CN, HCN, and HNC for models (a) and (b). The 13C/15N elemental ratio is displayed as a heavy dotted line. |
Figure 3 displays the 13CN/C15N, H13CN/HC15N, and HN13C/H15NC ratios as a function of time for the two considered models. The deviation from the elemental ratio of 6.48 is significant for HCN, HNC, and CN.
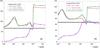 |
Fig. 4 Time dependence of C/13C isotopic ratios in CN, HCN, and HNC. a) and b) correspond to the models defined in Table 4. |
 |
Fig. 5 Upper panel: time dependence of C/13C isotopic ratios in C, CH, CO, and HCO+. The black heavy dotted line represents the elemental 12C/13C. Lower panel: time dependence of the fractional abundances relative to H2 of C, 12C+, CO, CH, and HCO+, for models (a) and (b). The observational values towards TMC1 (Ohishi et al. 1992) are displayed as horizontal dashed lines with corresponding colors in the left panel. a) and b) correspond to the models defined in Table 4. |
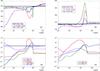 |
Fig. 6 Time dependence of N/15N isotopic ratios in CN, HCN, HNC, and NO. a) and b) correspond to the models defined in Table 4. |
 |
Fig. 7 Time dependence of CN, HCN, HNC, and their isotopologues. a) and b) correspond to the models defined in Table 4. |
4.2.2. 13C chemistry
We now consider the time dependences of the 12C/13C isotopic ratios in CN, HCN, and HNC species as displayed in Fig. 4. The time-dependent ratio displays large variations, because there are various reactions incorporating 13C in the molecules. The elemental value of the ratio (68) is fulfilled in a narrow range around 1 Myr for model (a) and 2 × 10⁵ y for model (b), but steady state values are significantly different except for CN. This relatively complex behavior results from the many different reaction channels involved in 13C chemistry. We then also consider other 13C containing species and display the 12C/13C ratio in C, CH, CO, and HCO+ in Fig. 5, as well as their fractional abundances relative to H2. The 12C/13C isotopic ratios of the various molecules are highly dependent on the evolution time. The transition from gas-phase atomic carbon towards CO controls the 13C enrichment. As long as there is still a relatively high carbon-atom concentration in the gas phase, there is enough free 13C to allow strong enrichment of CN through the 13C + CN reaction. When CO molecules become the reservoir of carbon, even if in that case the 13C concentration is low, the 13C+ + 12CO →12C+ + 13CO reaction still leads to a small 13CO enrichment (Langer & Penzias 1990; Milam et al. 2005). Although this small excess is not measurable in CO, significant amounts of 13C are locked up in CO, and most of the other carbon containing species become depleted in 13C, as found for CH and other carbon chains. This effect is seen in Fig. 5 for the isotopic ratio of CH in model (a) at steady state where CO is slightly enriched, leading to a significant depletion of 13C in CH. Our results for C and HCO+ are similar to those of Furuya et al. (2011), who studied the 13C fractionation of multiple carbon chains by explicitly introducing the dependence of the 13C position in the chain. We see that HCO+ is marginally enriched in 13C at steady state, whereas HCN and HNC are significantly depleted in 13C. We also note that CN and HCO+ may react via proton transfer to give CO + HNC+, and have checked, at the DFT level, the absence of any barrier. The corresponding reaction rate is 2.2 × 10⁻⁹ ( )-0.4 cm3 s-1 when using the capture rate theory. This reaction has not been included in any chemical database up to now.
HNC has recently been shown to react with atomic carbon (Loison et al. 2014), which leads to the different steady state isotopic ratios obtained for HCN and HNC. The CN chemistry is then somewhat decoupled from that of HCN and HNC. HCN and HNC are formed at relatively long times via CN + H3+→ HNC+/HCN+ + H2, followed immediately by HNC+ + H2→ HCNH+ + H, giving back HCN and HNC via DR (Mendes et al. 2012). With the adopted elemental abundances, the main CN destruction reactions are, however, O + CN and N + CN so that the HCNH+/HCN+/HNC+/HCN/HNC/CN network is not a closed system in contrast to models including coupled gas-grain chemistry (Loison et al. 2014).
4.2.3. 15N fractionation
We now display the N/15N fractionation in nitriles, as well as that of NO in Fig. 6. The time dependences of the isotopic ratios are markedly different in the two models, except for NO. Whereas CN, HCN, and HNC are somewhat enriched in 15N for model (a) both at intermediates times and steady state, the opposite result is obtained in model (b) after 105 years. We also display the time dependences of the fractional abundances of these molecules in Fig. 7 in order to better understand the previously described differences observed in the various fractionation ratios.
Our model (a) is intended to be representative of TMC1, a moderately dense cloud in an early evolutionary stage. We see that the various abundances and ratios are very sensitive to the chosen “age”, which is assumed to be the relevant chemical evolution time. Considering a TMC1 age of 1 Myr leads to reasonable agreement with the sparse observations available, see Table 5. Model (b) is more likely to be representative of a denser evolved molecular cloud, such as L134N, L1544, and Barnard B1, where elemental C, O, and N are partially depleted through sticking on grains. Steady state values obtained with significant depletion conditions (Roueff et al. 2005) may be used as corresponding proxies. We see that ammonia isotopologues are satisfactorily accounted for in our model. The agreement between observed and calculated 13C/15N ratios is somewhat misleading since the modeled value mainly results from a significant depletion in the 13C species. The ratios involving N/15N are found close to the elemental value in our model (b) at steady state (although NH2 and NH3 are somewhat enriched in 15N through the 15N+ + H2 reaction as explained in Sect. 4.1), which agrees with the fact that no significant gas phase fractionation mechanisms have been found. The occurrence of low ratios in B1 observations (Daniel et al. 2014), if real, implies other mechanisms at work. An obvious suggestion lies in the processes involved in adsorption on grains and possible surface reactions.
4.3. Role of the H2 ortho-to-para ratio
We now test the role of the value of the ortho/para ratio of molecular hydrogen (OPR) in the context of ammonia chemistry and fractionation determination. We ran two additional models in the frame of models (a) and (b) by changing the OPR by a factor of 10 both upward and downward. The abundances of p-H2 and o-H2 are expressed as n(p-H2) =  n(H2) and n(o-H2) =
 n(H2), respectively. In addition to the reaction of H2 with 14N+ (15N+), this ratio is introduced into the reverse reaction of the fractionation of H3+, namely the H2D++ H2 reaction that plays a significant role in the deuterium fractionation of various molecules (Pagani et al. 2011) as shown below:

with k1 = 2.0 × 10⁻⁹× exp(–232/T) and k2 = 2.0 × 10⁻⁹ × exp(−61.5 /T).
Dependence of the fractionation ratios on the o/p ratio of H2 for model (a), where ss means stationary state.
Dependence of the fractionation ratios on the o/p ratio of H2 for model (b) at steady state.
Tables 6 and 7 display the fractionation values for the three different assumed values of the OPR for models (a) and (b), and Figs. 8 and 9 display the corresponding time evolutions. We see that the curves are almost superposable for times less than 1 Myr for model (a) and less than several 105 y for model (b). The variations are significant at steady state. We find that the competition between the destruction channels of 14N+ through its reactions with o-H2 and CO plays a major role. If o-H2 is the most efficient destruction channel, which typically occurs for OPR > 200 × xCO at 10 K, where xCO is the fractional abundance of CO relative to H2, formation of NH proceeds efficiently. In the opposite case, 14N+ is mainly destroyed through reaction with CO to yield CO+, leading rapidly to HCO+ and NO+ (which does not react with H2). Since the DR rate coefficients of polyatomic ions increase significantly for larger polyatomic ions (the NH + e− reaction is three times more rapid than HCO+ + e− and twenty times more rapid than H3+ + e−), these two different channels affect the electron abundances and then many other species.
Moreover, the reaction between NH3 and H3+ leads to NH + H2. NH then reacts mainly with electrons, returning back to NH3, which subsequently converts to NH, amplifying the electron loss through DR. These effects occur when CO becomes the main carbon reservoir, for sufficiently long evolution times. As a result, the electron fraction is found to decrease when the OPR increases at long evolution times and at steady state. The decreasing electron abundance with increasing OPR values acts to diminish the effect of all DR reactions and, as a result, to increase the abundances of H3+ and H2D+ since DR is the main destruction channel in our conditions. The abundance of H2D+ is even more enhanced through the H3+ + HD reaction. Then the abundances of other deuterated molecular ions produced through deuteron transfer reactions of abundant neutrals with H2D+ are increased as well, which affects the subsequent formation of neutral deuterated compounds produced in the DR reactions. Eventually, the HCN/DCN and HNC/DNC ratios are shown to decrease for increasing OPR values. This example demonstrates the complexity of the interplay between the different chemistries.
 |
Fig. 8 Time dependence of fractionation ratios of CN, HCN, HNC in model (a) for 3 different OPR values. Black heavy dotted line: elemental ratio; green: OPR = 10-4; purple: OPR = 10-3; red: OPR = 10-2. |
 |
Fig. 9 Time dependence of fractionation ratios of CN, HCN, HNC in model (b) for 3 different OPR values. Black heavy dotted line: elemental ratio; green: OPR = 10-4; purple: OPR = 10-3; red: OPR = 10-2. |
5. Conclusions
We have for the first time built an isotopically substituted gas phase chemical network that includes D, 13C, and 15N species and included it in a time-dependent chemical model. Our model is based on a careful analysis of the possible gas phase mechanisms involved in carbon and nitrogen fractionation by scrutinizing the few available experimental studies and performing DFT and ab initio quantum calculations on hypothetical reactions to check for the possible presence of barriers in the reaction channels. One important result is that the fractionation reaction of 15N with N2H+ is unlikely, due to the presence of a barrier, in contrast to the previous hypothesis made by Terzieva & Herbst (2000). As a result, the modeled isotopic ratios involved in the isotopologues of N2H+are found to be very close to the elemental values and are similar to each other, in contradiction with observations toward L1544 (Bizzocchi et al. 2013).
The availability of new collisional rate coefficients for the N2H+– H2 system (Lique et al. 2015) may, however, modify these conclusions. We also discarded the 15N + HCNH+ and 15N + NO exchange reactions through similar arguments. Tentative reaction rate coefficients are also proposed for carbon fractionation reactions involving 13C+ and 13C with CN and C2. Additionally, we explicitly considered the various isotopologues involved in the N+ + H2 reaction, assuming that the energy defect involved in the reactions of 14N+ with para-H2 is a “real” endothermicity. This leads to a slight decline in the exponential term when 15N+ reacts with H2 and with HD compared to 14N+. This explains satisfactorily that 15NH2D is found to be more enriched in 15N than 15NH3 in the observations.
Comparison between observations of nitriles and isonitriles and simulated values is much more questionable, because carbon and nitrogen chemistries are interdependent. Observed isotopic ratios are usually large and suffer from large error bars owing to opacity effects in the main isotopologue and difficulties linked to nuclear spin effects. Whereas the various isotopologues follow a similar evolution, the isotopic ratios display significant variations due to slight shifts in the position of the maximum fractional abundances. A reasonable agreement is obtained between the observed 13C/15N ratios for most of the species in L134N and Barnard B1 and steady state model values. Our model results show a strong depletion in 13C and a near elemental ratio for 14N/15N, whereas observations are usually interpreted by assuming an elemental ratio for 13C containing species, which leads to the incorrect assumption of 15N enrichment. These considerations undeniably depend on the chosen elemental abundances and, in particular, on the assumed C/O ratio. We additionally point out a somewhat unexpected effect of the ortho-to-para ratio of H2, which significantly affects the fractional ionization and, consequently, the level of deuterium fractionation through the respective orders of magnitude of DR rate coefficients of polyatomic molecular ions. The importance of coupling C, O, and N chemistries was emphasized.
Online material
Appendix A: Exchange reactions
We discuss below the reactions displayed in Table 1.
-
 ⇌
⇌
 ⇌
⇌
These reactions have been studied experimentally by Adams & Smith (1981) at 80 K without differentiating between N15NH+ and 15NNH+. The total rate is 4.6 × 10⁻¹⁰ cm3 s-1. We thus take half this value for the forward reaction rate constant, considering the symmetry factor, and we assume no barrier for these rapid reactions. We also introduce the
 ⇌
⇌ reaction for completeness.
 -
 ⇌
⇌
This reaction involves adduct formation. The numerical constant is computed to reproduce the experimental value of Anicich et al. (1977) at room temperature.
-
 ⇌
⇌
No information is available for this reaction.The bimolecular exit channels 12C+ + NCN and C2+/N2 are both endothermic by 170 and 76 kJ/mol, respectively. We performed DFT calculations (at the M06-2X/cc-pVTZ level) to explore the possibility of isotopic exchange. Direct N exchange is impossible because it would require simultaneous bond formation, rearrangement, and bond breaking. However, isotopic exchange could take place through adduct formation. No barrier was found in the entrance channel for NCNC+ formation (exothermic by 167 kJ/mol). The most favorable NCNC+ isomerization pathway is cyclic. However, the position of the c-NC(N)C+ transition state (TS) is highly uncertain and is found to be below the entrance channel at M06-2X/cc-pVQZ level (–14 kJ/mol) but slightly above the entrance level at the RCCSD(T)-F12/aug-cc-pVTZ level (+19 kJ/mol). In any case, the TS position is close to the entrance level so that the NCNC+ back dissociation is favored at room temperature. Isotopic exchange may, however, be enhanced at low temperature and may become the main exit channel. Considering a T-1 temperature dependence of the adduct lifetime, we tentatively suggest kf = 3.8 × 10⁻¹² × (T/ 300)-1 cm3 s-1.
-
 ⇌
⇌
Terzieva & Herbst (2000) estimated the value of this rate coefficient from the difference between the Langevin rate and the other measured exothermic reactions reported below:
 k1 = 5.0 × 10⁻¹⁰ cm3 s-1 and k2 = 5.0 × 10⁻¹¹ cm3 s-1. No data are available for the two other reactions. We find a barrier for NON+ adduct formation (261 kJ/mol at the M06-2X/cc-pVTZ level) and neglect this exchange reaction.
 -
 ⇌
⇌
No information is available for these reactions, which were reported as crucial by Rodgers & Charnley (2008b). We performed DFT calculations (at the M06-2X/cc-pVTZ level) which showed that isotopic exchange through the addition elimination mechanism is impossible as the NN(H)N+ and NNNH+ ions are metastable, respectively 73 and 332 kJ/mole above the 14N+ N2H+energy.
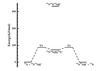
Fig. A.1 Energy diagram of the NNNH+ system.
Figure A.1 displays the various possibilities. In addition, direct nitrogen exchange through NN(H)...N+→ N...N(H)N+ presents a barrier equal to +87 kJ/mol. We did not find any N3H+ configuration with an energy lower than that of the reactants. We then neglect this reaction.
-
 ⇌
⇌
Following a similar suggestion for explaining abundance anomalies of the 13C species of CCH (Sakai et al. 2010), we consider the above reaction, for which no information is available. We performed various DFT calculations at the M06-2X/cc-pVTZ level. The HNNH+ ion is 109 kJ/mole more stable than H + N2H+, but the addition reaction shows a barrier of +12 kJ/mole. The intramolecular isomerization 15NNH+→ N15NH+ also displays a barrier of +172 kJ/mole. Then direct isomerization through tunneling is expected to be very slow, and we neglect that reaction2.
-
 ⇌
⇌
This reaction was also suggested by Terzieva & Herbst (2000) despite the lack of any relevant information. We performed DFT calculations to explore the possibility of isotopic exchange as shown in Fig. A.2.
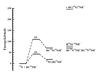
Fig. A.2 Energy diagram of the HCNNH+ system.
Direct N exchange is found to be impossible because it requires simultaneous bond formation, rearrangement, and bond breaking so that isotopic exchange involves adduct formation. Attack by atomic nitrogen on either side of the HCNH+ molecular ion leads to a metastable system through high-energy transition states. We did not consider transition states leading to N addition on the C=N bond of HCNH+, nor did we examine N insertion into the N-H or C-H bonds, since all these pathways led to species located above the reagent energy level. We did not find any CN2H2+ species lying below the reagent energy level, and we consider that this reaction cannot take place.
-
 ⇌
⇌
The N(4So) + CN (
 ) reaction leads to
  surfaces in C∞V symmetry and 3,5A′′ surfaces in Cs symmetry. The quintuplet surface is repulsive at the MRCI+Q/aug-ccpVTZ level, and the 5NCN intermediate is above the N + CN level. Considering only the triplet surface, the only barrierless reaction is attack on the carbon atom that leads to the ground state 3NCN intermediate (Daranlot et al. 2012; Ma et al. 2012). The main exit channel is C + N2 after isomerization of the NCN intermediate through a tight TS, and then back dissociation may be important and isotope exchange possible. In the nominal model, we neglect this reaction, but some tests were performed to estimate its potential role. The upper limit of the isotope exchange rate constant is equal to the capture rate constant minus the N + CN → C + N2 rate constant. That value is notably lower than the capture one at low temperature. We thus propose the upper limit value of 2.0 × 10⁻¹⁰× (T/300)1/6
 cm3 s-1 for the forward rate constant.
 -
 ⇌
⇌


Fig. A.3 Energy diagram of the CCNN system.
The N(4S) + C2N (2Π) reaction leads to 3,5Π surfaces in C∞V symmetry and 3,5A′ + 3,5A′′ surfaces in Cs symmetry. Figure A.3 displays the positions of the state energies linked to N + C2N, which are calculated at the MRCI+Q/aug-cc-pVTZ level:10 e- in 10 OM with the geometry fully optimized at the CASCCF level or 14 e- in 14 OM for the CASCCF and 14e- in 12 OM for the MRCI calculation with non relaxed geometry. The triplet surface pathway leads to a NCCN adduct in a triplet state, corresponding to an excited state of the very stable NCCN linear molecule, located –393 kJ/mol below the N(4S) + C2N (2Π) level. No barrier is present in the entrance valley so that this NCCN adduct very likely leads to CN (in a doublet state) + CN (in a doublet state) products. The occurrence of a small exit barrier cannot be excluded, but its energy should be much lower than that of the 14N + C215N entrance channel. Triplet surfaces thus cannot lead to isotopic exchanges. However, the quintuplet surface deserves specific attention because the NCCN(
 ) adduct is found at an energy of –183 kJ/mol below that of the N(4S) + C2N (2Π) level (at the MRCI+Q, RCCSD(T) and DFT level of calculations). However, no exothermic bimolecular exit channel is available on this quintuplet surface. We thus conclude that the quintuplet surface could lead to isotopic exchange and finally consider the two following possibilities for this reaction involving the very reactive C2N radical (Wang et al. 2005, 2006), i.e. the triplet channel,
  and the quintuplet channel,

-
 ⇌
⇌
There is a barrier for NON adduct formation. The isotope exchange rate is calculated to be very low (Gamallo et al. 2010) since the main exit channel is N2 + O. Moreover, the quintuplet surfaces are repulsive. We neglect this reaction.
-
 ⇌
⇌
This reaction was first mentioned by Watson et al. (1976) and has been experimentally studied in detail by Smith & Adams (1980) in the 80–500 K temperature range. Their data can be fitted (Liszt 2007). We introduce a new formula allowing us to describe the full temperature range with a single formula.
-
 ⇌
⇌
This reaction has also been studied experimentally by Smith & Adams (1980). The exothermicity of the reaction has been reported as 9 K by Langer et al. (1984) from theoretical studies, whereas Smith & Adams (1980) proposed a value of 12 ± 5 K. However, a later study by Lohr (1998) leads to a value of 17.4 K. Mladenović & Roueff (2014) have reconsidered this reaction and confirm the value of Lohr (1998). We include this exothermicity value in the present work. Experimental points are fitted through a power law as given in Table 1.
-
 ⇌
⇌
There are no bimolecular exit channels for this reaction and two different pathways lead to isotopic exchange. In a direct reaction, 13C++ NC →13CNC+→13CN + 12C+, whereas the indirect pathway involves 13C++ CN →13CCN+→13CN+ 12C+. There is no barrier in the entrance valley for both cases at the M06-2X/cc-pVTZ level. Moreover, the cyclic transition state from CCN+ and CNC+ is located at –436 kJ/mol below the reactant energy, leading to fast isomerization. The corresponding capture rate constant is 3.82 × 10⁻⁹ × (T/ 300)-0.40.
-
 ⇌
⇌
In a similar way to the ionic case, no exothermic bimolecular exit channels are available for this reaction and two reaction pathways occur for possible isotopic exchange. 13C+ NC →13CNC →13CN+ 12C holds for the direct process, and 13C+ CN →13CCN → c-13CNC →13CN + 12C describe the indirect exchange mechanism. No barrier is found in the entrance channel, and the transition state from CCN to c-CCN is low (–298 kJ/mol below the reactant energy), in good agreement with Mebel & Kaiser (2002) so that isomerization is expected to be fast. The capture rate is computed as 3.0 × 10⁻¹⁰ cm3 s-1.
-
 ⇌
⇌
There are no exothermic bimolecular exit channels for this reaction and no barrier for HCNC formation, but isotopic exchange requires isomerization through a TS located close to the reactant level, involving a TS located at –16 kJ/mol at the M06-2X/cc-pVQZ level but +34 kJ/mol at the RCCSD(T)-F12-aug-cc-pVQZ level. Calculation of the rate constant for exchange is complex and similar to the 15N + CNC+ case. We neglect this reaction in the nominal model.
-
 ⇌
⇌
There are no exothermic product channels for this reaction, and there is very likely to be no barrier. The capture rate constant is equal to 3.0 × 10⁻¹⁰ cm3 s-1.
-
 ⇌
⇌
This reaction could be an additional possibility for enhancing 13CO because no barrier has been found in the entrance valley (Le Picard & Canosa 1998). The high-pressure CH + CO → HCCO association reaction rate constant is equal to 3 × 10-11 × (T/ 300)-0.9 between 53 and 294 K. The exchange rate has been measured to be ~ × 10-12 (Taatjes 1997) at room temperature. This value represents 1% of the association reaction rate constant at high pressure, which is explained by a transition state localized at 6 kJ/mole above the reactants energy as computed at the M06-2X/cc-pVTZ level, in good agreement with Sattelmeyer (2004). We do not include this reaction in our models given the high TS which should make this exchange process negligible at low temperature.
Appendix B: ZPE values
We revisit the ZPE values in light of several recent studies. We recall in Table B.1 the atomic masses of various isotopes that may be used to derive spectroscopic constants of isotopic molecules, as found in basic molecular spectroscopy textbooks (Herzberg 1945, 1989). We only refer to the first-order expansion terms for the purpose of computing ZPEs.
Atomic masses in amu from NIST.
Appendix B.1: Diatomic molecules
For diatomic molecules, energy levels are expressed as a Dunham expansion or equivalently as a sum of harmonic + anharmonicity correction factors. The following expression is obtained for the ZPE, corresponding to v = 0:  (B.1)where ω0 is the harmonic contribution of the vibrational frequency and ωexe represents the anharmonic contribution. The reduced mass μ dependence of ω0 and ωexe are 1/
 and 1/μ, respectively. The label computed in Table B.2 indicates the use
of this property to compute the spectroscopic constants, in the absence of other information.
Spectroscopic constants of diatomic molecules in cm-1 and differences of ZPE with respect to the main isotopologue.
Appendix B.2: Polyatomic molecules
For polyatomic molecules, the following expression extends the diatomic formulae where the different vibrational degrees of freedom are included:  (B.2)where ωi refers to the harmonic frequencies, di is the corresponding degeneracy, and xij stands for the anharmonic terms. The sum is performed over the number of vibrational modes. In the case of polyatomic linear molecules, the number of vibrational modes is 3N-5, whereas it is 3N-6 in the general case where N is the number of nuclei in the molecule.
Spectroscopic constants of triatomic molecules in cm-1 and differences of ZPE with respect to the main isotopologue.
Spectroscopic constants of tetratomic nitrogen molecules in cm-1 and differences of ZPE with respect to the main isotopologue.
These authors also interchanged the endothermicities of the 15NNH+ and N15NH+ reactions with N and N2.
We note in addition that N2H+ formation from N2 + H3+ is exothermic by only 72 kJ/mole, so that any 15NNH+ produced will not isomerize into N15NH+ and vice versa.
Acknowledgments
We acknowledge the support of PCMI (Programme National de Physique et Chimie du Milieu Interstellaire). This work has been partially funded by the Agence Nationale de la Recherche (ANR) research project IMOLABS (ANR-13-BS05-0008).
References
- Adams, N. G., & Smith, D. 1981, ApJ, 247, L123 [NASA ADS] [CrossRef] [Google Scholar]
- Adande, G. R., & Ziurys, L. M. 2012, ApJ, 744, 194 [NASA ADS] [CrossRef] [Google Scholar]
- Aléon, J. 2010, ApJ, 722, 1342 [NASA ADS] [CrossRef] [Google Scholar]
- Anicich, V. G., & Huntress, Jr., W. T. 1986, ApJS, 62, 553 [NASA ADS] [CrossRef] [Google Scholar]
- Anicich, V. G., Huntress, Jr., W. T., & Futrell, J. H. 1977, Chem. Phys. Lett., 47, 488 [NASA ADS] [CrossRef] [Google Scholar]
- Barlow, S. E., & Dunn, G. H. 1987, Int. J. Mass Spectrometry and Ion Processes, 80, 227 [Google Scholar]
- Bizzocchi, L., Caselli, P., & Dore, L. 2010, A&A, 510, L5 [NASA ADS] [CrossRef] [EDP Sciences] [Google Scholar]
- Bizzocchi, L., Caselli, P., Leonardo, E., & Dore, L. 2013, A&A, 555, A109 [NASA ADS] [CrossRef] [EDP Sciences] [Google Scholar]
- Brites, V., & Jutier, L. 2012, J. Mol. Spectr., 271, 25 [NASA ADS] [CrossRef] [Google Scholar]
- Colin, R. 1989, J. Mol. Spectr., 136, 387 [NASA ADS] [CrossRef] [Google Scholar]
- Colin, R., & Bernath, P. F. 2012, J. Mol. Spectr., 273, 30 [NASA ADS] [CrossRef] [Google Scholar]
- Daniel, F., Faure, A., Wiesenfeld, L., et al. 2014, MNRAS, 444, 2544 [NASA ADS] [CrossRef] [Google Scholar]
- Danielak, J., Kepa, R., & Zachwieja, M. 1997, J. Phys. B Atom. Mol. Phys., 30, 4889 [NASA ADS] [CrossRef] [Google Scholar]
- Daranlot, J., Hincelin, U., Bergeat, A., et al. 2012, Proc. Nat. Acad. Sci., 109, 10233 [Google Scholar]
- Daranlot, J., Hu, X., Xie, C., et al. 2013, Phys. Chem. Chem. Phys. (Incorporating Faraday Transactions), 15, 13888 [NASA ADS] [CrossRef] [Google Scholar]
- Dislaire, V., Hily-Blant, P., Faure, A., et al. 2012, A&A, 537, A20 [NASA ADS] [CrossRef] [EDP Sciences] [Google Scholar]
- Dore, L., Bizzocchi, L., Esposti, C. D., & Tamassia, F. 2011, Mol. Phys., 109, 2191 [NASA ADS] [CrossRef] [Google Scholar]
- Faure, A., Hily-Blant, P., Le Gal, R., Rist, C., & Pineau des Forêts, G. 2013, ApJ, 770, L2 [NASA ADS] [CrossRef] [Google Scholar]
- Flower, D. R., Pineau Des Forêts, G., & Walmsley, C. M. 2006, A&A, 456, 215 [NASA ADS] [CrossRef] [EDP Sciences] [Google Scholar]
- Furuya, K., Aikawa, Y., Sakai, N., & Yamamoto, S. 2011, ApJ, 731, 38 [NASA ADS] [CrossRef] [EDP Sciences] [Google Scholar]
- Gamallo, P., Martínez, R., Sayós, R., & González, M. 2010, J. Chem. Phys., 132, 144304 [NASA ADS] [CrossRef] [Google Scholar]
- Georgievskii, Y., & Klippenstein, S. J. 2005, J. Chem. Phys., 122, 194103 [NASA ADS] [CrossRef] [Google Scholar]
- Gerin, M., Viala, Y., & Casoli, F. 1993, A&A, 268, 212 [NASA ADS] [Google Scholar]
- Gerin, M., Marcelino, N., Biver, N., et al. 2009, A&A, 498, L9 [NASA ADS] [CrossRef] [EDP Sciences] [Google Scholar]
- Glassgold, A. E., Huggins, P. J., & Langer, W. D. 1985, ApJ, 290, 615 [NASA ADS] [CrossRef] [Google Scholar]
- Grant Hill, J., Mitrushchenkov, A., Yousaf, K. E., & Peterson, K. A. 2011, J. Chem. Phys., 135, 144309 [NASA ADS] [CrossRef] [Google Scholar]
- Guelachvili, G., de Villeneuve, D., Farrenq, R., Urban, W., & Verges, J. 1983, J. Mol. Spectr., 98, 64 [NASA ADS] [CrossRef] [Google Scholar]
- Henry, A., Le Moal, M. F., Cardinet, P., & Valentin, A. 1978, J. Mol. Spectr., 70, 18 [NASA ADS] [CrossRef] [Google Scholar]
- Herbst, E., Defrees, D. J., Talbi, D., Pauzat, F., & Koch, W. 1991, J. Chem. Phys., 94, 7842 [Google Scholar]
- Herzberg, G. 1945, Molecular Spectra and Molecular Structure, Vol. 2: Infrared and Raman Spectra of Polyatomic Molecules (New York: Van Nostrand), 372 [Google Scholar]
- Herzberg, G. 1989, Molecular Spectra and Molecular Structure, Vol. 1: Spectra of Diatomic Molecules (Malabar: Krieger Publishing Company) [Google Scholar]
- Hily-Blant, P., Bonal, L., Faure, A., & Quirico, E. 2013a, Icarus, 223, 582 [Google Scholar]
- Hily-Blant, P., Pineau des Forêts, G., Faure, A., Le Gal, R., & Padovani, M. 2013b, A&A, 557, A65 [NASA ADS] [CrossRef] [EDP Sciences] [Google Scholar]
- Hirano, N., & Liu, F.-c. 2014, ApJ, 789, 50 [NASA ADS] [CrossRef] [Google Scholar]
- Huang, X., Valeev, E. F., & Lee, T. J. 2010, J. Chem. Phys., 133, 244108 [NASA ADS] [CrossRef] [Google Scholar]
- Huang, X., Schwenke, D. W., & Lee, T. J. 2011, J. Chem. Phys., 134, 044321 [NASA ADS] [CrossRef] [Google Scholar]
- Ikeda, M., Hirota, T., & Yamamoto, S. 2002, ApJ, 575, 250 [NASA ADS] [CrossRef] [Google Scholar]
- Jensen, P., & Kraemer, W. P. 1988, J. Mol. Spectr., 129, 216 [NASA ADS] [CrossRef] [Google Scholar]
- Langer, W. D., & Penzias, A. A. 1990, ApJ, 357, L477 [NASA ADS] [CrossRef] [Google Scholar]
- Langer, W. D., Graedel, T. E., Frerking, M. A., & Armentrout, P. B. 1984, ApJ, 277, 581 [NASA ADS] [CrossRef] [Google Scholar]
- LeBourlot, J. 1991, A&A, 242, 235 [NASA ADS] [Google Scholar]
- Le Bourlot, J., Pineau Des Forets, G., Roueff, E., & Flower, D. R. 1993, A&A, 267, 233 [NASA ADS] [Google Scholar]
- LeGal, R., Hily-Blant, P., Faure, A., et al. 2014, A&A, 562, A83 [NASA ADS] [CrossRef] [EDP Sciences] [Google Scholar]
- Le Picard, S. D., & Canosa, A. a. 1998, J. Chem. Soc. Faraday Trans., 94, 2889 [CrossRef] [Google Scholar]
- Le Roy, R. J., Huang, Y., & Jary, C. 2006, J. Chem. Phys., 125, 164310 [NASA ADS] [CrossRef] [PubMed] [Google Scholar]
- Lique, F., Daniel, F., Pagani, L., & Feautrier, N. 2015, MNRAS, 446, 1245 [NASA ADS] [CrossRef] [Google Scholar]
- Lis, D. C., Wootten, A., Gerin, M., & Roueff, E. 2010, ApJ, 710, L49 [NASA ADS] [CrossRef] [Google Scholar]
- Liszt, H. S. 2007, A&A, 476, 291 [NASA ADS] [CrossRef] [EDP Sciences] [Google Scholar]
- Liszt, H. S., & Ziurys, L. M. 2012, ApJ, 747, 55 [Google Scholar]
- Lohr, L. L. 1998, J. Chem. Phys., 108, 8012 [NASA ADS] [CrossRef] [Google Scholar]
- Loison, J.-C., Wakelam, V., & Hickson, K. M. 2014, MNRAS, 443, 398 [Google Scholar]
- Lucas, R., & Liszt, H. 1998, A&A, 337, 246 [NASA ADS] [Google Scholar]
- Ma, J., Guo, H., & Dawes, R. 2012, Phys. Chem. Chem. Phys., 14, 12090 [CrossRef] [Google Scholar]
- Maki, A. G., & Mellau, G. C. 2001, J. Mol. Spectr., 206, 47 [Google Scholar]
- Maki, A. G., Mellau, G. C., Klee, S., Winnewisser, M., & Quapp, W. 2000, J. Mol. Spectr., 202, 67 [Google Scholar]
- Marquette, J. B., Rebrion, C., & Rowe, B. R. 1988, J. Chem. Phys., 89, 2041 [NASA ADS] [CrossRef] [Google Scholar]
- Martin, J. M. L., Taylor, P. R., & Lee, T. J. 1993, J. Chem. Phys., 99, 286 [NASA ADS] [CrossRef] [Google Scholar]
- Marty, B., Chaussidon, M., Wiens, R. C., Jurewicz, A. J. G., & Burnett, D. S. 2011, Science, 332, 1533 [NASA ADS] [CrossRef] [Google Scholar]
- Mebel, A. M., & Kaiser, R. I. 2002, ApJ, 564, 787 [NASA ADS] [CrossRef] [Google Scholar]
- Mendes, M. B., Buhr, H., Berg, M. H., et al. 2012, ApJ, 746, L8 [NASA ADS] [CrossRef] [Google Scholar]
- Milam, S. N., Savage, C., Brewster, M. A., Ziurys, L. M., & Wyckoff, S. 2005, ApJ, 634, 1126 [NASA ADS] [CrossRef] [Google Scholar]
- Milligan, D. B., Fairley, D. A., Freeman, C. G., & McEwan, M. J. 2000, Int. J. Mass Spectrometry, 202, 351 [NASA ADS] [CrossRef] [Google Scholar]
- Mladenović, M., & Roueff, E. 2014, A&A, 566, A144 [NASA ADS] [CrossRef] [EDP Sciences] [Google Scholar]
- Möllmann, E., Maki, A. G., Winnewisser, M., Winnewisser, B. P., & Quapp, W. 2002, J. Mol. Spectr., 212, 22 [NASA ADS] [CrossRef] [Google Scholar]
- Ohishi, M., Irvine, W. M., & Kaifu, N. 1992, in Astrochemistry of Cosmic Phenomena, ed. P. D. Singh, IAU Symp., 150, 171 [Google Scholar]
- Pagani, L., Roueff, E., & Lesaffre, P. 2011, ApJ, 739, L35 [NASA ADS] [CrossRef] [Google Scholar]
- Pillai, T., Wyrowski, F., Hatchell, J., Gibb, A. G., & Thompson, M. A. 2007, A&A, 467, 207 [NASA ADS] [CrossRef] [EDP Sciences] [Google Scholar]
- Ram, R. S., & Bernath, P. F. 2010, J. Mol. Spectr., 260, 115 [NASA ADS] [CrossRef] [Google Scholar]
- Ram, R. S., & Bernath, P. F. 2012, J. Mol. Spectr., 274, 22 [NASA ADS] [CrossRef] [Google Scholar]
- Ram, R. S., Wallace, L., & Bernath, P. F. 2010, J. Mol. Spectr., 263, 82 [NASA ADS] [CrossRef] [Google Scholar]
- Rodgers, S. D., & Charnley, S. B. 2004, MNRAS, 352, 600 [NASA ADS] [CrossRef] [Google Scholar]
- Rodgers, S. D., & Charnley, S. B. 2008a, ApJ, 689, 1448 [NASA ADS] [CrossRef] [Google Scholar]
- Rodgers, S. D., & Charnley, S. B. 2008b, MNRAS, 385, L48 [NASA ADS] [CrossRef] [Google Scholar]
- Roueff, E., Lis, D. C., van der Tak, F. F. S., Gerin, M., & Goldsmith, P. F. 2005, A&A, 438, 585 [NASA ADS] [CrossRef] [EDP Sciences] [Google Scholar]
- Sakai, N., Saruwatari, O., Sakai, T., Takano, S., & Yamamoto, S. 2010, A&A, 512, A31 [NASA ADS] [CrossRef] [EDP Sciences] [Google Scholar]
- Sakai, N., Takano, S., Sakai, T., et al. 2013, J. Phys. Chem. A, 117, 9831 [CrossRef] [Google Scholar]
- Sattelmeyer, K. 2004, Chem. Phys. Lett., 383, 266 [NASA ADS] [CrossRef] [Google Scholar]
- Savage, C., Apponi, A. J., Ziurys, L. M., & Wyckoff, S. 2002, ApJ, 578, 211 [NASA ADS] [CrossRef] [Google Scholar]
- Smith, D., & Adams, N. G. 1980, ApJ, 242, 424 [NASA ADS] [CrossRef] [Google Scholar]
- Taatjes, C. A. 1997, J. Chem. Phys., 106, 1786 [NASA ADS] [CrossRef] [Google Scholar]
- Terzieva, R., & Herbst, E. 2000, MNRAS, 317, 563 [NASA ADS] [CrossRef] [Google Scholar]
- Tiné, S., Roueff, E., Falgarone, E., Gerin, M., & Pineau des Forêts, G. 2000, A&A, 356, 1039 [NASA ADS] [Google Scholar]
- Vigren, E., Zhaunerchyk, V., Hamberg, M., et al. 2012, ApJ, 757, 34 [NASA ADS] [CrossRef] [Google Scholar]
- Visser, R., van Dishoeck, E. F., & Black, J. H. 2009, A&A, 503, 323 [NASA ADS] [CrossRef] [EDP Sciences] [Google Scholar]
- Wakelam, V., Smith, I. W. M., Loison, J.-C., et al. 2013, unpublished [arXiv:1310.4350] [Google Scholar]
- Wampfler, S. F., Jorgensen, J. K., Bizzarro, M., & Bisschop, S. E. 2014, A&A, 572, A24 [NASA ADS] [CrossRef] [EDP Sciences] [Google Scholar]
- Wang, Q., Ding, Y.-H., & Sun, C.-C. 2005, Chem. Phys. Chem., 6, 431 [Google Scholar]
- Wang, Q., Ding, Y.-H., & Sun, C.-C. 2006, Chem. Phys. Chem., 7, 710 [Google Scholar]
- Watson, W. D., Anicich, V. G., & Huntress, Jr., W. T. 1976, ApJ, 205, L165 [NASA ADS] [CrossRef] [Google Scholar]
- Wirström, E. S., Charnley, S. B., Cordiner, M. A., & Milam, S. N. 2012, ApJ, 757, L11 [NASA ADS] [CrossRef] [Google Scholar]
- Zachwieja, M. 1995, J. Mol. Spectr., 170, 285 [NASA ADS] [CrossRef] [Google Scholar]
- Zachwieja, M. 1997, J. Mol. Spectr., 182, 18 [NASA ADS] [CrossRef] [Google Scholar]
- Zachwieja, M., Szajna, W., & Hakalla, R. 2012, J. Mol. Spectr., 275, 53 [NASA ADS] [CrossRef] [Google Scholar]
- Zhang, X.-N., Shi, D.-H., Sun, J.-F., & Zhu, Z.-L. 2011, Chin. Phys. B, 20, 043105 [NASA ADS] [CrossRef] [Google Scholar]
- Zhao, Y., & Truhlar, D. G. 2008, Theor. Chem. Accounts, 120, 215 [Google Scholar]
- Zymak, I., Hejduk, M., Mulin, D., et al. 2013, ApJ, 768, 86 [NASA ADS] [CrossRef] [Google Scholar]
All Tables
Model (a) and (b) results and observations. ss means stationary state. The value of the o/p ratio of H2 is taken as 10-3.
Dependence of the fractionation ratios on the o/p ratio of H2 for model (a), where ss means stationary state.
Dependence of the fractionation ratios on the o/p ratio of H2 for model (b) at steady state.
Spectroscopic constants of diatomic molecules in cm-1 and differences of ZPE with respect to the main isotopologue.
Spectroscopic constants of triatomic molecules in cm-1 and differences of ZPE with respect to the main isotopologue.
Spectroscopic constants of tetratomic nitrogen molecules in cm-1 and differences of ZPE with respect to the main isotopologue.
All Figures
|
Fig. 1 Upper panel: time dependence of N/15N isotopic ratios in atomic and molecular nitrogen and N2H+ ions. a) and b) correspond to the models defined in Table 4; the black heavy dotted line represents the elemental N/15N. Lower panel: time dependence of the fractional abundances relative to H2 of N, N2, and N2H+ for models (a) and (b). The value reported for N2H+ towards TMC1 (Ohishi et al. 1992) is displayed as a horizontal green dashed line. |
| In the text | |
|
Fig. 2 Upper panel: time dependence of N/15N isotopic ratios in nitrogen hydrides. a) and b) correspond to the models defined in Table 4; The black heavy dotted line represents the elemental N/15N. Lower panel: time dependence of the fractional abundances relative to H2 of NH, NH2, NH3, and NH2D for models (a) and (b). The values reported for NH3 (Ohishi et al. 1992) and NH2D (Tiné et al. 2000) towards TMC1 are displayed as horizontal blue and red dashed lines, respectively, in the left panel. |
| In the text | |
|
Fig. 3 Time evolution of 13C/15N ratios in CN, HCN, and HNC for models (a) and (b). The 13C/15N elemental ratio is displayed as a heavy dotted line. |
| In the text | |
|
Fig. 4 Time dependence of C/13C isotopic ratios in CN, HCN, and HNC. a) and b) correspond to the models defined in Table 4. |
| In the text | |
|
Fig. 5 Upper panel: time dependence of C/13C isotopic ratios in C, CH, CO, and HCO+. The black heavy dotted line represents the elemental 12C/13C. Lower panel: time dependence of the fractional abundances relative to H2 of C, 12C+, CO, CH, and HCO+, for models (a) and (b). The observational values towards TMC1 (Ohishi et al. 1992) are displayed as horizontal dashed lines with corresponding colors in the left panel. a) and b) correspond to the models defined in Table 4. |
| In the text | |
|
Fig. 6 Time dependence of N/15N isotopic ratios in CN, HCN, HNC, and NO. a) and b) correspond to the models defined in Table 4. |
| In the text | |
|
Fig. 7 Time dependence of CN, HCN, HNC, and their isotopologues. a) and b) correspond to the models defined in Table 4. |
| In the text | |
|
Fig. 8 Time dependence of fractionation ratios of CN, HCN, HNC in model (a) for 3 different OPR values. Black heavy dotted line: elemental ratio; green: OPR = 10-4; purple: OPR = 10-3; red: OPR = 10-2. |
| In the text | |
|
Fig. 9 Time dependence of fractionation ratios of CN, HCN, HNC in model (b) for 3 different OPR values. Black heavy dotted line: elemental ratio; green: OPR = 10-4; purple: OPR = 10-3; red: OPR = 10-2. |
| In the text | |
|
Fig. A.1 Energy diagram of the NNNH+ system. |
| In the text | |
|
Fig. A.2 Energy diagram of the HCNNH+ system. |
| In the text | |
|
Fig. A.3 Energy diagram of the CCNN system. |
| In the text | |
Current usage metrics show cumulative count of Article Views (full-text article views including HTML views, PDF and ePub downloads, according to the available data) and Abstracts Views on Vision4Press platform.
Data correspond to usage on the plateform after 2015. The current usage metrics is available 48-96 hours after online publication and is updated daily on week days.
Initial download of the metrics may take a while.