| Issue |
A&A
Volume 576, April 2015
|
|
|---|---|---|
| Article Number | A131 | |
| Number of page(s) | 47 | |
| Section | Interstellar and circumstellar matter | |
| DOI | https://doi.org/10.1051/0004-6361/201423791 | |
| Published online | 17 April 2015 | |
Combination of CN(1-0), HCN(1-0), and HNC(1-0): A possible indicator for a high-mass star formation sequence in the Milky Way⋆
1 Xinjiang Astronomical Observatory, CAS, 150, Science 1-street, Urumqi, 830011 Xinjiang, PR China
e-mail: This email address is being protected from spambots. You need JavaScript enabled to view it.
2 Graduate University of Chinese Academy of Sciences, 19A Yuquan Road, 100049 Beijing, PR China
3 Key Laboratory of Radio Astronomy, Chinese Academy of Sciences, 830011 Nanjing, 210008 Jiangsu, PR China
4 Shanghai Astronomical Observatory, Chinese Academy of Sciences, 80 Nandan Road, 200030 Shanghai, PR China
5 Center for astrophysics, Guangzhou University, 510006 Guangzhou, PR China
Received: 11 March 2014
Accepted: 26 January 2015
Abstract
Context. CN, HCN, and HNC have been used to discuss the star formation sequence in galaxies, but recent studies of large samples involving these lines did not yet provide convincing results.
Aims. We intend to determine whether the global line ratios CN/HCN, CN/HNC, and HCN/HNC can be used to trace the high-mass star formation sequence in the Milky Way.
Methods. We performed map observations of CN(1-0), HCN(1-0), and HNC(1-0) toward 38 high-mass star-forming regions, which includes high-mass starless cores (HMSC), high-mass protostars (HMPO), UCHII (ultra-compact HII) and normal HII regions. We identified the molecular clumps associated with them, and removed the clumps that were affected by environment. We averaged all the detected emission from each clump to obtain global line ratios and investigated their variations with the evolutionary stages of high-mass star-forming clumps.
Results. The global line ratios of ICN/IHNC and IHCN/IHNC for HMSC clumps (HMSCCs), HMPO clumps (HMPOCs), UCHII region clumps (UCHIICs), and HII region clumps display an increasing trend. We tentatively divide the star-forming regions into two types. Type 1 sources include HMSCCs and HMPOCs that are not associated with external 20 cm continuum emission. Type 2 sources include all UCHIICs and HIICs. Our analysis shows that the ICN/IHNC and IHCN/IHNC line ratios can trace the evolution from type 1 to type 2 well. The same method may be used to study the evolution of external galaxies.
Conclusions. ICN/IHNC and IHCN/IHNC appear to be good tracers for the evolution of high-mass star-forming regions in the Milky Way.
Key words: ISM: clouds / ISM: molecules
Appendices are available in electronic form at http://www.aanda.org
© ESO, 2015
1. Introduction
The formation and the early evolution of high-mass stars are still only poorly understood (Zinnecker & Yorke 2007; Tan et al. 2014), while chemical studies on the different evolutionary stages of high-mass star formation provide an important tool for investigating its underlying physical processes (Gerner et al. 2014). HCN is a widely used dense gas tracer, CN is a good tracer of photodissociation regions (PDRs) near massive young stars (Rodriguez et al. 1998), and HNC is a reliable tracer of cold gas (Schilke et al. 1992). The abundances of CN, HCN, and HNC are sensitive to temperature, optical depth, and UV radiation (Schilke et al. 1992; Fuente et al. 1993; Boger & Sternberg 2005). To a significant extent, CN is a photodissociation product of HCN and HNC, and the abundance ratio of CN/HCN increases in the outer regions of molecular clouds that are exposed to UV radiation (Baan et al. 2008 and references therein). Mapping observation studies of the Orion Bar and the reflection nebulae NGC 2023 and NGC 7023 suggest that the CN/HCN intensity ratios are highest near the stellar sources that illuminate far-ultraviolet (FUV) radiation fields, while the ratios decrease with increasing optical depth and distance from the stars (Boger & Sternberg 2005). This behavior is broadly consistent with theoretical expectations (Sternberg & Dalgarno 1995; Jansen et al. 1995) and is evidence for selective photodissociation of HCN versus CN (van Zadelhoff et al. 2003; Thi et al. 2004). On the other hand, HNC transfers to HCN at high temperature, and so the abundance ratio HCN/HNC is strongly dependent on the temperature (Vasyunina et al. 2011; Ungerechts et al. 1997). The abundance ratio HCN/HNC is ~1 for infrared dark clouds (IRDCs; Vasyunina et al. 2011), and is higher and reaches up to 13 for high-mass protostars (HMPOs; Helmich & van Dishoeck 1997), and the ratio is ~80 for very warm regions like Orion (Schilke et al. 1992; Goldsmith et al. 1986). All these suggest that the combination of CN, HCN, and HNC is a promising indicator of the star formation sequence in galaxies.
CN, HCN, and HNC have been used to discuss the star formation sequence in samples of external galaxies (Aalto et al. 2002; Baan et al. 2008, 2010; Costagliola et al. 2011; Aalto 2013). Aalto et al. (2002) found abundance ratios of CN/HCN > 1 for three starburst galaxies, indicating that a significant part of the interstellar medium (ISM) in these galaxies resides in PDRs, and CN/HCN < 1 in four active galactic nuclei (AGNs). This suggests that the ISM of these galaxies contains a large amount of warm dense gas, which implies that the galaxies may be in an early stage of their starburst development. Costagliola et al. (2011) also found that luminous infrared galaxies (LIRGs) with HC3N (10−9) detected have intensity ratios of HCO+/HCN < 1 and HNC/HCN > 0.4. Starburst galaxies tend to have higher HCO+/HCN and lower HNC/HCN intensity ratios.
Recently, many authors have focused on the chemical evolution of high-mass star-forming regions in the Milky Way (Vasyunina et al. 2011; Sanhueza et al. 2012; Hoq et al. 2013; Gerner et al. 2014). CN, HCN, and HNC are usually included in these studies. However, Vasyunina et al. (2011) did not detect any significant differences in the HCN/HNC abundance ratios between “quiescent”, “middle”, and “active” regions within their IRDC (infrared dark cloud) sample, whereas Gerner et al. (2014) obtained differences between IRDC, HMPO, HMC (hot molecular core), and UCHII regions with an HCN/HNC abundance ratio between 0.3−0.6. Hoq et al. (2013) also found that integrated intensity ratios of HCN(1-0)/HNC(1-0) show marginal evidence of an increase as the clumps evolve, with median values of 1.07, 1.19, and 1.64 for quiescent, protostellar, and HII/PDR sources, respectively. It is evident that these results are not conclusive as to whether the combination of CN(1-0), HCN(1-0), and HNC(1-0) can be used to trace the evolution of high-mass star formation. One possible reason is that these three lines are affected by the environment because they are sensitive to optical depth, UV radiation, and shocks. On the other hand, these studies were based on single-point line data, which is not suitable for tracing chemical evolution of the whole high-mass star-forming regions. Since star formation takes place in dense molecular clumps, the global physical and chemical conditions of the clump will change as it evolves. Mapping observations of CN, HCN, and HNC for a large sample of high-mass star-forming regions at different stages are needed to obtain their global physical and chemical properties and to help in determining whether the combinations of CN, HCN, and HNC can be used as indicators for the star formation sequence in the Milky Way, as well as to understand the star formation sequence in external galaxies.
Our objective in this paper is to determine whether the global integrated intensity ratios CN/HCN, CN/HNC, and HCN/HNC increase with the age of embedded stars. We perform CN(1-0), HCN(1-0), and HNC(1-0) mapping observations for a large sample of high-mass star-forming regions at different evolutionary stages using the 13.7 m telescope of the Purple Mountain Observatory (PMO). In Sect. 2, we describe the sample we used, observation, archival data and data reduction, and the results are given in Sect. 3. We discuss the global line ratios of high-mass star-forming regions at different evolutionary stages and their variations in Sect. 4. Our conclusions are summarized in Sect. 5.
2. Observation and data
2.1. PMO 13.7 m observation
Table 1 lists all sources used in this paper. Nine high-mass starless cores (HMSCs) were selected from the lists of Sridharan et al. (2005) and Sakai et al. (2008). The sources were detected at 1.2 mm, but without any infrared radiation at 8 μm. Eleven high-mass protostars (HMPOs) were selected from the list of Sridharan et al. (2002). These sources have no or very weak radio continuum emission. In addition, eleven UCHII (ultra-compact HII) regions were chosen from the list of Bronfman et al. (1996). They show strong CS(2−1) emission, indicating that these sources are still embedded in dense gas envelopes. Finally, seven HII regions were selected from the list of Anderson & Bania (2009).
List of sources.
We performed map observations of CN(1-0), HCN(1-0), and HNC(1-0) toward all sources using the PMO 13.7 m telescope in March 2011, the corresponding rest frequencies are 113.4909 GHz, 88.63184 GHz, and 90.6635 GHz, respectively. The main beam size of the telescope is about 55′′. A cryogenically cooled nine-beam SIS receiver working in the 80−115 GHz band in single-sideband (SSB) mode was employed for the observations as front end. The properties of the SIS mixers are introduced in Shan et al. (2010). FFTS spectrometers were used as back ends, which have a total bandwidth of 1 GHz and 16384 channels, corresponding to a velocity resolution of 0.16, 0.21, and 0.20 km s-1 for CN(1-0), HCN (1-0), and HNC (1-0), respectively. The main beam efficiency is about 0.48. The pointing accuracy of the telescope is better than 4′′. The typical system temperature in SSB mode is around 110 K and varies by about 10% for each beam. The on-the-fly (OTF) observing mode was applied to our observation, the map size is 10′× 10′, and the typical rms is about 0.1 K in  . The data processing was conducted using the Gildas package1.
All mapping regions of HMSCs and HMPOs have been studied in detail at different wavelengths (Beuther et al. 2002; Sakai et al. 2008; Sridharan et al. 2002, 2005), which makes it straightforward to find star-forming objects in these regions and identify their evolutionary stages by referring to the relevant literature. We determined the unknown evolutionary stages for a few star-forming objects by checking the infrared and radio continuum emission at cm wavelengths using the methods proposed by Sakai et al. (2008), Sridharan et al. (2002, 2005). Detailed information about continuum emission data is given in Sect. 2.2.
2.2. Archive data of 6 (3.6) cm and 20 cm continuum emission
To assist in determining the evolutionary stages of HMSCs, HMPOs, and UCHII regions in the clumps, we obtained Midcourse Space Experiment (MSX) data at 8 μm from the NASA/IPAC infrared science archive and radio continuum emission data at 6 (3.6) cm from the VLA. We obtained the 6 cm continuum emission map for sources without VLA data from the Multi-Array Galactic Plane Survey (MAGPIS)2. 20 cm continuum data from the NRAO VLA Sky Survey (NVSS)3 were also used to identify any HII regions close to the molecular clumps.
The VLA data were obtained from the NRAO DATA Archive System4. The data processing was conducted using AIPS. Depending on the intensity of the sources, the integration time for the observations ranges from several minutes to several hours, and the resulting rms noise level ranges from 0.01 to 26 mJy beam-1. Table A.2 summarizes the detailed information of the VLA archival data. The linear size of the continuum source was derived from its major axis. The coordinates of the continuum sources are given in Table A.1.
MAGPIS collects bits and pieces of the Galactic survey that have been imaged at high resolution. It includes the 6 cm and 20 cm VLA radio images and catalogs (White et al. 2005), as well as the main MAGPIS database of high-dynamic range, high-sensitivity VLA images for the region 5°<l< 48.5°, | b | < 0.8° (Helfand et al. 2006). It has a synthesized beam of s6.2′′× 5.4′′ and a typical rms of s0.3 mJy/beam (Helfand et al. 2006).
NVSS is a 1.4 GHz continuum survey covering the entire sky north of −40° declination. The angular resolution is about 45′′, and the noise level in the images is about 0.5 mJy/beam. A detailed description of the survey can be found in Condon et al. (1998). In this paper, we use images provided by the homepage of NVSS.
3. Results
We performed map observations toward 38 high-mass star-forming regions with a size of 10′× 10′, and obtained 44 clumps. Figure B.1 shows the contour maps of ICN (∫ (CN(1-0))dv), IHCN (∫(HCN(1-0))dv), and IHNC (∫(HNC(1-0))dv) for each clump plotted on gray scale maps of 6 (3.6) cm and 20 cm continuum emission. Because we wished to study global line ratios of high-mass star-forming clumps, HMSCs, HMPOs, and UCHII regions that were not associated with molecular clumps were discarded. Table A.1 lists all HMSCs, HMPOs, and UCHII regions associated with molecular clumps and their evolutionary stages. Table A.2 lists all dense molecular clumps and information of VLA observations and results.
A key for studying variations of the global molecular line ratios is to identify the molecular clumps at different evolutionary stages. The clumps that contain HMSC, HMPO, and UCHII were named HMSC clump (HMSCC), HMPO clump (HMPOC), and UCHII clump (UCHIIC). For molecular clumps that contain several star-forming objects at different evolutionary stages, the stage of the clump is determined by the most evolved object. We suggest that the chemical conditions of clumps around HII regions, which are named HII clump (HIIC), are dominated by the HII region. Detailed information for each clump is given in Appendix D.
We finally identified 5 HMSCCs, 14 HMPOCs, 15 UCHIICs, and 10 HIICs. We averaged all detected CN(1-0), HCN(1-0), and HNC(1-0) emission from each clump to obtain the averaged molecular spectral lines (Fig. C.1), which were then fitted with a Gaussian to acquire their parameters. Tables A.3 to A.5 list the velocity (VLSR), full width at half maximum (FWHM) and peak intensity () of the CN(1-0), HCN(1-0) and HNC(1-0) for each clump. Table 2 gives the integrated intensities ICN, IHCN, and IHNC and the line ratios ICN/IHCN, ICN/IHNC, and IHCN/IHNC. All transitions of the averaged CN(1-0) line from G22.35+0.41, G23.60+0.00A, G23.60+0.00B, and G52.94-0.59, and HCN(1-0) line from D53.94-0.59 are very weak with signal-to-noise ratios between 1 and 3. We did not fit them with a Gaussian, but just gave their integrated intensities in Table 2. Here ICN integrated over two satellites, which are CN 1-0 J = 3/2−1/2 F = 3/2−1/2 (113 488.140 MHz) and J = 3/2−1/2 F = 5/2−3/2 (113 490.982MHz). IHCN integrated over three satellites, which are HCN 1-0 F = 1 − 1 (88 630.4157 MHZ), F = 2 − 1 (88 631.8473 MHz) and F = 0 − 1 (88 633.9360 MHz). IHNC integrated over three satellites, which are HNC 1-0 F = 0 − 1 (90 663.450 MHz), F = 2 − 1 (90 663.574 MHz) and F = 1 − 1 (90 663.656 MHz).
Global line ratios for CN(1-0), HCN(1-0), and HNC(1-0) for each clump.
4. Discussion
4.1. ICN/IHCN, ICN/IHNC and IHCN/IHNC for molecular clumps at different evolutionary stages
Radio continuum emission at 6 cm (or 3.6 cm) and 20 cm is free-free emission, which is produced by free electrons scattering off ions without being captured. Detection of radio free-free emission indicates a ionized hydrogen cloud (HII region). The latter requires abundance of ionized photons (UV photons), and this implies the existence of nearby O/B stars. It is therefore natural to expect that these nearby stars will chemically alter the surrounding clumps (Schilke et al. 1992; Fuente et al. 1993), the shock fronts created by these stars as a result of mass loss phenomena are expected to modify the gas chemistry in the clumps. Furthermore, the photodissociation and photoionization of molecules by the UV radiation can drastically change the chemical composition in the regions where molecules are poorly shielded (Fuente et al. 1993; Caselli et al. 2011). However, such changes may not be detectable if the clump and the HII region traced by 6 cm or 20 cm continuum emission are at different distances along the line of sight.
This discussion suggests that if one clump is associated with 20 cm radio continuum emission, its chemistry may be strongly affected by nearby O/B stars. It is therefore important to know whether there is a difference in the global molecular line ratios between the clumps that coincide with 20 cm continuum emission and the clumps that do not.
Figure 1 illustrates the global line ratios ICN/IHCN, ICN/IHNC, and IHCN/IHNC for HMSCCs. The mean values of ICN/IHCN for HMSCCs coincide with 20 cm continuum emission, and those that do not are 0.41 ± 0.04 and 0.42 ± 0.12. However, the values of ICN/IHNC for HMSCCs that coincide with 20 cm continuum emission are much higher than those for HMSCCs that do not coincide with 20 cm continuum emission, and their mean values are 1.16 ± 0.3 and 0.30 ± 0.16. This is the same for IHCN/IHNC, with mean values of 3.02 ± 1.09 and 0.71 ± 0.32. For HMSCCs that coincide with 20 cm continuum emission, this indicates a true connection between the respective clumps and the associated emission from the ionized gas, and the chemistry of the gas seems to change due to the existence of some nearby O/B stars. ICN/IHNC and IHCN/IHNC for HMSCCs are sensitive to the appearance of 20 cm continuum emission.
Global line ratios for CN(1-0), HCN(1-0), HNC(1 − 0), and HCO+(1 − 0) for ten galaxies.
 |
Fig. 1 Global line ratios IHCN/IHNC, ICN/IHNC and ICN/IHCN for high-mass starless clumps that coincide with 20 cm continuum emission (denoted by IHCN/IHNC-Y, ICN/IHNC-Y and ICN/IHCN-Y) and those high-mass starless core clumps that do not coincide with 20 cm continuum emission (denoted by IHCN/IHNC-N, ICN/IHNC-N and ICN/IHCN-N). |
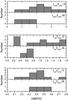 |
Fig. 2 Global line ratios IHCN/IHNC, ICN/IHNC and ICN/IHCN for high-mass protostar clumps that coincide with 20 cm continuum emission (denoted by IHCN/IHNC-Y, ICN/IHNC-Y and ICN/IHCN-Y) and those high-mass protostar clumps that do not coincide with 20 cm continuum emission (denoted by IHCN/IHNC-N, ICN/IHNC-N and ICN/IHCN-N). |
Figure 2 shows the global line ratios ICN/IHCN, ICN/IHNC, and IHCN/IHNC for HMPOCs. The ICN/IHCN values for HMPOCs that coincide with 20 cm continuum emission are almost the same as those of HMPOCs that do not coincide with 20 cm continuum emission, and their mean values are 0.42 ± 0.14 and 0.44 ± 0.11. The ratios of ICN/IHCN for HMPOCs are similar to that of HMSCCs, and both are insensitive to the 20 cm continuum emission. Most ICN/IHNC values for HMPOCs that coincide with 20 cm continuum emission are higher than those for HMPOCs that do not coincide with 20 cm continuum emission, and their corresponding mean values are 0.98 ± 0.52 and 0.60 ± 0.12. The mean values of IHCN/IHNC for HMPOCs that coincide and HMPOCs that do not coincide with 20 cm continuum emission are 2.24 ± 0.77 and 1.42 ± 0.41. It seems that the relative variations caused by nearby O/B stars are not as strong as the variations found in HMSCCs. This may be ascribed to two reasons. One is that star formation activities in the HMPOC play an important role in its chemical conditions. Another is that there may be no association between some HMPOCs and the 20 cm continuum emission, which are merely coinciding along the line of sight.
HMPOCs I18310-0825A, I18310-0825B, I18337-0743, and I23033+5951 coincide with 20 cm continuum emission, but their line ratios ICN/IHNC and IHCN/IHNC are lower than or approximate to those of HMPOCs that do not coincide with 20 cm continuum emission. Hence we tentatively assume that these four HMPOs are not associated with 20 cm continuum emission; they just coincide along the line of sight. Then, ICN/IHCN, ICN/IHNC, and IHCN/IHNC for HMPOCs associated with 20 cm continuum emission are 0.49 ± 0.1, 1.34 ± 0.54, and 2.77 ± 0.43, respectively, and the corresponding mean values for HMPOCs that are not associated with 20 cm continuum emission are 0.36 ± 0.12, 0.48 ± 0.18 and 1.36 ± 0.35, respectively. This suggests that star formation activities in HMPOCs play a small role in their surface chemistry; ICN/IHNC and IHCN/IHNC of HMPOCs are also sensitive to the appearance of 20 cm continuum emission.
UCHIICs usually show strong radio emission at 3.6 (6) cm and 20 cm wavelength. High-mass star formation processes may have ended at this stage, and newly formed stars will strongly affect the physical and chemical conditions of the parental clump. The global line ratios ICN/IHCN, ICN/IHNC, and IHCN/IHNC of UCHIICs that coincide with 20 cm continuum emission are similar to those of UCHIICs that do not (see Fig. 3), and the mean values are 0.38 ± 0.13 and 0.5 ± 0.14 for ICN/IHCN, 1.12 ± 0.23 and 1.21 ± 0.46 for ICN/IHNC, and 3.11 ± 0.45 and 2.46 ± 0.79 for IHCN/IHNC. This suggests that star formation activities in UCHIICs play an important role in their physical and chemical conditions. ICN/IHNC and IHCN/IHNC for UCHIICs are not sensitive to the appearance of 20 cm continuum emission.
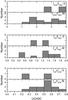 |
Fig. 3 Global line ratios IHCN/IHNC, ICN/IHNC and ICN/IHCN for UCHII region clumps that coincide with 20 cm continuum emission (denoted by IHCN/IHNC-Y, ICN/IHNC-Y and ICN/IHCN-Y) and those UCHII region clumps that do not coincide with 20 cm continuum emission (denoted by IHCN/IHNC-N, ICN/IHNC-N and ICN/IHCN-N). |
HIICs are molecular clouds surrounding large HII regions (see Fig. B.1), where high-mass stars produce large amounts of ionizing photons with energies above 13.6 eV that are capable of ionizing hydrogen in the vicinity. HIICs in our sample all coincide with strong and extended 20 (or 6) cm continuum emission. The physical and chemical conditions of HIICs are inevitably affected by the HII region. The mean values of ICN/IHCN, ICN/IHNC, and IHCN/IHNC for HIICs are 0.56 ± 0.14, 1.58 ± 0.52 and 2.93 ± 1.07, respectively, and are higher than the corresponding values for UCHIICs.
In summary, the global line ratios ICN/IHNC and IHCN/IHNC for HMSCCs and HMPOCs that are associate with 20 cm continuum emission are much higher than those for HMSCCs and HMPOCs that are not associated with 20 cm continuum emission. This strongly confirms that the 20 cm continuum emission indicates the existence of some O/B stars, whose stellar wind and UV photons affect the surface chemistry of the nearby clumps (Caselli et al. 2011). Star formation activities proceeding in HMSCCs and HMPOCs seem to contribute little to their surface chemistry. The ICN/IHNC and IHCN/IHNC of UCHIICs are mainly determined by their internal star formation activities.
4.2. Variations of the line ratio in high-mass star-forming regions
Since the global ratios ICN/IHNC and IHCN/IHNC for HMSCCs and HMPOCs are sensitive to the 20 cm continuum emission that is associated with them, we have to select the HMSCCs and HMPOCs that are not associated with external 20 cm continuum emission to study whether variations in the line ratios ICN/IHNC and IHCN/IHNC trace the evolution of high-mass star-forming regions. Because UCHIICs and HIICs are not sensitive to the 20 cm continuum emission associated with them, all of them are used in the analysis. The mean ICN/IHCN values for HMSCCs, HMPOCs, UCHIICs, and HIICs are 0.41 ± 0.04, 0.36 ± 0.12, 0.48 ± 0.14, and 0.56 ± 0.14, respectively, suggesting that the ratio is not sensitive to the evolution of high-mass star-forming regions. The mean ICN/IHNC values for HMSCCs, HMPOCs, UCHIICs, and HIICs are 0.3 ± 0.16, 0.48 ± 0.18, 1.20 ± 0.44, and 1.58 ± 0.52, respectively. The mean IHCN/IHNC values for HMSCCs, HMPOCs, UCHIICs, and HIICs are 0.71 ± 0.32, 1.36 ± 0.35, 2.55 ± 0.79, and 2.93 ± 1.07, respectively. Both ICN/IHNC and IHCN/IHNC increase with the age of star-forming regions, and this suggests that they are promising to be good indicators of the high-mass star formation sequence. In contrast to the result of Hoq et al. (2013), our result for IHCN/IHNC displays a much more obviously increasing trend with proceeding evolution of high-mass star-forming regions.
However, we note that ICN/IHNC values for HMSCCs are similar to those for HMPOCs, but much lower than those for UCHIICs and HIICs, the latter two having similar ICN/IHNC. The variation of IHCN/IHNC is similar to that of ICN/IHNC. It is therefore reasonable to divide our sources into two types. Type 1 includes HMSCCs and HMPOCs that are not associated with external 20 cm continuum emission. Type 2 includes all UCHIICs and HIICs. We can then expect the global line ratios ICN/IHNC and IHCN/IHNC to trace the evolution from type 1 to type 2 sources well.
Figure 4 shows the distribution of the global line ratios ICN/IHNC and IHCN/IHNC for type 1 and type 2 sources. The mean values of ICN/IHNC and IHCN/IHNC are 0.44 ± 0.19 and 1.21 ± 0.44 for type 1 sources, and 1.35 ± 0.5 and 2.70 ± 0.93 for type 2 sources. ICN/IHNC and IHCN/IHNC display an obvious trend of increase from type 1 to type 2 sources, but there is still some overlap between the type 1 and 2 sources. This may be because high-mass star-forming regions evolve continuously from HMSCs to HMPOs, to UCHII, and finally to HII regions, and there is some overlap between the end of one evolutionary stage and the beginning of the next evolutionary stage.
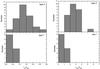 |
Fig. 4 Global line ratios IHCN/IHNC and ICN/IHNC for type 1 and 2 sources, which show a clear trend of increase from type 1 to type 2 sources. |
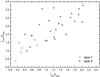 |
Fig. 5 Plot of IHCN/IHNC versus ICN/IHNC showing that type 1 and 2 sources can be distinguished from each other. Circles and asterisks represent type 1 and type 2 sources. |
Figure 5 shows a diagram of ICN/IHNC versus IHCN/IHNC, which indicates that most type 1 and type 2 sources can be distinguished from each other. Hence the global line ratios ICN/IHNC and IHCN/IHNC appear to be good tracers for the evolution of high-mass star-forming regions.
4.3. Distributions of CN(1-0), HCN(1-0), and HNC(1-0) for the clumps
Figure B.1 suggests that CN(1-0), HCN(1-0), and HNC(1-0) have a similar distribution for most dense clumps. However, this is not true when the dense clump is strongly affected by O/B stars on one side or where the clump is diffuse or partly diffuse. Figure 6 displays the distributions of CN(1-0), HCN(1-0), and HNC(1-0) for four representative clumps.
For the HMPOC I05358+3543, the distributions of CN(1-0), HCN(1-0), and HNC(1-0) are similar. There is no 6 or 20 cm continuum emission nearby the clump. However, for the HMPOC I20343+4129, the distribution of CN(1-0) is similar to that of HCN(1-0), but is different from that of HNC(1-0). CN(1-0) and HCN(1-0) emission extends farther to the northeast than HNC(1-0) emission does. The fact that the clump partly coincides with 20 cm radio continuum emission indicates that O/B stars may appear to the northeast of the clump; the differences between distributions of CN(1-0), HCN(1-0), and HNC(1-0) may be ascribed to the influence of nearby O/B stars (de Jong 1977; Hollenbach 1988). For HMPOC I18517+0437, CN(1-0), HCN(1-0), and HNC(1-0) have similar distributions in the dense part of the clump. However, relatively strong and extended CN(1-0) emission was detected to the west and north of the clump where the gas is diffuse. This may be due to the low optical depth and enhanced UV radiation. G22.35+0.41 has diffuse clumps, where HCN(1-0) emission is relatively strong, HNC(1-0) and CN(1-0) are marginally detected. The distributions of CN(1-0), HCN(1-0), and HNC(1-0) are different from each other.
In summary, CN(1-0), HCN(1-0), and HNC(1-0) have similar distributions for the dense clumps without being affected by environment. CN(1-0) and HCN(1-0) have a similar distribution for the dense clumps exposed to strong UV radiation. Furthermore, CN(1-0), HCN(1-0), and HNC(1-0) tend to have different distributions for the diffuse clump or for the diffuse part of the clump.
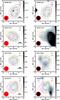 |
Fig. 6 Contour maps for the integrated intensity of CN 1-0 (green), HCN (red) and HNC 1-0 (blue) for four representative clumps superimposed on their respective continuum map in gray scale at 8.4 (or 4.8) GHz (left) and 1.4 GHz continuum map (right). The contour levels are 30%, 50%, 70%, and 90% of the map peak, the heavy lines represent 50%. Here CN(1-0), HCN(1-0), and HNC(1-0) emission of G22.35+0.41 is very weak, the corresponding contour levels are 2σ, 3σ (heavy line), 4σ, and 5σ. The red asterisk in the map indicates the position of HMSC, HMPO, UCHII, and HII regions. The red circle in the bottom left corner represents the FWHM beam size for the molecular lines, the enclosed black circle indicates continuum emission observations. The horizontal lines in the bottom right corner of the left panels indicate the linear scale corresponding to one arcminute at the distance of the respective clump. The unit of the gray scale bar on the right is in Jy/beam. |
4.4. Global properties of the ISM in external galaxies
Our results suggest that the global line ratios between CN(1-0), HCN(1-0), and HNC(1-0) can be used to distinguish dense cold clumps from dense warm clumps and clumps associated with UCHII regions. Because external galaxies are far away from us, single-dish observations toward them usually cover a huge amounts of ISM, we thus obtain the global properties of the ISM. Taking into account that the global properties of the ISM in the galaxies may be determined by warm dense gas or PDRs or X-ray dominated region (XDRs; Aalto et al. 2007; Aalto 2013), we may use the global line ratios between CN(1-0), HCN(1-0), and HNC(1-0) to distinguish them and to study the evolution of galaxies.
Fortunately, Costagliola et al. (2011) published their multimolecular line survey data for 24 nearby galaxies, which includes CN(1-0), HCN(1-0), HNC(1-0), HCO+(1-0), and many other lines (see their Table E.1). CN(1-0), HCN(1-0), HNC(1-0), and HCO+(1-0) were detected in ten galaxies; we calculated their line ratios (see Table 3). Since CN is sensitive to the UV and X-ray radiation, the abundance enhancement of CN over HCN is greater in XDR (factors 40 to 1000) than in PDR (factors 0.5 to 2) (Lepp & Dalgarno 1996; Meijerink & Spaans 2005; Aalto et al. 2007; Aalto 2013). It is therefore reasonable to expect that the line ratio ICN/IHCN increases from a dense warm gas-dominated ISM to a PDR-dominated ISM and to an XDR-dominated ISM. We arrange the ten galaxies in ascending order by ICN/IHCN (see Table 3). It is interesting to find that ICN/IHNC, IHCN/IHNC, and IHCO+/IHNC increase from ;7771 to NGC 6240, then decrease from UGC 2866 to UGC 5101, except for NGC 1614 and NGC 4194. If we tentatively assume that the ISM of NGC 7771 is dominated by warm dense gas, NGC 3079, NGC 3556, and NGC 6240 are dominated by PDRs, and UGC 2866, NGC 660, NGC 7469, and UGC 5101 are dominated by XDRs, and their line ratios and the corresponding variations can be well explained.
For NGC 7771, IHCO+/IHCN< 1 suggests that the ISM is dominated by dense warm gas (Loenen et al. 2006; Baan et al. 2008). IHCN/IHNC is greater than the corresponding average value of HMPOCs, but lower than that of UCHIICs. This also supports that the ISM of NGC 7771 is dominated by dense warm gas, where the abundance of HNC decreases with increasing gas temperature owing to the temperature dependence of neutral-neutral reactions, and so it is natural to expect IHCN/IHNC> 1 (Costagliola et al. 2011).
For the ISM that is dominated by PDRs, IHCO+/IHCN increases from 0.25 to 2 (Baan et al. 2008). Shocks excited by supernova explosions will increase IHCO+/IHCN (Loenen et al. 2006; Baan et al. 2008), and mechanical heating by supernovae explosions could also increase IHCN/IHNC in PDRs (Loenen et al. 2006). The variations of IHCO+/IHCN and IHCN/IHNC for NGC 3079, NGC 3556, and NGC 6240 suggest that they are probably dominated by PDRs. ICN/IHCN is slightly greater than that of UCHIICs, but ICN/IHNC and IHCN/IHNC are much greater than that of UCHIICs. One possible reason may be that the star formation efficiency for UCHIIC is much lower than that of ISM dominated by PDRs in external galaxies.
However, when the ISM is dominated by XDRs and so HCO+(1-0) is destroyed where HCN(1-0) may show high abundances that cause the IHCO+/IHCN to decrease (Lepp & Dalgarno 1996; Maloney et al. 1996; Aalto et al. 2007). Chemistry dominated by hard X-rays may lead to an enhancement of the HNC abundance (Meijerink et al. 2006). Hence ICN(1 − 0)/IHCN(1 − 0), IHCO+(1 − 0)/IHCN(1 − 0), and IHCN(1 − 0)/IHNC(1 − 0) values of UGC 2866, NGC 660, NGC 7469, and UGC 5101 suggest that they may be dominated by XDRs. The decrease in IHCO+(1 − 0)/IHCN(1 − 0) and IHCN(1 − 0)/IHNC(1 − 0) may be ascribed to increasing X-ray radiation and a decreasing optical depth of the lines. The CN(1-0), HCN(1-0), HNC(1-0), and HNC(1-0) emissons of NGC 1614 and NGC 4194 are much weaker than those of UGC 2866, NGC 660, NGC 7469, and UGC 5101. They seem to represent a later evolutionary stage of the ISM dominated by XDR, where much molecular gas has been depleted.
This analysis suggests that the global line ratios between CN(1-0), HCN(1-0), HNC(1-0), and HCO+(1-0) may be used to distinguish the ISM dominated by dense warm gas, PDRs and XDRs. This provides an important tool for studying the evolution of galaxies.
5. Conclusions
We have performed CN(1-0), HCN(1-0), and HNC(1-0) mapping observations toward 38 high-mass star-forming regions of different evolutionary stages and identified 5 HMSCCs, 14 HMPOCs, 15 UCHIICs, and 10 HIICs. We studied the global line ratios for these molecular clumps and determined whether the global line ratios ICN/IHCN, ICN/IHNC, and IHCN/IHNC are suitable as tracers for the evolution of high-mass star-forming regions in the Milky Way. We obtained the following results:
-
(1)
ICN/IHNC and IHCN/IHNC values for HMSCCs and HMPOCs are sensitive to the 20 cm continuum emission associated with them, which means the appearance of O/B stars. However, ICN/IHNC and IHCN/IHNC for UCHIICs are not sensitive to the 20 cm continuum emission associated with them. This suggests that the chemical properties of high-mass star-forming regions at early stages are more easily affected by nearby O/B stars.
-
(2)
When we removed the HMSCCs and HMPOCs associated with 20 cm continuum emission, both ICN/IHNC and IHCN/IHNC increased with the age of star-forming regions. The ICN/IHNC values for HMSCCs, HMPOCs, UCHIICs, and HIICs are 0.3 ± 0.16, 0.48 ± 0.18, 1.20 ± 0.46, and 1.58 ± 0.52, respectively. The corresponding values of IHCN/IHNC are 0.71 ± 0.32, 1.36 ± 0.35, 2.55 ± 0.79, and 2.93 ± 1.07.
-
(3)
We tentatively divided the star-forming regions into two types. Type 1 sources include HMSCCs and HMPOCs that are not associated with external 20 cm continuum emission. Type 2 sources include all UCHIICs and HIICs. The line ratios ICN/IHNC and IHCN/IHNC can trace the evolution from type 1 to type 2 well.
-
(4)
The line ratio ICN/IHCN is not sensitive to the evolution of high-mass star-forming regions in the Milky Way.
-
(5)
The global line ratios between CN(1-0), HCN(1-0), HNC(1-0), and HCO+(1-0) may be used to distinguish the ISM of the galaxies dominated by dense warm gas, PDRs, and XDRs.
Online material
Appendix A: Tables
Information for observed sources in cm and mm wavelengths and their evolutionary stages.
Observing information for the VLA archival data and the results for radio continuum emission.
Results of the Gaussian fit obtained from the averaged CN(1-0) emission for each clump.
Results of the Gaussian fit obtained from the averaged HCN(1-0) emission for each clump.
Results of the Gaussian fit obtained from the averaged HNC(1-0) emission for each clump.
Appendix B: CN(1-0), HCN(1-0) and HNC(1-0) maps of all clumps
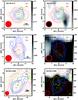 |
Fig. B.1 Contour maps for the integrated intensity of CN 1-0 (green), HCN (red) and HNC 1-0 (blue) from each clump superimposed on their respective continuum map in gray scale at 8.4 (or 4.8) GHz (left) and 1.4 GHz continuum map (right). The contour levels are 30%, 50%, 70%, and 90% of the map peak. The heavy lines represent 50% of the map peak. Here CN(1-0), HCN(1-0), and HNC(1-0) emission of G22.35+0.41, G23.60+0.00A, G23.60+0.00B, I18310-0825A and I18310-0825B is very weak, the corresponding contour levels are 2σ, 3σ (heavy line), 4σ and 5σ, respectively. The red asterisk in the map indicates the position of HMSC, HMPO, UCHII and HII regions. The red circle in the bottom left corner represents the FWHM beam size for molecular lines, the enclosed black circle indicates continuum emission observations. The short line in the bottom right corner of the left panel indicates the linear scale corresponding to one arcminute at the distance of the clump. The unit of the gray scale bar on the right is in Jy/beam. |
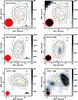 |
Fig. B.1 continued. |
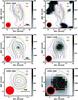 |
Fig. B.1 continued. |
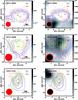 |
Fig. B.1 continued. |
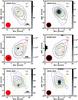 |
Fig. B.1 continued. |
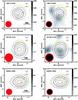 |
Fig. B.1 continued. |
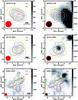 |
Fig. B.1 continued. |
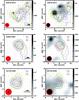 |
Fig. B.1 continued. |
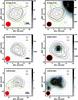 |
Fig. B.1 continued. |
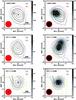 |
Fig. B.1 continued. |
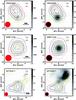 |
Fig. B.1 continued. |
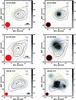 |
Fig. B.1 continued. |
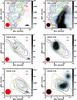 |
Fig. B.1 continued. |
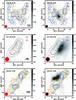 |
Fig. B.1 continued. |
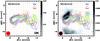 |
Fig. B.1 continued. |
Appendix C: CN(1-0), HCN(1-0), and HNC(1-0) spectrum of all clumps
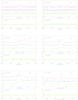 |
Fig. C.1 The CN(1-0), HCN(1-0) and HNC(1-0) spectra averaged over each clump. |
 |
Fig. C.1 continued. |
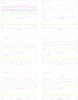 |
Fig. C.1 continued. |
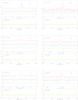 |
Fig. C.1 continued. |
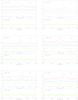 |
Fig. C.1 continued. |
 |
Fig. C.1 continued. |
 |
Fig. C.1 continued. |
 |
Fig. C.1 continued. |
Appendix D: Detailed description of all clumps
We performed CN(1-0), HCN(1-0) and HNC(1-0) map observations toward 38 high-mass star-forming regions with a size of 10′×10′ and identified 44 high-mass clumps at different evolutionary stages. Below we briefly introduce all star-forming regions and molecular clumps.
G22.35+0.41−1: There is one small molecular clump in the mapped region, at the center of which the HMSC G22.35+0.41−1 is located. Hence the clump is classified as HMSCC (high-mass starless core clump). The western part of HMSCC G22.35+0.41 coincides with weak 20 cm continuum emission, which is an indicator for the presence of UV photons. This idea is supported by the detection of weak CN(1-0) emission that comes only from the western part of the clump.
G23.60+0.00-2: There are two molecular clumps in the mapped region. HMSCs G23.60+0.00-2, -4 and -7 lie in a small clump G23.60+0.00A, which is classified as HMSCC. HMSCC G23.60+0.00A coincides with the 20 cm continuum emission. HMSCs G23.60+0.00-1 and -3 and the UCHII region G23.60+0.00-5 lie in clump G23.60+0.00B, and so the clump is classified as UCHIIC (ultra-compact HII region clump). G23.60+0.00B coincides with 20 cm continuum emission. CN(1-0) emission is strong around the UCHII region G23.60+0.00-5 and extends to the north. The line velocity of G23.60+0.00A is much lower than that of G23.60+0.00B (see Table 2), the two clumps are probably at different distances along the line of sight.
G34.43+0.24-3: Two molecular clumps are identified in the mapping region. HMSC G34.43+0.24-3, -6, and -9 lie in clump G34.43+0.24A, making G34.43+0.24A a HMSCC. There is no 20 cm continuum emission detected nearby the clump. HMPO G34.43+0.24-2 and HMSCs G34.43+0.24-1, -4, -5, and -8 also lie in clump G34.43+0.24B, the clump is therefore classified as HMPOC (high-mass protostar clump). There is weak 20 cm emission detected from the clump.
I18151−1208-2: There are two clumps in the mapped region, but they are not clearly separated. HMSC I18151−1208-2 is located at the center of the clump I18151−1208A, and so the clump is classified as HMSCC. HMPO I18151−1208-1 is located at the center of the clump I18151−1208B, classifying the clump as HMPOC. Both clumps coincide with 20 cm continuum emission.
I18223-1243-3: There are two clumps in the mapped region. HMSC I18223-1243-3 and HMSC I18223-1243-4 are located at the center and at the southern border of the clump I18223-1243A, respectively, making the clump an HMSCC. In addition, HMPO I18223-1243-1 is located at the center of the clump I18223-1243B. There is one relatively strong radio source at 3.6 cm continuum emission detected at the center of the clump, suggesting that there is one UCHII region, at I18223-1243B, classified as UCHIIC. The clump also partly coincides with strong 20 cm continuum emission that extends from the south to the north.
I18306-0835-3: One molecular clump was identified in the mapped region, I18306-0835. HMPO I18306-0835-1 is located at the center of the clump I18306-0835A. There is relatively strong continuum emission at 6 cm close to the HMPO, and together with the strong radio continuum emission source detected at 3.6 cm (Sridharan et al. 2002), this suggests that there is one UCHII region at the center of the clump. I18306-0835 is therefore classified as UCHIIC, and the clump coincides with the relatively weak and extended 20 cm continuum emission. The parental clump of HMSC I18306-0835-3 was not detected.
I18310-0825-4: There are two clumps in the mapped region. HMPO I18310-0825-2 and HMSCs I18310-0825-3 and -4 lie in the clump I18310-0825A, and HMPO I18310-0825-1 lies in the clump I18310-0825B classifying these two clumps as HMPOC. I18310-0825A partly coincides with 20 cm continuum emission, while I18310-0825B completely coincides with 20 cm continuum emission.
I18337-0743-3: There is only one dense molecular clump I18337-0743 identified in the mapped region, which contains HMPO I18337-0743-1 and HMSC I18337-0743-5. The clump is classified as HMPOC. Here the distribution of CN(1-0) is similar to that of HCN(1-0), but is different from that of HNC(1-0). I18337-0835-1 is located at the center of CN(1-0) and HCN(1-0) map. HMPOC I18337-0743 coincides with 20 cm continuum emission at its northeastern part. We did not detect the dense clump in which I18337-0743-3 has formed.
I18530+0215-2: One dense clump was identified in the mapped region. HMSC I18530+0215-2 lies on the southwestern border of the clump, while HMPO I18530+0215 is located at the center of it. There is strong continuum emission (6 and 20 cm) close to the HMPO, and together with one detected radio source with strong continuum emission at 3.6 cm (Sridharan et al. 2002), this suggests that there is one UCHII region at the center of the clump, making the clump a UCHIIC.
I01202+6133: There is one molecular clump in the mapped region, with HMPO I01202+6133 located at the center. The clump is classified as HMPOC. HMPOC I01202+6133 partly coincides with 20 cm continuum emission.
I05358+3543: There is one dense molecular clump identified in the mapped region, in which HMPO I05358+3543-1 and -4, HMSCs I05358+3543-2 and -3 lie. HMPO I05358+3543-1 is located close to the center of the clump and shows very weak continuum emission at 6 cm. We classify the clump I05358+3543 as HMPOC. There is no 20 cm continuum emission nearby it.
I18445-0222: There is one dense clump in the mapped region, HMPO I18445-0222-1 is located in the southern part of it. However, one radio source with relatively strong continuum emission at 3.6 cm was detected close to the HMPO (Sridharan et al. 2002), this suggests that there is one UCHII region at the center of the clump. Thus we classify the clump as UCHIIC. UCHIIC I18445-0222 partly coincides with very weak 20 cm continuum emission.
I18517+0437: There is one dense molecular clump in the mapped region, HMPO I18517+0437-1 is located at its center, and HMPO I18517+0437-2 lies to the northwest of the clump. We therefore classify the clump as HMPOC. HMPOC I18517+0437 partly coincides with very weak 20 cm continuum emission.
I20126+4104: There is one dense molecular clump in the mapped region, with HMPO I20126+4104 located at the center, showing very weak 3.6 cm continuum emission, which makes the clump a HMPOC. HMPOC I20216+4104 partly coincides with very weak 20 cm continuum emission.
I20293+3952: One dense molecular clump is present in the mapped region, at the center of which HMPO I20293+3952-1 is located. It shows very weak 3.6 cm continuum emission, and HMPO I20293+3952-2 lies to the north of it. So clump I20293+3952 is classified as HMPOC. There is no 20 cm continuum emission nearby it.
I20343+4129: The one dense molecular clump present in the mapped region contains HMPOs I20343+4129-1 and -2, which are located at the center of the clump and close to each other, whereas HMPO I20343+4129-3 lies to the west of the clump. Hence the clump is classified as HMPOC. HMPOC I20343+4129 partly coincides with 20 cm continuum emission.
I22134+5834: The dense molecular clump in the mapped region, with HMPO I22134+5834 located at its center, can be classified as HMPOC. HMPOC I22134+5834 partly coincides with the weak 20 cm continuum emission. This indicates that some O/B stars may exist close to the clump, and the idea is supported by CN(1-0) and HCN(1-0) emission that extends to the west and south.
I22551+6221: There is one molecular complex in the mapped region, HMPO I22551+6221 is located at the northwestern border of it. HMPO I22551+6221 seems to be accompanied by one UCHII reigon (Sridharan et al. 2002). The molecular complex coincides with strong and extended continuum emission at 20 cm, which traces one large HII region. We thus classify the molecular complex I22551+6221 as HIIC (HII region clump).
I22570+5912: There is one molecular complex in the mapped region, within which HMPOs I22570+5912-1, -2, -4, and HMSC I22570+5912−3 are located. HMPO I22570+5912-1 appears to be accompanied by one UCHII region (Sridharan et al. 2002). The molecular complex coincides with strong and extended 20 cm continuum emission, which traces one large HII region. The distortion at the northern border of the complex indicates that it may be interacting with HII region. Hence we classify the complex as HIIC.
I23033+5951: There is one dense molecular clump in the mapped region, with the HMPO I23033+5951 located at the center. The clump is classified as HMPOC. HMPOC I23033+5951 partly coincides with very weak 20 cm continuum emission.
I23139+5939: The dense molecular clump in the mapped region, with HMPO I23139+5939 located at the center, is classified as HMPOC. HMPOC I23139+5939 coincides es with very weak 20 cm continuum emission.
I03035+5819: There is one dense molecular clump identified in the mapped region, UCHII region I03035+5819 is located at its center and emits continuum emission at 3.6 cm and 20 cm. The clump is classified as UCHIIC.
I19078+0901: There is one dense molecular clump in the mapped region, with UCHII regions I19078+0901-1, -2 and -3 in it, and they emit very strongly at 3.6 cm and 20 cm. The clump is classified as UCHIIC.
I19097+0847: There is one dense molecular clump in the mapped region, in which UCHII regions I19097+0847-1 and -2 lie. They emit strongly at 3.6 cm and 20 cm, classifying the clump as UCHIIC.
I19111+1048: There are two molecular clumps in the mapped region. UCHII region I19111+1048 is located at the center of clump I19111+1048A, and emits strongly at 3.6 cm and 20 cm. The 20 cm continuum emission shows a cometary morphology. UCHII region I19110+1045 is located at the center of clump I19111+1048B and emits strongly at 3.6 cm and 20 cm. These two clumps are both classified as UCHIIC.
I19442+2427: There is one dense molecular clump in the mapped region, in which the compact HII regions I19442+2427-1, HMSC I19442+2427-2, and HMPO I19442+2427-3 lie. UCHII region I19442+2427-1 emits strongly at 3.6 cm and 20 cm. We classify the clump as UCHIIC.
I20081+3122: The dense molecular clump in the mapped region contains UCHII region I20081+3122, which is located at the center of the clump and emits at 6 cm and 20 cm. We classify the clump as UCHIIC.
I23116+6111: There is one dense molecular clump in the mapped region, at whose northern border lies UCHII region I23116+6111. It emits strongly at 3.6 cm and 20 cm. However, strong and extended 3.6 cm and 20 cm continuum emission suggests that one large HII region lies to the north of the clump and appears to be interacting with the molecular clump. Hence we classify the clump as HIIC.
I23138+5945: There is one dense molecular clump in the mapped region, UCHII region I23138+5945 is located at its center and emits strongly at 3.6 cm and 20 cm, with the latter emission shows a cometary morphology. We classify the clump as UCHIIC.
I23133+6050: One dense molecular clump was identified in the mapped region, UCHII region I23133+6050 is located at its center and emits strongly at 3.6 cm and 20 cm. We classify the clump as UCHIIC.
U49.49-0.37: There is one very dense molecular clump in the mapped region, UCHII region U49.49-0.37 lies in it and emits strongly at 6 cm and 20 cm. The CN(1-0) and HCN(1-0) emission extends to the northeast. We classify the clump as UCHIIC.
C41.1-0.21: There is one diffuse molecular complex in the mapped region. The HII region traced by 20 cm continuum emission shows a shell morphology and seems to be interacting with the molecular complex. The molecular complex is classified as HIIC.
C48.93-0.29: There is one dense molecular clump in the mapped region, where the HII region traced by 6 cm and 20 cm continuum emission coincides with the northeastern part of the clump. This HII region appears to be still surrounded by the clump. We classify the molecular clump as HIIC.
C49.00-0.30: The HII region traced by 20 cm continuum emission shows a shell morphology. The molecular clump partly coincides with the HII region and seems to be intersecting with it at a nearly right angle. The CN(1-0) and HCN(1-0) emission extends to the northeast. We classify the molecular clump as HIIC.
C49.38-0.30: There is one dense molecular complex in the mapped region, which is composed of several dense clumps. The HII region traced by 6 cm and 20 cm continuum emission shows a V-like morphology, which is consistent with the characteristics of the distribution of dense molecular clumps. The complex is classified as HIIC.
C51.36-0.00: There is one dense molecular clump in the mapped region. It partly coincides with the HII region traced by 20 cm continuum emission. The clump is classified as HIIC.
C52.94-0.59: There is one diffuse molecular complex in the mapped region with very weak CN(1-0), HCN(1-0), and HNC(1-0) emission. The HII region traced by 20 cm continuum emission shows an arc morphology and seems to be interacting with the molecular complex. The complex is therefore classified as HIIC.
D53.64+0.24: There is one diffuse molecular complex in the mapped region with very weak CN(1-0), HCN(1-0), and HNC(1-0) emission. The HII region, as shown by tracing the 20 cm continuum emission, seems to surround the complex. The complex is classified as HIIC.
Acknowledgments
We thank Ye Xu and Xing-Wu Zheng for their help. We are very grateful to the staff of Qing hai Station at Purple Mountain Observatory for their assistance with the observations and data reductions. We thank Xiang-jun Shao, Juan Li, and Zhi-yu Zhang for help with VLA data reduction, and Rai Yuen for reading the manuscript. This work was funded by The National Natural Science foundation of China under Grant 11433008 and partly supported by National Basic Research Program of China (973 program, 2012CB821802) and the National Natural Science foundation of China under Grant 11373062 and 11303081, and The Program of The Light in China’s Western Region under grant Nos. RCPY201202 and XBBS-2014-24.
References
- Aalto, S. 2013, IAUS, 292, 199 [NASA ADS] [Google Scholar]
- Aalto, S., Polatidis, A. G., Hüttemeister, S., & Curran, S. J. 2002, A&A, 381, 783 [NASA ADS] [CrossRef] [EDP Sciences] [Google Scholar]
- Aalto, S., Monje, R., & Martin, S. 2007, A&A, 475, 479 [NASA ADS] [CrossRef] [EDP Sciences] [Google Scholar]
- Anderson, L. D., & Bania, T. M. 2009, ApJ, 690, 706 [NASA ADS] [CrossRef] [Google Scholar]
- Araya, E., Hofner, P., Churchwell, E., & Kurtz, S. 2002, ApJS, 138, 63 [NASA ADS] [CrossRef] [Google Scholar]
- Baan, W. A., Henkel, C., Loenen, A. F., Baudry, A., & Wiklind, T. 2008, A&A, 477, 747 [NASA ADS] [CrossRef] [EDP Sciences] [Google Scholar]
- Baan, W. A., Loenen, A. F., & Spaans, M. 2010, A&A, 516, A40 [NASA ADS] [CrossRef] [EDP Sciences] [Google Scholar]
- Beuther, H., Schilke, P., Menten, K. M., et al. 2002, ApJ, 566, 945 [NASA ADS] [CrossRef] [Google Scholar]
- Boger, G. I., & Sternberg, A. 2005, ApJ, 632, 302 [NASA ADS] [CrossRef] [Google Scholar]
- Bronfman, L., Nyman, L.-A., & May, J. 1996, A&AS, 115, 81 [NASA ADS] [Google Scholar]
- Caselli, P. 2011, IAUS, 280, 19 [Google Scholar]
- Condon, J. J., Cotton, W. D., Greisen, E. W., et al. 1998, AJ, 115, 1693 [NASA ADS] [CrossRef] [Google Scholar]
- Costagliola, F., Aalto, S., Rodriguez, M. I., et al. 2011, A&A, 528, A30 [NASA ADS] [CrossRef] [EDP Sciences] [Google Scholar]
- Fich, M., & Blitz, L. 1984, ApJ, 279, 125 [NASA ADS] [CrossRef] [Google Scholar]
- Fuente, A., Martìn-Pintado, J., Cernicharo, J., & Bachiller, R. 1993, A&A, 276, 473 [NASA ADS] [Google Scholar]
- Gerner, T., Beuther, H., Semenov, D., et al. 2014, A&A, 563, A97 [NASA ADS] [CrossRef] [EDP Sciences] [Google Scholar]
- Goldsmith, P. F., Hjalmarson, A., & Ellder, J. 1986, ApJ, 310, 685 [Google Scholar]
- Helfand, D. J., Becker, R. H., White, R. L., Fallon, A., & Tuttle, S. 2006, AJ, 131, 2525 [NASA ADS] [CrossRef] [Google Scholar]
- Helmich, F. P., & van Dishoeck, E. F. 1997, A&AS, 124, 205 [NASA ADS] [CrossRef] [EDP Sciences] [Google Scholar]
- Heyer, M. H., Carpenter, J. M., & Snell, R. L. 2001, ApJ, 551, 852 [NASA ADS] [CrossRef] [Google Scholar]
- Hoq, S., Jackson, J. M., Foster, J. B., et al. 2013, ApJ, 777, 157 [NASA ADS] [CrossRef] [Google Scholar]
- Hou, L. G., Han, J. L., & Shi, W. B. 2009, A&A, 499, 473 [NASA ADS] [CrossRef] [EDP Sciences] [Google Scholar]
- Jansen, D. J., van Dishoeck, E. F., Black, J. H., Spaans, M., & Sosin, C. 1995, A&A, 302, 223 [NASA ADS] [Google Scholar]
- Kurtz, S. E., Watson, A. M., Hofner, P., & Otte, B. 1999, ApJ, 514, 232 [NASA ADS] [CrossRef] [Google Scholar]
- Lepp, S., & Dalgarno, A. 1996, A&A, 306, L21 [NASA ADS] [Google Scholar]
- Loenen, A. F., Baan, W. A., & Spaans, M. 2006, A&A, 458, 89 [NASA ADS] [CrossRef] [EDP Sciences] [Google Scholar]
- Maloney, P. R., Hollenbach, D. J., & Tielens, A. G. G. M. 1996, ApJ, 466, 561 [NASA ADS] [CrossRef] [Google Scholar]
- Meijerink, R., & Spaans, M. 2005, A&A, 436, 397 [NASA ADS] [CrossRef] [EDP Sciences] [Google Scholar]
- Meijerink, R., Spaans, M., & Israel, F. P. 2006, ApJ, 650, L103 [NASA ADS] [CrossRef] [Google Scholar]
- Rathborne, J. M., Jackson, J. M., & Simon, R. 2006, ApJ, 641, 389 [NASA ADS] [CrossRef] [Google Scholar]
- Reiter, M. R., Shirley, Y. L., Wu, J., et al. 2011, ApJS, 195, 1 [NASA ADS] [CrossRef] [Google Scholar]
- Rodriguez-Franco, A., Martin-Pintado, J., & Fuente, A. 1998, A&A, 329, 1097 [NASA ADS] [Google Scholar]
- Russeil, D., Adami, C., & Georgelin, Y. M. 2007, A&A, 470, 161 [NASA ADS] [CrossRef] [EDP Sciences] [Google Scholar]
- Sakai, T., Sakai, N., Kamegai, K., et al. 2008, ApJ, 678, 1049 [NASA ADS] [CrossRef] [Google Scholar]
- Sanhueza, P., Jackson, J. M., Foster, J. B., et al. 2012, ApJ, 756, 60 [NASA ADS] [CrossRef] [Google Scholar]
- Schilke, P., Walmsley, C. M., Pineau des Forets, G., et al. 1992, A&A, 256, 595 [NASA ADS] [Google Scholar]
- Shan, W. L., Yang, J., Shi, S. C., et al. 2010, in Twenty-First International Symp. on Space Terahertz Technology, 136 [Google Scholar]
- Sridharan, T. K., Beuther, H., Schilke, P., Menten, K. M., & Wyrowski, F. 2002, ApJ, 566, 931 [NASA ADS] [CrossRef] [Google Scholar]
- Sridharan, T. K., Beuther, H., Saito, M., Wyrowski, F., & Schilke, P. 2005, ApJ, 634, L57 [NASA ADS] [CrossRef] [Google Scholar]
- Sternberg, A., & Dalgarno, A. 1995, ApJS, 99, 565 [NASA ADS] [CrossRef] [Google Scholar]
- Tan, J. C., Beltran, M. T., Caselli, P., et al. 2014, in Protostars and Planets VI, eds. H. Beuther, R. S. Klessen, C. P. Dullemond, & T. Henning (University of Arizona Press), in press [arXiv:1402.0919] [Google Scholar]
- Thi, W.-F., van Zadelhoff, G.-J., & van Dishoeck, E. F. 2004, A&A, 425, 955 [NASA ADS] [CrossRef] [EDP Sciences] [Google Scholar]
- Ungerechts, H., Bergin, E. A., Goldsmith, P. F., et al. 1997, ApJ, 482, 245 [NASA ADS] [CrossRef] [PubMed] [Google Scholar]
- van Zadelhoff, G.-J., Aikawa, Y., Hogerheijde, M. R., & van Dishoeck, E. F. 2003, A&A, 397, 789 [NASA ADS] [CrossRef] [EDP Sciences] [Google Scholar]
- Vasyunina, T., Linz, H., Henning, Th., et al. 2011, ApJ, 527, 88 [Google Scholar]
- White, R. L., Becker, R. H., & Helfand, D. J. 2005, AJ, 130, 586 [NASA ADS] [CrossRef] [Google Scholar]
- Wood, D. O. S., & Churchwell, E. 1989, ApJS, 69, 831 [NASA ADS] [CrossRef] [Google Scholar]
- Xu, Y., Voronkov, M. A., Pandian, J. D., et al. 2009, A&A, 507, 1117 [NASA ADS] [CrossRef] [EDP Sciences] [Google Scholar]
- Xue, R., & Wu, Y. F. 2008, ApJ, 680, 446 [NASA ADS] [CrossRef] [Google Scholar]
- Zinnecker, H., & Yorke, H. W. 2007, ARA&A, 45, 481 [NASA ADS] [CrossRef] [Google Scholar]
All Tables
Global line ratios for CN(1-0), HCN(1-0), HNC(1 − 0), and HCO+(1 − 0) for ten galaxies.
Information for observed sources in cm and mm wavelengths and their evolutionary stages.
Observing information for the VLA archival data and the results for radio continuum emission.
Results of the Gaussian fit obtained from the averaged CN(1-0) emission for each clump.
Results of the Gaussian fit obtained from the averaged HCN(1-0) emission for each clump.
Results of the Gaussian fit obtained from the averaged HNC(1-0) emission for each clump.
All Figures
|
Fig. 1 Global line ratios IHCN/IHNC, ICN/IHNC and ICN/IHCN for high-mass starless clumps that coincide with 20 cm continuum emission (denoted by IHCN/IHNC-Y, ICN/IHNC-Y and ICN/IHCN-Y) and those high-mass starless core clumps that do not coincide with 20 cm continuum emission (denoted by IHCN/IHNC-N, ICN/IHNC-N and ICN/IHCN-N). |
| In the text | |
|
Fig. 2 Global line ratios IHCN/IHNC, ICN/IHNC and ICN/IHCN for high-mass protostar clumps that coincide with 20 cm continuum emission (denoted by IHCN/IHNC-Y, ICN/IHNC-Y and ICN/IHCN-Y) and those high-mass protostar clumps that do not coincide with 20 cm continuum emission (denoted by IHCN/IHNC-N, ICN/IHNC-N and ICN/IHCN-N). |
| In the text | |
|
Fig. 3 Global line ratios IHCN/IHNC, ICN/IHNC and ICN/IHCN for UCHII region clumps that coincide with 20 cm continuum emission (denoted by IHCN/IHNC-Y, ICN/IHNC-Y and ICN/IHCN-Y) and those UCHII region clumps that do not coincide with 20 cm continuum emission (denoted by IHCN/IHNC-N, ICN/IHNC-N and ICN/IHCN-N). |
| In the text | |
|
Fig. 4 Global line ratios IHCN/IHNC and ICN/IHNC for type 1 and 2 sources, which show a clear trend of increase from type 1 to type 2 sources. |
| In the text | |
|
Fig. 5 Plot of IHCN/IHNC versus ICN/IHNC showing that type 1 and 2 sources can be distinguished from each other. Circles and asterisks represent type 1 and type 2 sources. |
| In the text | |
|
Fig. 6 Contour maps for the integrated intensity of CN 1-0 (green), HCN (red) and HNC 1-0 (blue) for four representative clumps superimposed on their respective continuum map in gray scale at 8.4 (or 4.8) GHz (left) and 1.4 GHz continuum map (right). The contour levels are 30%, 50%, 70%, and 90% of the map peak, the heavy lines represent 50%. Here CN(1-0), HCN(1-0), and HNC(1-0) emission of G22.35+0.41 is very weak, the corresponding contour levels are 2σ, 3σ (heavy line), 4σ, and 5σ. The red asterisk in the map indicates the position of HMSC, HMPO, UCHII, and HII regions. The red circle in the bottom left corner represents the FWHM beam size for the molecular lines, the enclosed black circle indicates continuum emission observations. The horizontal lines in the bottom right corner of the left panels indicate the linear scale corresponding to one arcminute at the distance of the respective clump. The unit of the gray scale bar on the right is in Jy/beam. |
| In the text | |
|
Fig. B.1 Contour maps for the integrated intensity of CN 1-0 (green), HCN (red) and HNC 1-0 (blue) from each clump superimposed on their respective continuum map in gray scale at 8.4 (or 4.8) GHz (left) and 1.4 GHz continuum map (right). The contour levels are 30%, 50%, 70%, and 90% of the map peak. The heavy lines represent 50% of the map peak. Here CN(1-0), HCN(1-0), and HNC(1-0) emission of G22.35+0.41, G23.60+0.00A, G23.60+0.00B, I18310-0825A and I18310-0825B is very weak, the corresponding contour levels are 2σ, 3σ (heavy line), 4σ and 5σ, respectively. The red asterisk in the map indicates the position of HMSC, HMPO, UCHII and HII regions. The red circle in the bottom left corner represents the FWHM beam size for molecular lines, the enclosed black circle indicates continuum emission observations. The short line in the bottom right corner of the left panel indicates the linear scale corresponding to one arcminute at the distance of the clump. The unit of the gray scale bar on the right is in Jy/beam. |
| In the text | |
|
Fig. B.1 continued. |
| In the text | |
|
Fig. B.1 continued. |
| In the text | |
|
Fig. B.1 continued. |
| In the text | |
|
Fig. B.1 continued. |
| In the text | |
|
Fig. B.1 continued. |
| In the text | |
|
Fig. B.1 continued. |
| In the text | |
|
Fig. B.1 continued. |
| In the text | |
|
Fig. B.1 continued. |
| In the text | |
|
Fig. B.1 continued. |
| In the text | |
|
Fig. B.1 continued. |
| In the text | |
|
Fig. B.1 continued. |
| In the text | |
|
Fig. B.1 continued. |
| In the text | |
|
Fig. B.1 continued. |
| In the text | |
|
Fig. B.1 continued. |
| In the text | |
|
Fig. C.1 The CN(1-0), HCN(1-0) and HNC(1-0) spectra averaged over each clump. |
| In the text | |
|
Fig. C.1 continued. |
| In the text | |
|
Fig. C.1 continued. |
| In the text | |
|
Fig. C.1 continued. |
| In the text | |
|
Fig. C.1 continued. |
| In the text | |
|
Fig. C.1 continued. |
| In the text | |
|
Fig. C.1 continued. |
| In the text | |
|
Fig. C.1 continued. |
| In the text | |
Current usage metrics show cumulative count of Article Views (full-text article views including HTML views, PDF and ePub downloads, according to the available data) and Abstracts Views on Vision4Press platform.
Data correspond to usage on the plateform after 2015. The current usage metrics is available 48-96 hours after online publication and is updated daily on week days.
Initial download of the metrics may take a while.